


Grafana Tempo是Grafana Labs开源的一个简单易用、大规模的、分布式链路跟踪后端服务。
Grafana Tempo负责接收Trace数据并生成指标和对接存储对Trace数据进行持久化存储,同时提供查询供可视化展示调研链路关系,以及链路中各Span的详细信息。
Tempo Architecture
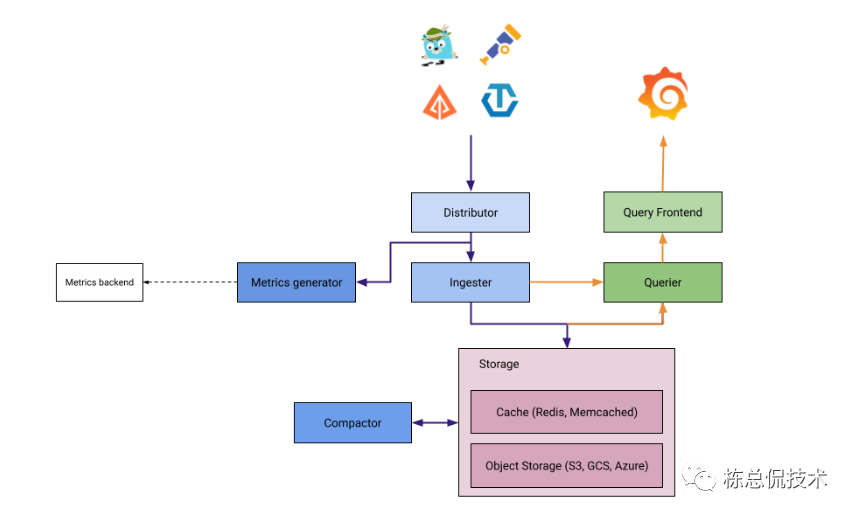
从Grafana Tempo架构图中Tempo中的一系列组件:
Distributor:用于接收服务产生的Trace数据,Tempo支持接收支持OTEL协议的Trace数据,包括Jaeger、Zipkin、OTEL SDK产生的Trace数据。
Ingester:与存储交互,将Distributor接收的指标写入对象存储。
Metrics generator:将链路数据生成指标,这些指标用于在Grafana展示链路的图谱(serviceGraph)。同时链路之间的各个调用的时间、延时指标(P99、P95…)都由Metrics generator根据Trace数据计算为Metrics存储至Prometheus。
Query Frontend:查询组件,供Grafana查询各链路信息,或基于服务查询链路调用列表。
Querier:会将Grafana向Query Frontend的一次请求拆分成若干的小的请求并发的向存储(历史数据)、Ingester(还未持久化存储的当前数据)进行并发查询。
Compactor:对超过存储周期的持久化数据进行删除。
Deploy With Helm
Grafana 官方提供了快速部署的Chart,能够快速对Tempo架构中的各个组件进行部署,并完成相应的配置。
如果是进行demo学习,大家可以参考使用docker-compose部署Tempo的单机模式。单机模式的Tempo可以直接使用本地文件存储,而不需要依赖S3存储。
只需要对Chart的values文件中存储部分进行配置后即可完成默认安装:
storage:
  trace:
    backend: s3
    s3:
      access_key: 'grafana-tempo'
      secret_key: 'supersecret'
      bucket: 'tempo-traces'
      endpoint: 'tempo-minio:9000'
      insecure: true
# MinIO storage configuration
minio:
  enabled: true
  mode: standalone
  rootUser: grafana-tempo
  rootPassword: supersecret
  buckets:
    # Default Tempo storage bucket
    - name: tempo-traces
      policy: none
      purge: false
以上默认配置参考官方文档中部署章节,如果已经有可用的对象存储,可以将minio.enable设置为false,只需要配置storage的存储连接相关参数。
metricsGenerator
链路跟踪一般都需要展示调用拓扑关系,需要开启运行metricsGenerator配置,在Chart中需要改动的默认配置有两个参数:
将metricsGenerator.enabled设置为true
配置生成的指标remoteWrite至Prometheus的地址。
# Configuration for the metrics-generator
metricsGenerator:
  # -- Specifies whether a metrics-generator should be deployed
  enabled: true
  # -- Annotations for the metrics-generator StatefulSet
  annotations: {}
  # -- Number of replicas for the metrics-generator
  replicas: 1
  # -- hostAliases to add
  hostAliases: []
  #  - ip: 1.2.3.4
  #    hostnames:
  #      - domain.tld
  image:
    # -- The Docker registry for the metrics-generator image. Overrides `tempo.image.registry`
    registry:
    # -- Optional list of imagePullSecrets. Overrides `tempo.image.pullSecrets`
    pullSecrets: []
    # -- Docker image repository for the metrics-generator image. Overrides `tempo.image.repository`
    repository: grafana-tempo
    # -- Docker image tag for the metrics-generator image. Overrides `tempo.image.tag`
    tag: latest
  config:
    storage:
      remote_write:
        - url: http://ip:port/api/v1/write
Tempo gateway
tempo-distributed的Chart包中同时默认支持Tempo gateway组件,通过Nginx反向代理之Tempo各个组件服务,配合Ingress的使用可以统一读写的调用,也可以在gateway配置各种鉴权操作来对接读写请求。
如果需要开启Tempo gateway,以下代码为开启gateway,同时开启鉴权的示例:
gateway:
  basicAuth:
    enabled: true
    password: xxx
    username: xxx
  ingress:
    enabled: true
    hosts:
      - host: tempo-distribute.demo.com
        paths:
          - path: /otlp/v1/traces
            pathType: Prefix
    tls:
      - hosts:
          - tempo-distribute.demo.com
        secretName: xxx

...
通过命令完成部署:
helm -n tempo-distribute install tempo grafana/tempo-distributed -f custom.yaml
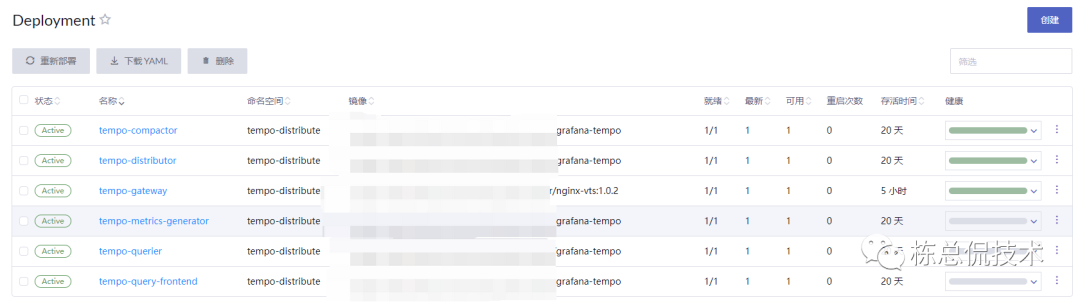
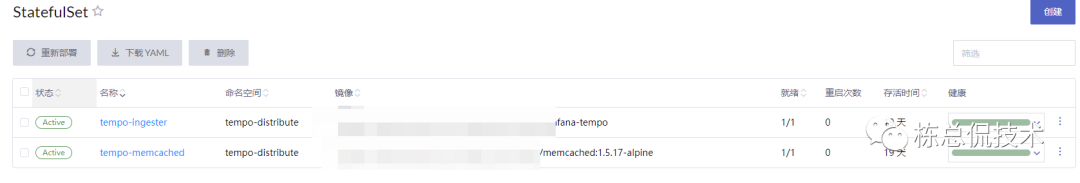
在部署后,可以看到启动了8个服务,6个以Deployment运行,2个Statefulset。
到这里,我们使用Tempo提供的Chart包完成了一个分布式的Tempo服务的部署,下一节将会给大家带来如何将Trace数据发送至Tempo的完整Demo演示。
往期回顾:
