


一、工具介绍
TiDB性能测试使用sysbench工具来进行压测
- CPU 运算性能测试
- 磁盘 IO 性能测试
- 调度程序性能测试
- 内存分配及传输速度测试
- POSIX 线程性能测试
- 数据库性能测试(OLTP 基准测试,需要通过 /usr/share/sysbench/ 目录中的 Lua 脚本执行,例如 oltp_read_only.lua 脚本执行只读测试)
二、sysbench工具安装
1、 Centos的安装
sudo yum install -y sysbench2、查看帮助信息
- # 查看帮助信息
- [tidb@cdh01 ~]$ sudo sysbench --help
- # 查看测试帮助信息
- sudo sysbench fileio help / sudo sysbench cpu help
3、CPU测试信息
- # 查看CPU帮助信息 sudo sysbench cpu help
- [tidb@cdh01 ~]$ sudo sysbench cpu help
- sysbench 1.0.17 (using system LuaJIT 2.0.4)
- cpu options:
- --cpu-max-prime=N upper limit for primes generator [10000]
4、CPU测试
sysbench --cpu-max-prime=10000 --threads=3 cpu run
5、磁盘IO性能测试
- # 磁盘准备阶段
- sysbench --test=fileio --num-threads=8 --file-total-size=20G --file-test-mode=rndrw prepare
-
- # 磁盘IO运行检测
- sysbench --test=fileio --num-threads=8 --file-total-size=20G --file-test-mode=rndrw run
-
- Extra file open flags: (none)
- 128 files, 240MiB each
- 30GiB total file size
- Block size 16KiB
- Number of IO requests: 0
- Read/Write ratio for combined random IO test: 1.50
- Periodic FSYNC enabled, calling fsync() each 100 requests.
- Calling fsync() at the end of test, Enabled.
- Using synchronous I/O mode
- Doing random r/w test
- Initializing worker threads...
-
- Threads started!
-
-
- File operations:
- reads/s: 843.98
- writes/s: 532.45
- fsyncs/s: 2734.68
-
- Throughput:
- read, MiB/s: 13.75
- written, MiB/s: 9.13
-
- General statistics:
- total time: 9.205s
- total number of events: 38138
-
- Latency (ms):
- min: 0.00
- avg: 6.36
- max: 576.57
- 95th percentile: 45.13
- sum: 300255.96
-
- Threads fairness:
- events (avg/stddev): 1813.5625/196.79
- execution time (avg/stddev): 10.0220/0.03
- sysbench --test=threads --num-threads=64 --thread-yields=100 --thread-locks=2 run
- 测试写入64线程请求,每个请求产生100个数据量,最后测试执行时间
-
- WARNING: the --test option is deprecated. You can pass a script name or path on the command line without any options.
- WARNING: --num-threads is deprecated, use --threads instead
- sysbench 1.0.17 (using system LuaJIT 2.0.4)
-
- Running the test with following options:
- Number of threads: 64
- Initializing random number generator from current time
-
-
- Initializing worker threads...
-
- Threads started!
-
-
- General statistics:
- total time: 10.0057s
- total number of events: 134204
-
- Latency (ms):
- min: 0.03
- avg: 4.77
- max: 74.11
- 95th percentile: 16.71
- sum: 639949.82
-
- Threads fairness:
- events (avg/stddev): 3396.9375/94.14
- execution time (avg/stddev): 10.87/0.00 # 测试最后执行时间为10秒
7、内存测试
- sysbench --test=memory --memory-block-size=8k --memory-total-size=40G run
-
- WARNING: the --test option is deprecated. You can pass a script name or path on the command line without any options.
- sysbench 1.0.17 (using system LuaJIT 2.0.4)
-
- Running the test with following options:
- Number of threads: 1
- Initializing random number generator from current time
-
- Running memory speed test with the following options:
- block size: 8KiB
- total size: 40960MiB
- operation: write
- scope: global
- Initializing worker threads...
- Threads started!
- Total operations: 5242880 (1073492.41 per second)
- 40960.00 MiB transferred (8386.66 MiB/sec)
- General statistics:
- total time: 3.7621s
- total number of events: 4231760
-
- Latency (ms):
- min: 0.00
- avg: 0.00
- max: 2.40
- 95th percentile: 0.00
- sum: 4321.53
-
- Threads fairness:
- events (avg/stddev): 4541560.0000/0.00
- execution time (avg/stddev): 5.6342/0.00
8、TiDB OLTP基准测试
基准测试分为2个步骤进行:基准测试脚本如下:

1)首先需要先生成测试表
- 运行命令查看mysql数据库测试参数标准:sudo sysbeach --help
- --mysql-host=[LIST,...] MySQL server host [localhost] mysql主机ip
- --mysql-port=[LIST,...] MySQL server port [3306] 端口/mysql默认端口3306 tidb端口 4000
- --mysql-socket=[LIST,...] MySQL socket mysql安装路径
- --mysql-user=STRING MySQL user [sbtest] 数据库用户名
- --mysql-password=STRING MySQL password [] 密码
- --mysql-db=STRING MySQL database name [sbtest] 需要进行压测的数据库名称
- --mysql-ssl[=on|off] use SSL connections, if available in the client library [off]
- --mysql-ssl-cipher=STRING use specific cipher for SSL connections []
- --mysql-compression[=on|off] use compression, if available in the client library [off]
- --mysql-debug[=on|off] trace all client library calls [off]
- --mysql-ignore-errors=[LIST,...] list of errors to ignore, or "all" [1213,1020,1205]
- --mysql-dry-run[=on|off] Dry run, pretend that all MySQL client API calls are successful without executing them [off]
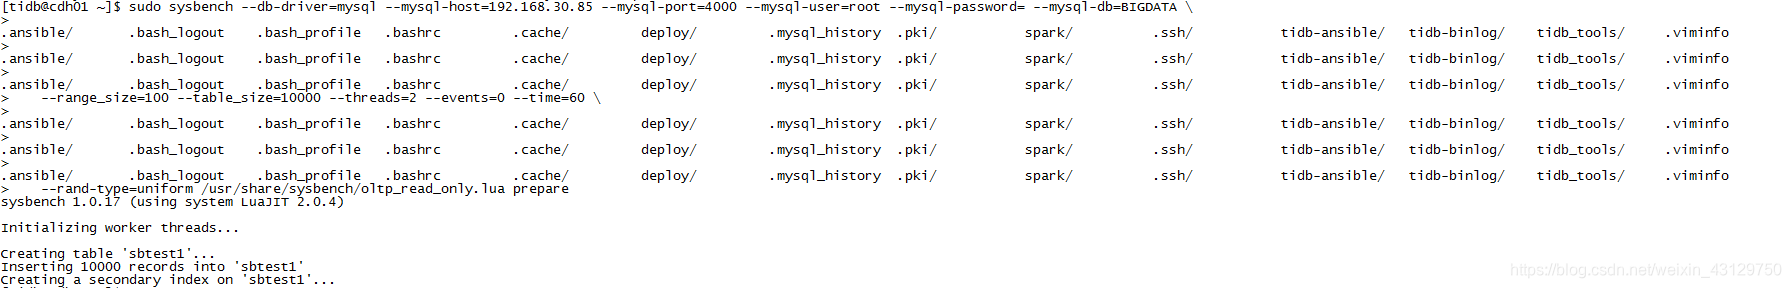
- # 运行语句生成测试表
- sudo sysbench --db-driver=mysql --mysql-host=ip --mysql-port=4000 \
- --mysql-user=root --mysql-password= --mysql-db=BIGDATA \
- --range_size=100 --table_size=10000 --threads=2 --events=0 --time=60 \
- --rand-type=uniform /usr/share/sysbench/oltp_read_only.lua prepare
2)运行语句进行测试(表的读性能统计基于表的数据是10000)
- 运行测试.lua测试语句并指定线程数
- sudo sysbench --db-driver=mysql --mysql-host=ip --mysql-port=4000 \
- --mysql-user=root --mysql-password= --mysql-db=BIGDATA \
- --range_size=100 --table_size=10000 --threads=2 --events=0 --time=60 \
- --rand-type=uniform /usr/share/sysbench/oltp_read_only.lua run
程序运行结果如下:
- Threads started!
- SQL statistics:
- queries performed: #性能统计
- read: 63854 # 读统计 (select语句)
- write: 0 # 写统计 (insert、delete、update语句)
- other: 9122 # 其他语句 (如commit等)
- total: 72976 # 总执行语句之和
- transactions: 3451 (76.00 per sec.) #总事务数(每秒处理的事务)
- queries: 62254 (1216.08 per sec.) #查询性能(每秒的查询性能)
- ignored errors: 0 (0.00 per sec.)
- reconnects: 0 (0.00 per sec.)
-
- General statistics:
- total time: 45.34s # 总时长
- total number of events: 3679 # 事务总数
-
- Latency (ms): #延迟时间
- min: 21.21 # 最小延迟时间
- avg: 34.51 # 平均延迟
- max: 1235.56 # 最大延迟
- 95th percentile: 46.23 # 95%以上语句响应时间
- sum: 119963.62 # 总延迟时长
-
- Threads fairness: # 线程公平性
- events (avg/stddev): 2360.5000/0.50
- execution time (avg/stddev): 63.9723/0.0
最后修改时间:2024-09-27 16:55:28
「喜欢这篇文章,您的关注和赞赏是给作者最好的鼓励」
关注作者
【版权声明】本文为墨天轮用户原创内容,转载时必须标注文章的来源(墨天轮),文章链接,文章作者等基本信息,否则作者和墨天轮有权追究责任。如果您发现墨天轮中有涉嫌抄袭或者侵权的内容,欢迎发送邮件至:contact@modb.pro进行举报,并提供相关证据,一经查实,墨天轮将立刻删除相关内容。
