


 关注下方公众号,获取更多热点资讯
MySQL一键巡检脚本!再也不用自己梳理了
在日常的 MySQL 运维工作中,了解数据库的基本配置和性能状态是确保数据库稳定运行的重要一环。通过对 MySQL 配置项、连接数、Binlog、GTID、InnoDB 等关键参数的深入了解,可以帮助我们更好地掌握数据库的运行情况,并提前发现潜在的问题。
本篇文章将介绍如何通过一系列 SQL 查询语句快速获取 MySQL 的基本配置、连接数情况、Binlog 和 GTID 配置,以及 InnoDB 配置信息和监控指标。此外,我们还提供了一个简便的脚本,让您可以一键获取所有这些信息,为您的 MySQL 巡检工作提供便利。
文末有脚本获取地址,如果监控缺少指标可以自行添加;也可以留言,我将定期更新该脚本内容。
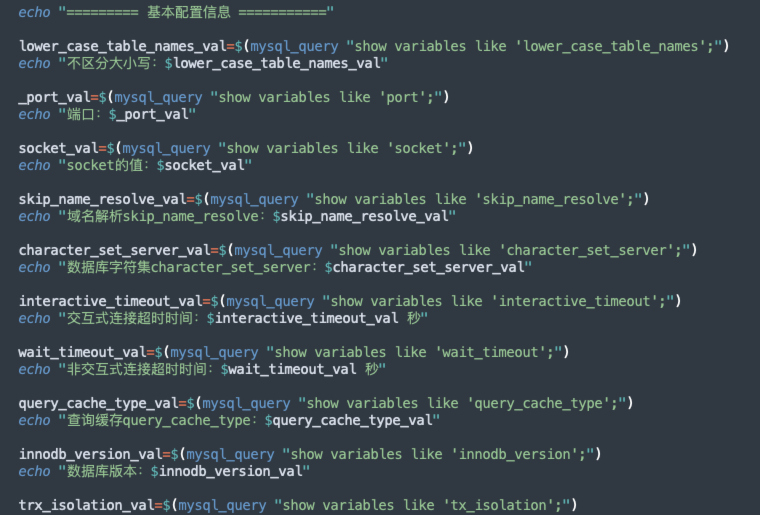
基本配置信息
| 配置项 | 说明 | 执行语句 |
lower_case_table_names | 是否区分表名大小写 | show variables like 'lower_case_table_names'; |
port | MySQL 服务端口 | show variables like 'port'; |
socket | MySQL socket 文件路径 | show variables like 'socket'; |
skip_name_resolve | 是否跳过域名解析 | show variables like 'skip_name_resolve'; |
character_set_server | 数据库字符集 | show variables like 'character_set_server'; |
interactive_timeout | 交互式连接超时时间(秒) | show variables like 'interactive_timeout'; |
wait_timeout | 非交互式连接超时时间(秒) | show variables like 'wait_timeout'; |
query_cache_type | 查询缓存类型 | show variables like 'query_cache_type'; |
innodb_version | InnoDB 版本 | show variables like 'innodb_version'; |
tx_isolation | 事务隔离级别 | show variables like 'tx_isolation'; |
datadir | MySQL 数据文件存放位置 | show variables like '%datadir%'; |
连接数配置信息
| 配置项 | 说明 | 执行语句 |
max_connections | 最大连接数 | show variables like 'max_connections'; |
Max_used_connections | 当前连接数 | show status like 'Max_used_connections'; |
max_connect_errors | 最大连接错误次数 | show variables like 'max_connect_errors'; |
Binlog 配置信息
| 配置项 | 说明 | 执行语句 |
sync_binlog | Binlog 同步频率 | show variables like 'sync_binlog'; |
binlog_format | Binlog 格式 | show variables like 'binlog_format'; |
log_bin | Binlog 文件路径 | show variables like 'log-bin'; |
expire_logs_days | Binlog 文件过期时间 | show variables like 'expire_logs_days'; |
GTID 配置信息
| 配置项 | 说明 | 执行语句 |
gtid_mode | 是否开启 GTID 模式 | show variables like 'gtid_mode'; |
enforce_gtid_consistency | 是否强制 GTID 一致性 | show variables like 'enforce_gtid_consistency'; |
log_slave_updates | 是否开启级联复制 | show variables like 'log_slave_updates'; |
InnoDB 配置信息
| 配置项 | 说明 | 执行语句 |
innodb_buffer_pool_size | InnoDB 缓存池大小 | show variables like 'innodb_buffer_pool_size'; |
innodb_log_file_size | InnoDB 日志文件大小 | show variables like 'innodb_log_file_size'; |
innodb_flush_log_at_trx_commit | 事务提交时刷新日志的频率 | show variables like 'innodb_flush_log_at_trx_commit'; |
innodb_io_capacity | InnoDB IO 容量 | show variables like 'innodb_io_capacity'; |
监控指标
| 监控项 | 说明 | 执行语句 |
innodb_buffer_pool_size_mb | InnoDB 缓存池大小(MB) | 从 innodb_buffer_pool_size计算得出 |
Qcache_hits | 查询缓存命中次数 | show status like 'Qcache_hits'; |
Qcache_inserts | 查询缓存插入次数 | show status like 'Qcache_inserts'; |
Threads_connected | 当前连接的线程数 | show status like 'Threads_connected'; |
Threads_running | 当前运行的线程数 | show status like 'Threads_running'; |
Threads_created | 创建的线程数 | show status like 'Threads_created'; |
Threads_cached | 缓存的线程数 | show status like 'Threads_cached'; |
Slow_queries | 慢查询次数 | show status like 'Slow_queries'; |
Innodb_rows_read | InnoDB 读取的行数 | show status like 'Innodb_rows_read'; |
Innodb_rows_inserted | InnoDB 插入的行数 | show status like 'Innodb_rows_inserted'; |
Innodb_rows_updated | InnoDB 更新的行数 | show status like 'Innodb_rows_updated'; |
Innodb_rows_deleted | InnoDB 删除的行数 | show status like 'Innodb_rows_deleted'; |
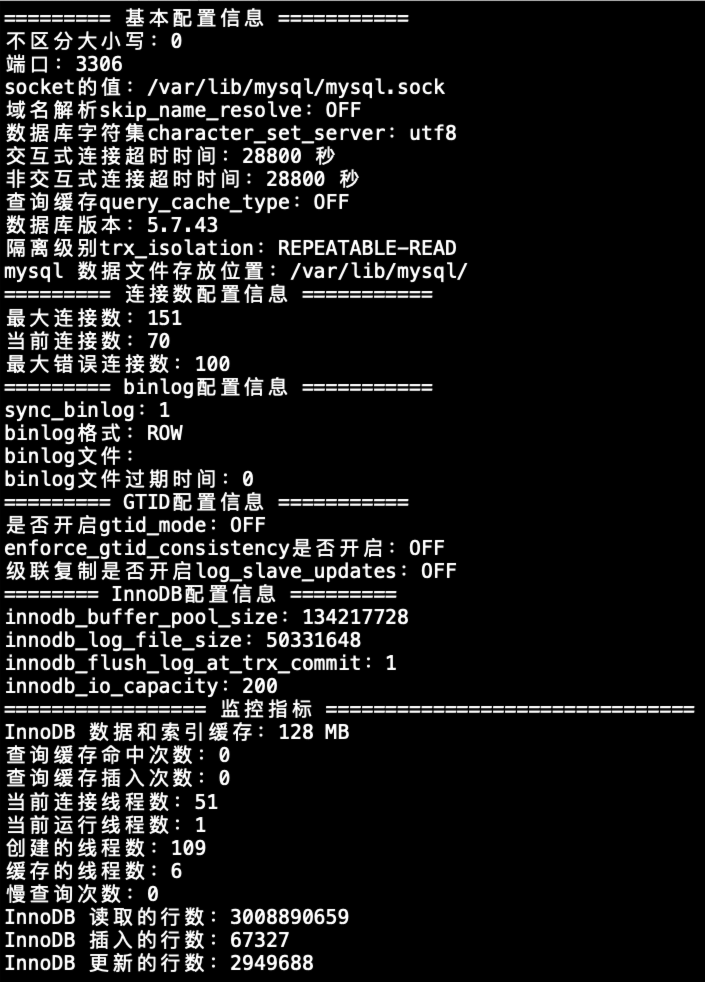
部分效果展示
一键脚本获取
关注公众号回复”9919“ 或者 回复 ”MySQL巡检脚本“领取
欢迎关注我的公众号“编程与架构”,原创技术文章第一时间推送。
文章转载自编程与架构,如果涉嫌侵权,请发送邮件至:contact@modb.pro进行举报,并提供相关证据,一经查实,墨天轮将立刻删除相关内容。
