


今天下午项目经理在数据库监控看见一则告警ORA-600 [723],第一次遇见ORA-600的报错记录一下。
数据库版本
Oracle Database 19c Enterprise Edition Release 19.0.0.0.0 - Production
Version 19.9.0.0.0
Build label: RDBMS_19.9.0.0.0DBRU_LINUX.X64_200930
System name: Linux
Release: 3.10.0-957.el7.x86_64
Machine: x86_64
症状
查看数据库alert_<db_name>.log报告显示存在内存泄漏:ORA-00600 [723], [311136], [33425928], [memory leak]
2024-11-26T16:21:19.189897+08:00
Errors in file /oracle/app/oracle/diag/rdbms/ORACLE_SID/<db_name>/trace/<db_name>_dw00_54720.trc  (incident=4817062):
ORA-00600: internal error code, arguments: [723], [311136], [33425928], [memory leak], [], [], [], [], [], [], [], []
Incident details in: /oracle/app/oracle/diag/rdbms/ORACLE_SID/<db_name>/incident/incdir_4817062/<db_name>_dw00_54720_i4817062.trc
Use ADRCI or Support Workbench to package the incident.
See Note 411.1 at My Oracle Support for error and packaging details.
2024-11-26T16:21:20.616513+08:00
Errors in file /oracle/app/oracle/diag/rdbms/ORACLE_SID/<db_name>/incident/incdir_4817062/<db_name>_dw00_54720_i4817062.trc:
ORA-00600: internal error code, arguments: [723], [311136], [33425928], [memory leak], [], [], [], [], [], [], [], []
2024-11-26T16:22:30.955732+08:00
Started service SYS.KUPC$C_1_20241126162230_0/SYS$SYS.KUPC$C_1_20241126162230_0.ORACLE_SID.HEBEI.MOBILE.COM/SYS$SYS.KUPC$C_1_20241126162230_0.ORACLE_SID.HEBEI.MOBILE.COM
2024-11-26T16:22:31.305828+08:00
Started service SYS.KUPC$S_1_20241126162230_0/SYS$SYS.KUPC$S_1_20241126162230_0.ORACLE_SID.HEBEI.MOBILE.COM/SYS$SYS.KUPC$S_1_20241126162230_0.ORACLE_SID.HEBEI.MOBILE.COM
2024-11-26T16:22:31.542848+08:00
DM00 started with pid=3870, OS id=126043, job DBMT.SYS_EXPORT_TABLE_17
2024-11-26T16:22:33.380167+08:00

DW00 started with pid=4274, OS id=9467, wid=1, job DBMT.SYS_EXPORT_TABLE_17
2024-11-26T16:23:46.647718+08:00

XDB initialized.
2024-11-26T16:24:10.064849+08:00
WARNING: too many parse errors, count=118250 SQL hash=0xffd6baf5
PARSE ERROR: ospid=62677, error=942 for statement:
2024-11-26T16:24:10.065013+08:00
select oid,queueno,windowno from XXXTABLE t where status='1' and trunc(intime)=trunc(sysdate) and region=:1  and orgid=:2  order by intime
Additional information: hd=0x29dfa0090 phd=0x58df50b38 flg=0x100476 cisid=775 sid=775 ciuid=775 uid=775 sqlid=dq12bt3zxdfrp
...Current username=SH
...Application: JDBC Thin Client Action:
2024-11-26T16:32:30.069306+08:00
WARNING: too many parse errors, count=119250 SQL hash=0xffd6baf5
PARSE ERROR: ospid=42412, error=942 for statement:
2024-11-26T16:32:30.069474+08:00
select oid,queueno,windowno from XXXTABLE t where status='1' and trunc(intime)=trunc(sysdate) and region=:1  and orgid=:2  order by intime
Additional information: hd=0x29dfa0090 phd=0x58df50b38 flg=0x100476 cisid=775 sid=775 ciuid=775 uid=775 sqlid=dq12bt3zxdfrp
...Current username=SH
...Application: JDBC Thin Client Action:
2024-11-26T16:40:50.072850+08:00
WARNING: too many parse errors, count=120250 SQL hash=0xffd6baf5
PARSE ERROR: ospid=46204, error=942 for statement:
2024-11-26T16:40:50.073008+08:00
select oid,queueno,windowno from XXXTABLE t where status='1' and trunc(intime)=trunc(sysdate) and region=:1  and orgid=:2  order by intime
Additional information: hd=0x29dfa0090 phd=0x58df50b38 flg=0x100476 cisid=775 sid=775 ciuid=775 uid=775 sqlid=dq12bt3zxdfrp
...Current username=SH
有两条ORA-00600: internal error code, arguments: [723], [311136], [33425928], [memory leak], [], [], [], [], [], [], [], [] 导师说不多可以忽略。
查看trc记录:
*** 2024-11-26T16:21:19.190757+08:00
[TOC00000]
Jump to table of contents
Dump continued from file: /oracle/app/oracle/diag/rdbms/ORACLE_SID/<db_name>/trace/<db_name>_dw00_54720.trc
[TOC00001]
ORA-00600: internal error code, arguments: [723], [311136], [33425928], [memory leak], [], [], [], [], [], [], [], []

[TOC00001-END]
[TOC00002]
========= Dump for incident 4817062 (ORA 600 [723]) ========
[TOC00003]
----- Beginning of Customized Incident Dump(s) -----
******** ERROR: PGA memory leak detected 33425928 > 362336 ********
********      : Ignored first 51200 bytes leaked ********
========================================
SUMMARIZED MEMORY USAGE FOR THIS PROCESS
----------------------------------------
 33425472 bytes,   2 chunks: "klu.c partial buffer      "
          pga heap        ds=0x7ffff7f88200  dsprt=(nil)
 12808312 bytes,  72 chunks: "free memory               "
          pga heap        ds=0x7ffff7f88200  dsprt=(nil)
   521320 bytes,   7 chunks: "free memory               "
          top call heap   ds=0x7ffff7f8ab20  dsprt=(nil)
   294928 bytes,   1 chunk : "retryRq_kfiopg            "
          pga heap        ds=0x7ffff7f88200  dsprt=(nil)
   294928 bytes,   1 chunk : "drqlist_kfiopg            "
          pga heap        ds=0x7ffff7f88200  dsprt=(nil)
   196672 bytes,   1 chunk : "NOSYNC FOB ptr            "
          pga heap        ds=0x7ffff7f88200  dsprt=(nil)
    85856 bytes,   2 chunks: "row cache                 "
          pga heap        ds=0x7ffff7f88200  dsprt=(nil)
    71696 bytes,   1 chunk : "ksectab: kseget           "
          pga heap        ds=0x7ffff7f88200  dsprt=(nil)
    65584 bytes,   2 chunks: "FOB ptr array             "
          pga heap        ds=0x7ffff7f88200  dsprt=(nil)
    65384 bytes,   1 chunk : "free memory               "
          top uga heap    ds=0x7ffff7f8ade0  dsprt=(nil)
    61824 bytes,   3 chunks: "callback hsn              "
          pga heap        ds=0x7ffff7f88200  dsprt=(nil)
    54640 bytes,   5 chunks: "free permanent memory     "
原因
此症状是有一个bug引起的,参照MOS:ORA-600 [723] “PGA memory leak” (文档 ID 39308.1)
Note: For additional ORA-600 related information please read Note:146580.1

PURPOSE:

  This article discusses the internal error "ORA-600 [723]", what
  it means and possible actions. The information here is only applicable
  to the versions listed and is provided only for guidance.

ERROR:

  Format: ORA-600 [723] [a] [b] [c]
VERSIONS:
  versions 6.0 and later

DESCRIPTION:

  There is a memory leak in the Program Global Area (PGA)

  The PGA is checked for Space Leaks at logoff time. This error is reported when a leak was found.

  There is no data corruption with this error.

ARGUMENTS:

There are two formats for this error.

Two Argument format:

  Arg [a] Logoff PGA size in bytes
  Arg [b] Text related to the leak. Typically "memory leak"

Three Argument format:

  Arg [a] Minimum acceptable leak (This indicates that EVENT 10262 is already active)
  Arg [b] Logoff PGA size in bytes  (This value should be > Arg [a] - however, see Note below)
  Arg [c] "memory leak"

  Note: Due to a bug, before Oracle 11gR1, Arg [a] and Arg [b] were reported as being the same value.

FUNCTIONALITY:
  MEMORY COMPONENT

IMPACT:
  PROCESS FAILURE - but only during session delete so impact is minimal
  NON CORRUPTIVE - No underlying data corruption.

SUGGESTIONS:

  Event 10262 can be set to safely ignore small memory leaks.

  Set the following event in the init.ora file to disable, for example, space leaks less than 4000 bytes:

        event = "10262 trace name context forever, level 4000"

  Then stop and restart the database.

  Repeated errors can be diagnosed further by sending the alert.log and trace files to Oracle Support Services.

  Known Issues:
文档记录9.2.08至23.6版本共有73个bug,其中19.9有22个
The list below is restricted to show only bugs believed to affect version 19.9.
Other bugs may affect this version but have not been confirmed as being relevant yet.
There are 22 bugs listed.
| NB | Prob | Bug | Fixed | Description |
|---|---|---|---|---|
| II | 28751438 | ORA-600: internal error code, arguments: [723], [156120], [3895568], [memory leak] | ||
| II | 31949573 | 19.20, 22.1 | aim:ORA-600 [723] - keumnfy:1 | |
| II | 31487789 | 21.1 | aim:ORA-600 [723] - kcfis appl fds | |
| - | 36852839 | ORA-600 [723] memory leak in “mdexoInsMbrsIntoFrstBkt” with SDO | ||
| - | 36587681 | ORA-600 [723] is returned when retrying to open the ASM password file many times after hitting an error every open | ||
| I | 36173818 | 23.4 | ORA-600[723] With Memory Chunk “kxscwh-pheap-aggrunion” | |
| III | 35597425 | 19.23, 23.4 | ORA-600 [723] in RFS process | |
| II | 36169616 | 23.4 | ORA-600 [723] chunk kxscwh-pheap-aggrunion (sdo-side) | |
| I | 33463044 | 19.17, 21.8 | sched::schedstress hit ora 600 [723] while stopping db services - “jskscfbc: 10” chunk leaking | |
| II | 34488853 | 19.22 | ORA-600 [723] memory leak in “KZEPGA KZTSMCD” with TDE | |
| II | 32547361 | 19.20 | ORA-00600 [723] memory leak for “SMR heap desc” | |
| III | 34224381 | 19.18 | ORA-600: internal error code, arguments: [723], [913056], [39163600], [memory leak] for variable “fnos_krcpbfswc” | |
| II | 33758069 | 19.17 | ORA-600 [723] reported by CTWR process | |
| - | 32035483 | 19.19 | OGG: IR/PRIR Possible Memory Leak Handling Lob & Long Raw: knasnblp2l:knasblp2l:lngbu:ORA-600 [723] | |
| IIII | 31047022 | 19.10 | ORA-600 [723] - Memory Leak In Direct Path Data Pump Export | |
| II | 31429973 | ORA-600 [723] memory leak in ‘buf_kgcbz2state’ during Datapump Import | ||
| III | 30894306 | 19.22 | ORA-600 [723] Memory Leak in “MDGORDADT[xx]” for Spatial Queries | |
| I | 31846318 | 19.15 | Memory Leak ORA-600 [723] error may be reported on chunk “allocate phObje” | |
| E | III | 31377129 | 19.10 | Network Link Data Pump Import Might Hit ORA-00600 [723] |
| II | 32196492 | 19.12 | AIM:ORA-600 [723] - keumnfy:1 | |
| II | 30059821 | 19.11, 20.1 | ORA - 7445 [kghstack_alloc] Or PGA Leak ORA-600 [723] In KGHSTACK | |
| IIII | 28922767 | 19.11, 20.1 | ORA-600[723] While Running Workload And Simultaneously Exporting Table Data |
解决
如果事件不频繁可以忽略,否则可以打补丁升级或者通过 event = "10262 trace name context forever, level 4000"屏蔽这个报错
PGA 内存泄漏本身无法通过解决方法来防止,但可以通过设置此事件来防止将 ORA600:[723] 报告给跟踪文件和警报日志。例如,屏蔽小于 5Mb 的泄漏错误,设置:
event="10262 trace name context forever, level 5242880"
引用
ORA-600 [723] “PGA memory leak” (文档 ID 39308.1)
todo
- 共享池的内存结构
- X$KSMSP
- alert中还有一个警告,数据库解析错误:WARNING: too many parse errors, count=xxx SQL hash=xxx,
最早开始11-23号
WARNING: too many parse errors, count=430012 SQL hash=0xffd6baf5
PARSE ERROR: ospid=91071, error=942 for statement:
2024-11-23T08:14:29.609681+08:00
select oid,queueno,windowno from XXXTABLE t where status='1' and trunc(intime)=trunc(sysdate) and region=:1  and orgid=:2  order by intime
Additional information: hd=0x5880926b8 phd=0x58f0d60a8 flg=0x100476 cisid=775 sid=775 ciuid=775 uid=775 sqlid=dq12bt3zxdfrp
...Current username=SH
解析错误,在vsession、vsql等视图中并未找到sql_id为dq12bt3zxdfrp的sql文本。
数据库中确实存在XXXTABLE这个表对象,所属用户暂认为是A

检查该sql涉及的表各个字段是没有错误的,查看报错信息
>> oerr ora 942
00942, 00000, "table or view does not exist"
// *Cause:
// *Action:
gv$active_session_history查看sql的执行情况
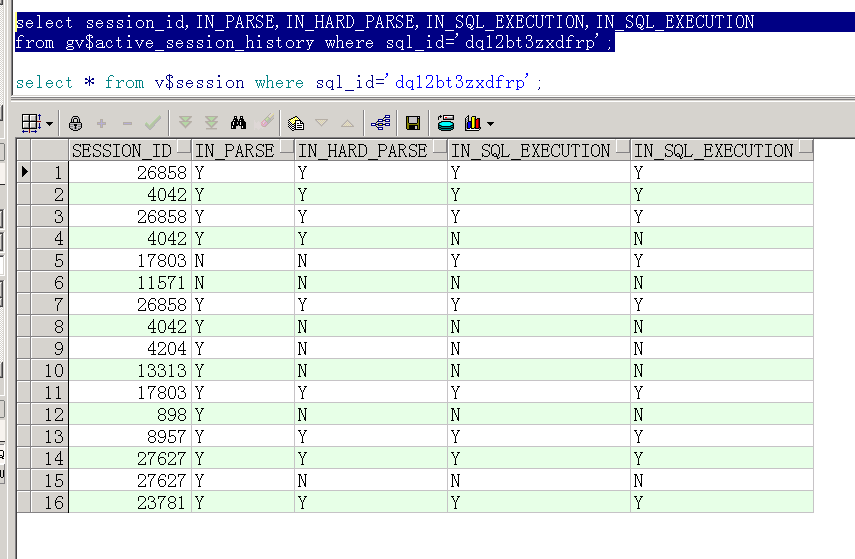
应该是语句写错了,根据报错猜测是没加该表所属的用户,可以在v$session中查看CLIENT_IDENTIFIER反馈给业务,明天问问同事。
还有就是这个SID是怎么分配的啊?怎么23号到27号会话的SID一直是775,但是v$session.logon_time是一直在变的。
