


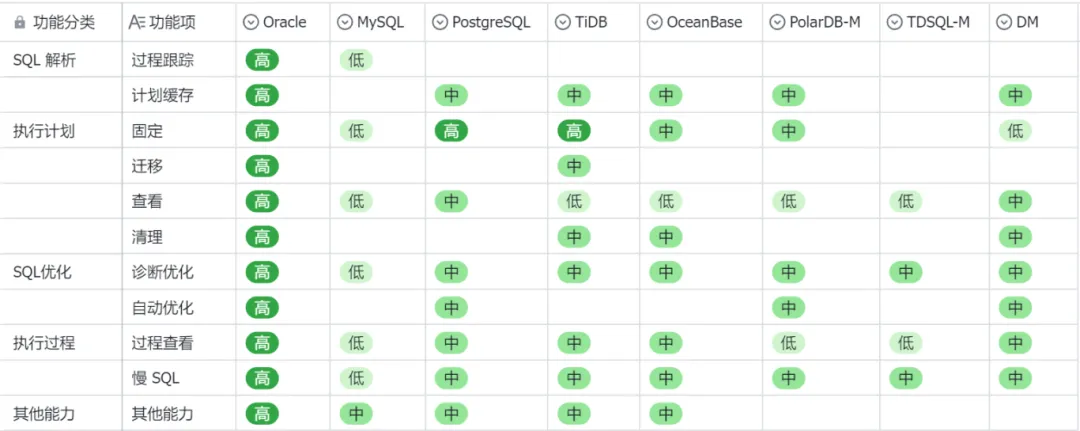
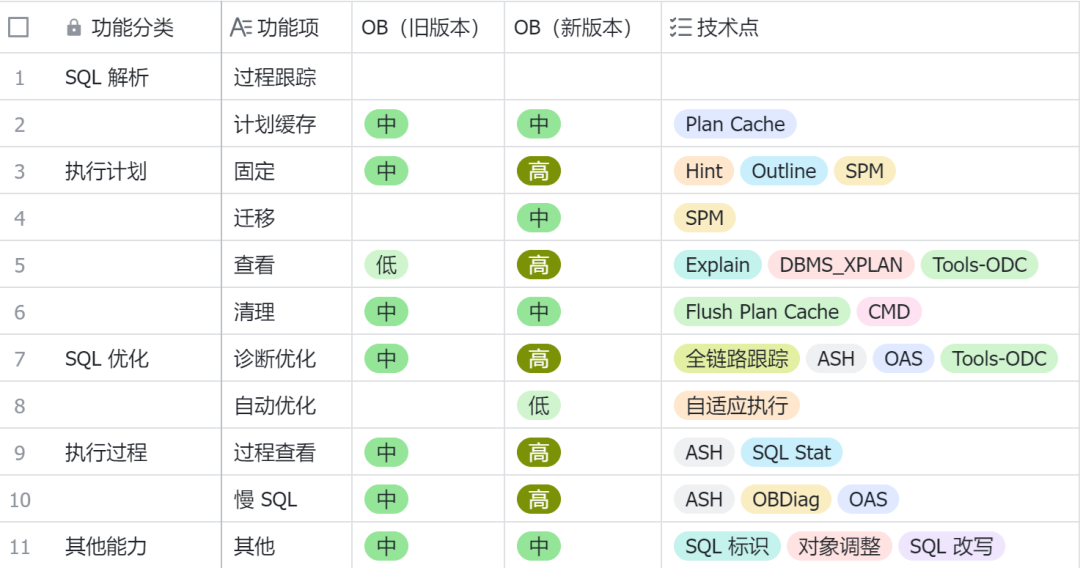
在正式展开之前,我们先回顾下之前对比的情况。之前是从SQL解析、执行计划、SQL优化、执行过程及其他能力五个维度对比部分国产数据库的能力。
下面的测试环境,是采用 OceanBase V4.2.5 的 MySQL 兼容模式。
1).固定执行计划:Hint
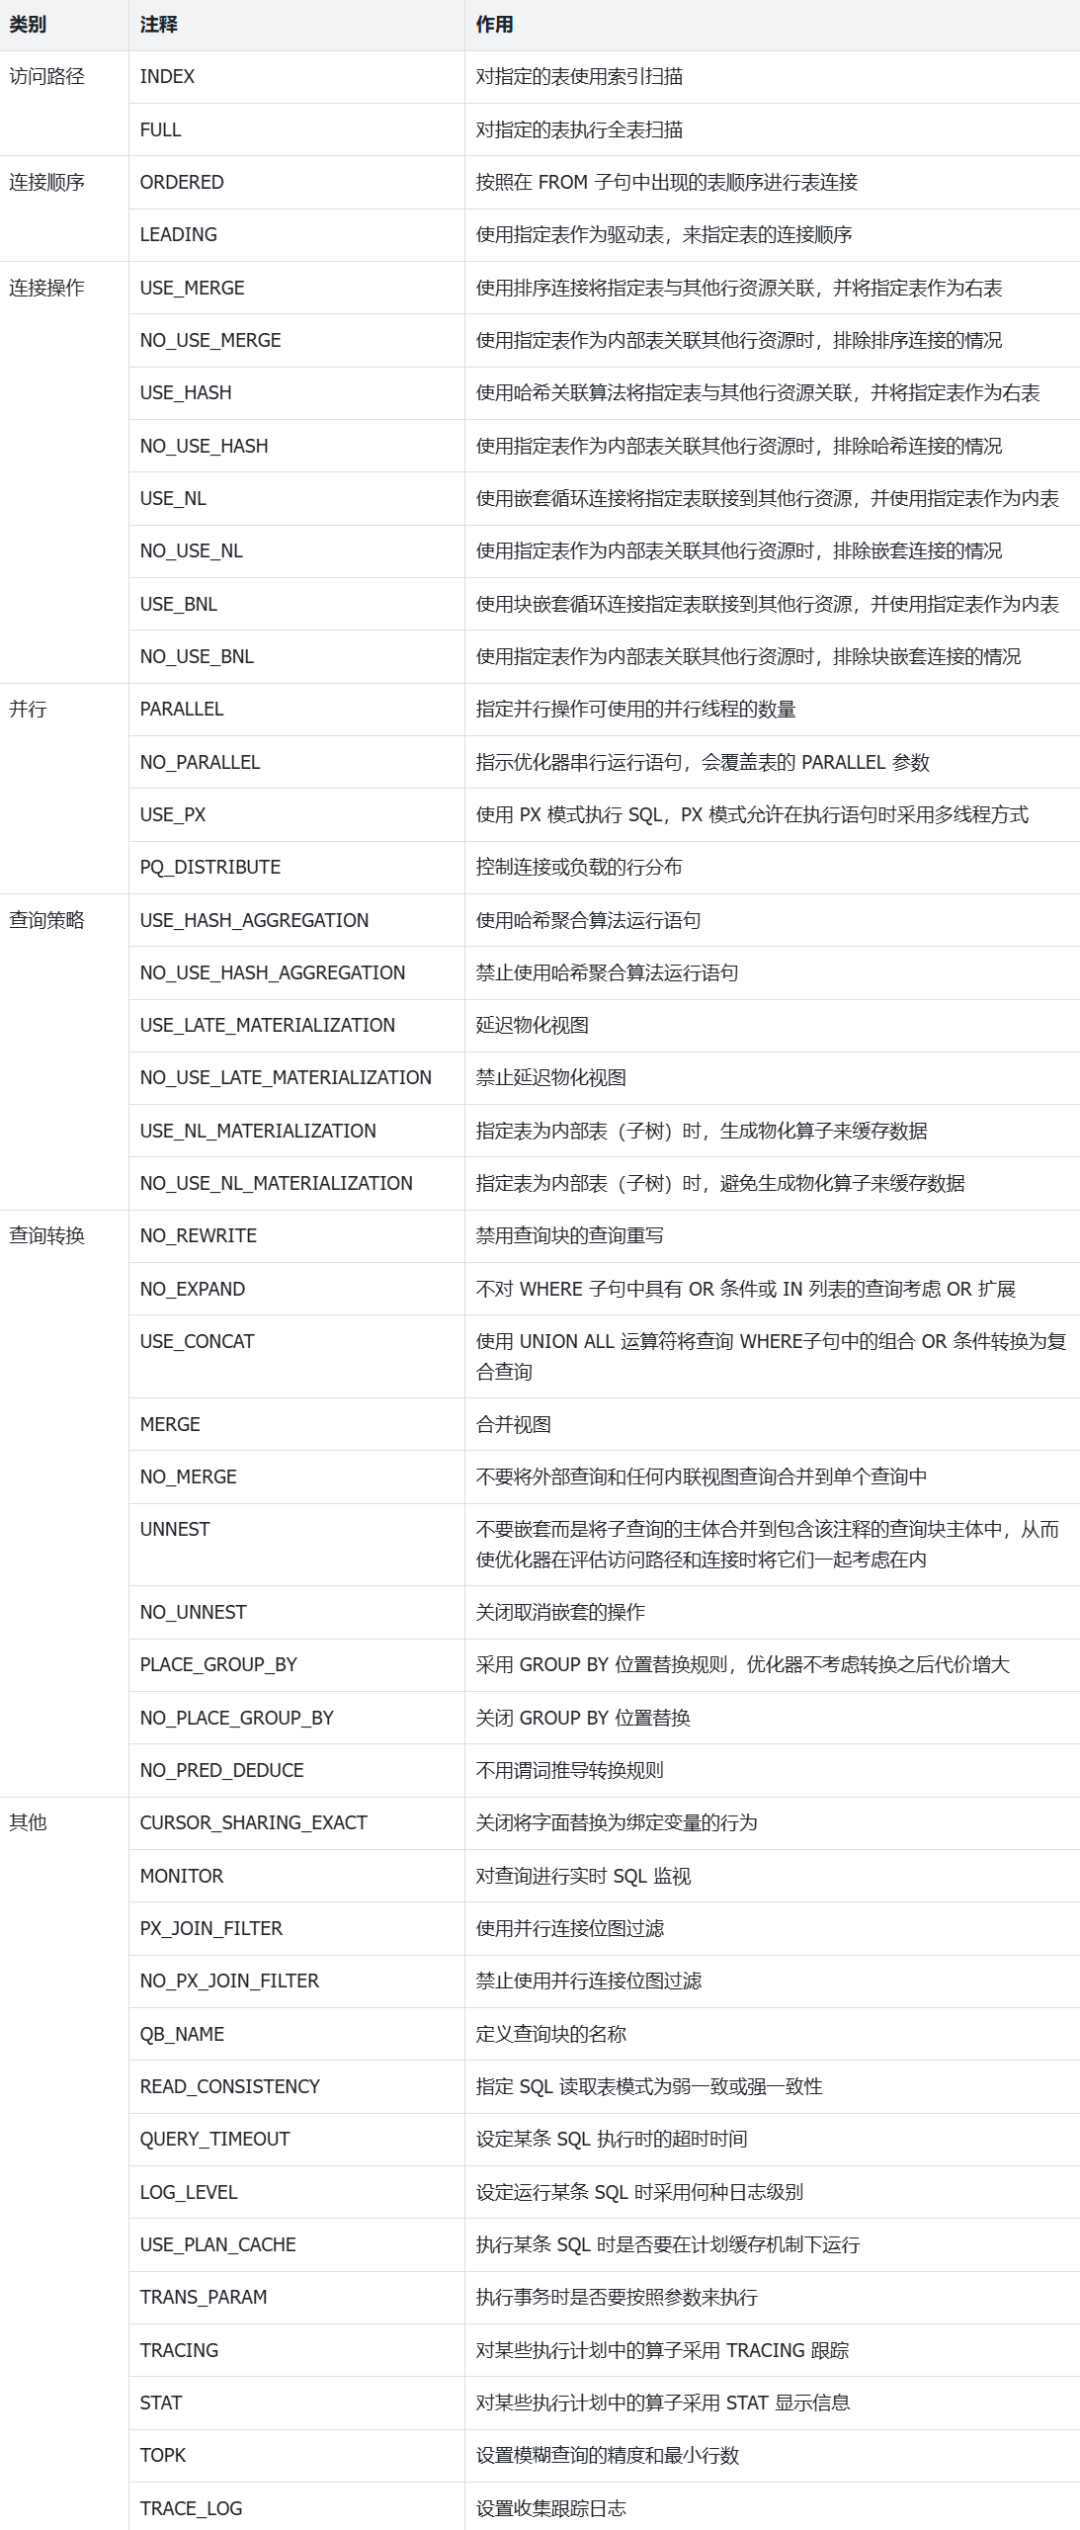
Hint 是一种 SQL 语句注释,用于将指令传递给 OceanBase 数据库优化器。通过 Hint 可以使优化器生成指定的执行计划。一般情况下,优化器会为用户查询选择最佳的执行计划,不需要用户使用 Hint 指定,但在某些场景下,优化器生成的执行计划可能无法满足用户的要求,这时就需要用户使用 Hint 来主动指定并生成特殊的执行计划。Hint 可以说是 DBA 干预执行计划最为常用的手段之一。Hint 的丰富程度直接决定 DBA 能干预执行计划的程度。
-- 测试使用 Hint 干预执行计划
mysql> select * from emp where emp_name='emp1234';
+--------+---------+----------+------------+---------+
|emp_id | dept_id | emp_name | birthday   | salary  |
+--------+---------+----------+------------+---------+
|1234 |      74 | emp1234  | 2001-12-30 | 1148.55 |
+--------+---------+----------+------------+---------+

mysql> select dbms_xplan.display_cursor() from dual;
==============================================================================================================
|ID|OPERATOR        |NAME             |EST.ROWS|EST.TIME(us)|REAL.ROWS|REAL.TIME(us)|IO TIME(us)|CPU TIME(us)|
--------------------------------------------------------------------------------------------------------------
|0 |TABLE RANGE SCAN|emp(idx_emp_name)|1       |7           |1        |0            |0          |190         |
==============================================================================================================

mysql> select *+ full(emp) */ * from emp where emp_name='emp1234';
+--------+---------+----------+------------+---------+
| emp_id | dept_id | emp_name | birthday   | salary  |
+--------+---------+----------+------------+---------+
|   1234 |      74 | emp1234  | 2001-12-30 | 1148.55 |
+--------+---------+----------+------------+---------+

mysql> select dbms_xplan.display_cursor() from dual;
================================================================================================
|ID|OPERATOR       |NAME|EST.ROWS|EST.TIME(us)|REAL.ROWS|REAL.TIME(us)|IO TIME(us)|CPU TIME(us)|
------------------------------------------------------------------------------------------------
|0 |TABLE FULL SCAN|emp |2       |573         |1        |5258         |0          |5032        |
================================================================================================
2).固定执行计划:(Format) Outline
-- 原始执行计划
mysql> select * from emp where emp_name='emp1234';

mysql> select dbms_xplan.display_cursor(0,'all') from dual;
==============================================================================================================
|ID|OPERATOR        |NAME             |EST.ROWS|EST.TIME(us)|REAL.ROWS|REAL.TIME(us)|IO TIME(us)|CPU TIME(us)|
--------------------------------------------------------------------------------------------------------------
|0 |TABLE RANGE SCAN|emp(idx_emp_name)|1       |7           |1        |1169         |0          |118         |
==============================================================================================================

-- 使用 SQL Outline 固定新的执行计划
mysql> select sql_id ,statement from oceanbase.V$OB_PLAN_CACHE_PLAN_STAT
    ->   where statement like '%emp_name%';
+----------------------------------+----------------------------------------+
| sql_id                           | statement                              |
+----------------------------------+----------------------------------------+
| 3A384EC9FBBF76DC073C209C7594BD62 | select * from emp where emp_name=?     |
+----------------------------------+----------------------------------------+

mysql>  CREATE OUTLINE ol_emp_name ON '3A384EC9FBBF76DC073C209C7594BD62'
    ->   USING HINT *+ full(emp) */ ;

mysql> select * from emp where emp_name='emp1234';

-- 查看是否使用 SQL Outline
mysql> select dbms_xplan.display_cursor(0,'all') from dual;
================================================================================================
|ID|OPERATOR       |NAME|EST.ROWS|EST.TIME(us)|REAL.ROWS|REAL.TIME(us)|IO TIME(us)|CPU TIME(us)|
------------------------------------------------------------------------------------------------
|0 |TABLE FULL SCAN|emp |2       |573         |1        |5291         |0          |5153        |
================================================================================================
Used Hint:
-------------------------------------
  /*+
      FULL("emp")
  */
Outline Data:
-------------------------------------
  /*+
      BEGIN_OUTLINE_DATA
      FULL(@"SEL$1" "default_database"."emp"@"SEL$1")
      OPTIMIZER_FEATURES_ENABLE('4.2.5.0')
      END_OUTLINE_DATA
  */
3).固定执行计划:SPM
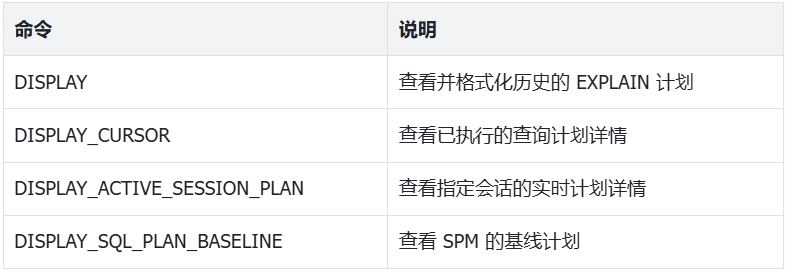
4).查看执行计划:DBMS_XPLAN
mysql> EXPLAIN SET STATEMENT_ID='testsql1' select * from emp where emp_id=100;

mysql> SELECT DBMS_XPLAN.DISPLAY('all','testsql1','plan_table');
=========================================
|ID|OPERATOR |NAME|EST.ROWS|EST.TIME(us)|
-----------------------------------------
|0 |TABLE GET|emp |1       |3           |
=========================================

Outputs & filters:
-------------------------------------
  0 - output([emp.emp_id], [emp.dept_id], [emp.emp_name], [emp.birthday], [emp.salary]), filter(nil), rowset=16
      access([emp.emp_id], [emp.dept_id], [emp.emp_name], [emp.birthday], [emp.salary]), partitions(p0)
      is_index_back=false, is_global_index=false,
      range_key([emp.emp_id]), range[100 ; 100],
      range_cond([emp.emp_id = 100])

Used Hint:
-------------------------------------
  /*+

  */
Qb name trace:
-------------------------------------
  stmt_id:0, stmt_type:T_EXPLAIN
  stmt_id:1, SEL$1

Outline Data:
-------------------------------------
  /*+
      BEGIN_OUTLINE_DATA
      FULL(@"SEL$1" "default_database"."emp"@"SEL$1")
      OPTIMIZER_FEATURES_ENABLE('4.2.5.0')
      END_OUTLINE_DATA
  */
Optimization Info:
-------------------------------------
  emp:
      table_rows:10000
      physical_range_rows:1
      logical_range_rows:1
      index_back_rows:0
      output_rows:1
      table_dop:1
      dop_method:Table DOP
      avaiable_index_name:[idx_emp_name, idx_emp_birthday, idx_emp_salary, emp]
      pruned_index_name:[idx_emp_name, idx_emp_birthday, idx_emp_salary]
      stats info:[version=2024-11-25 14:53:29.120791, is_locked=0, is_expired=0]
      dynamic sampling level:0
      estimation method:[OPTIMIZER STATISTICS]

  Plan Type:
      LOCAL

  Parameters:
      :0 => 100
      :1 => 'testsql1'

  Note:
      Degree of Parallelisim is 1 because of table property
5).清除执行计划:FLUSH PLAN CACHE
当执行计划出现异常时,需要非常精准地清理某一个语句的执行计划缓存。在 OceanBase 中实现了语句级的清理能力。
-- 查看执行计划缓存
mysql> select sql_id ,plan_hash,statement,last_active_time,executions
    ->  from  oceanbase.gv$ob_plan_cache_plan_stat
    ->  where statement like '%emp_name%';
+----------------------------------+--------------------+------------------------------------+----------------------------+------------+
| sql_id                           | plan_hash          | statement                          | last_active_time           | executions |
+----------------------------------+--------------------+------------------------------------+----------------------------+------------+
| 3A384EC9FBBF76DC073C209C7594BD62 | 269335962286044871 | select * from emp where emp_name=? | 2024-11-26 14:28:38.374015 |          5 |
+----------------------------------+--------------------+------------------------------------+----------------------------+------------+

-- 清理执行计划缓存
mysql> ALTER SYSTEM FLUSH PLAN CACHE sql_id='3A384EC9FBBF76DC073C209C7594BD62'
    ->  databases='default_database' GLOBAL;

mysql> select sql_id ,plan_hash,statement,last_active_time,executions
    ->  from  oceanbase.gv$ob_plan_cache_plan_stat
    ->  where statement like '%emp_name%';
Empty set (0.02 sec)

-- 重新生成执行计划
mysql> select * from emp where emp_name='emp1234';
+--------+---------+----------+------------+---------+
| emp_id | dept_id | emp_name | birthday   | salary  |
+--------+---------+----------+------------+---------+
|   1234 |      74 | emp1234  | 2001-12-30 | 1148.55 |
+--------+---------+----------+------------+---------+

mysql> select sql_id ,plan_hash,statement,last_active_time,executions
    ->  from  oceanbase.gv$ob_plan_cache_plan_stat
    ->  where statement like '%emp_name%';
+----------------------------------+--------------------+------------------------------------+----------------------------+------------+
| sql_id                           | plan_hash          | statement                          | last_active_time           | executions |
+----------------------------------+--------------------+------------------------------------+----------------------------+------------+
| 3A384EC9FBBF76DC073C209C7594BD62 | 269335962286044871 | select * from emp where emp_name=? | 2024-11-26 14:32:24.447891 |          1 |
+----------------------------------+--------------------+------------------------------------+----------------------------+------------+
1).ASH
Oracle DBA 对ASH/AWR,一定不陌生。它们是我们查看语句执行过程的好帮手。在 OceanBase 中也带来了同样的能力。ASH(Active Session History)是一种活动会话历史记录的诊断工具,用于记录数据库中所有活动会话的信息。ASH 报告(OceanBase Active Session History Report )是一个能够提供定位瞬时发生异常的分析报告,与性能报告相比,能提供更加细粒度的诊断信息。一般的性能报告所覆盖的是小时级别的快照信息,诊断问题的粒度不能深入到 Session 级别。导致一些瞬时抖动信息很难从性能报告上得到详细的执行细节,因此,我们可以通过 ASH 报告这样一个会话级别的细粒度诊断信息来解决这种问题。
-- 记录一个包含语句执行的时间段
mysql> select now() from dual;
+---------------------+
| now()               |
+---------------------+
| 2024-11-25 21:50:44 |
+---------------------+

-- 对于执行时长短的SQL可能会记录不到,这里构造一个长SQL
mysql> select * from emp where emp_name='emp1234' and salary>sleep(3);

mysql> select now() from dual;
+---------------------+
| now()               |
+---------------------+
| 2024-11-25 21:51:42 |
+---------------------+

-- 查看 SQL ID
mysql> select sql_id ,statement from oceanbase.V$OB_PLAN_CACHE_PLAN_STAT
    ->  where statement like '%salary%';
+----------------------------------+--------------------------------------------------------+
| sql_id                           | statement                                              |
+----------------------------------+--------------------------------------------------------+
| 3F5322F4E8E89841727D0313B5FBB7F9 | select * from emp where emp_name=? and salary>sleep(?) |
+----------------------------------+--------------------------------------------------------+

-- 生成 ASH Report(指定时间段及SQL ID)
mysql> call dbms_workload_repository.ash_report(
    ->   str_to_date('2024-11-25 21:50:00', '%Y-%m-%d %H:%i%s'),
    ->   str_to_date('2024-11-25 21:52:00', '%Y-%m-%d %H:%i%s'),
    ->   sql_id=>'3F5322F4E8E89841727D0313B5FBB7F9');

ASH Report

           Cluster Name: ob69oehg4nx4hs
       Observer Version: OceanBase 4.2.5.0 (100010012024111110-19dd26fbb0ea8dc8a31ba208a90d58f9b67a4929)
  Operation System Info: Linux(3.10.0-1160.119.1.el7.x86_64)_x86_64
  User Input Begin Time: 2024-11-25 21:50:00
    User Input End Time: 2024-11-25 21:52:00
    Analysis Begin Time: 2024-11-25 21:51:05
      Analysis End Time: 2024-11-25 21:51:15
           Elapsed Time: 10
          Num of Sample: 8
Average Active Sessions: 0.80

Top Active Tenants:
+---------------+------------+------------------+-----------------------+-------------------+--------------------+-----------+--------------------+
|    Tenant Name|Session Type|       Total Count|       Wait Event Count|       On CPU Count| Avg Active Sessions| % Activity|Equivalent Client Load|
+---------------+------------+------------------+-----------------------+-------------------+--------------------+-----------+--------------------+
|  t69qw2ook3c2o|  FOREGROUND|                 8|                      8|                  0|                0.80|    100.00%|                1.00|
+---------------+------------+------------------+-----------------------+-------------------+--------------------+-----------+--------------------+

Top Node Load:
+----------------+-------+------------+------------------+-----------------------+-------------------+--------------------+-----------+--------------------+
|              IP|   Port|Session Type|       Total Count|       Wait Event Count|       On CPU Count| Avg Active Sessions| % Activity|Equivalent Client Load|
+----------------+-------+------------+------------------+-----------------------+-------------------+--------------------+-----------+--------------------+
|    10.104.56.87|   2882|  FOREGROUND|                 8|                      8|                  0|                0.80|    100.00%|                0.00|
+----------------+-------+------------+------------------+-----------------------+-------------------+--------------------+-----------+--------------------+

Top Groups:
  - this section lists top resource consumer groups
  - Group Name: resource consumer group name
  - Group Samples: num of sampled session activity records in the current resource group
  - % Activity: activity percentage for given resource group
  - Avg Active Sessions: average active sessions during ash report analysis time period
+-----------------------------------+-------------+-----------+--------------------+----------------------------------------------------------------+-----------+--------------------------------+-----------+--------------------------------+-----------+
|                         Group Name|Group Samples| % Activity| Avg Active Sessions|                                                         Program|  % Program|                          Module|   % Module|                          Action|   % Action|
+-----------------------------------+-------------+-----------+--------------------+----------------------------------------------------------------+-----------+--------------------------------+-----------+--------------------------------+-----------+
|  cgroup//tenant_1002//OBCG_DEFAULT|            8|    100.00%|                0.80|                                                   T1002_SQL_CMD|    100.00%|                       UNDEFINED|    100.00%|                       UNDEFINED|    100.00%|
+-----------------------------------+-------------+-----------+--------------------+----------------------------------------------------------------+-----------+--------------------------------+-----------+--------------------------------+-----------+

Top Foreground DB Time:
  - this section lists top foreground db time categorized by event
  - Event Name: comprise wait event and on cpu event
  - Event Count: num of sampled session activity records
  - % Activity: activity percentage for given event
  - Avg Active Sessions: average active sessions during ash report analysis time period
+-------------+--------------------+-------------+--------------------+-----------+
|   Event Name|          Wait Class|  Event Count| Avg Active Sessions| % Activity|
+-------------+--------------------+-------------+--------------------+-----------+
|   sleep wait|                IDLE|            8|                0.80|    100.00%|
+-------------+--------------------+-------------+--------------------+-----------+

Top Sessions:
  - this section lists top Active Sessions with the largest wait event and SQL_ID
  - Session ID: user session id
  - % Activity: represents the load on the database caused by this session
  - Avg Active Sessions: average active sessions during ash report analysis time period
  - Event Name: comprise wait event and on cpu event
  - % Event: represents the activity load of the event on the database
  - % SQL ID: represents the activity load of the event on the database
  - Sql Executions: represents the execution count of the SQL_ID
+--------------------+----------------+-----------+--------------------+----------------------------------------------------------------+--------------------+-----------+----------------------------------------+--------------------+-----------+-------------+
|          Session ID|         Program| % Activity| Avg Active Sessions|                                                      Event Name|          Wait Class|    % Event|                                  SQL ID|           Plan Hash|   % SQL ID|Sql Executions|
+--------------------+----------------+-----------+--------------------+----------------------------------------------------------------+--------------------+-----------+----------------------------------------+--------------------+-----------+-------------+
|          3221643314|   T1002_SQL_CMD|    100.00%|                0.80|                                                      sleep wait|                IDLE|    100.00%|        3F5322F4E8E89841727D0313B5FBB7F9|14249117491818627721|    100.00%|            3|
+--------------------+----------------+-----------+--------------------+----------------------------------------------------------------+--------------------+-----------+----------------------------------------+--------------------+-----------+-------------+

Activity Over Time:
  - this section lists time slot information during the analysis period.
  - Slot Begin Time: current slot's begin time. current slot end with next slot begin time.
  - Event Name: comprise wait event and on cpu event
  - Event Count: num of sampled session activity records
  - % Activity: activity percentage for given event
  - Avg Active Sessions: average active sessions during ash report analysis time period
+----------------------------+-------------+--------------------+-------------+-----------+--------------------+
|             Slot Begin Time|   Event Name|          Wait Class|  Event Count| % Activity| Avg Active Sessions|
+----------------------------+-------------+--------------------+-------------+-----------+--------------------+
|  2024-11-25 21:50:00.000000|   sleep wait|                IDLE|            8|    100.00%|                0.03|
+----------------------------+-------------+--------------------+-------------+-----------+--------------------+

Top Execution Phase:
  - this section lists top phases of execution, such as SQL, PL/SQL, STORAGE, etc.
+------------+----------------------+----------+-----------+----------------------------------------+-----------+
|Session Type|    Phase of Execution|Active Samples| % Activity|                                  SQL_ID|   % SQL_ID|
+------------+----------------------+----------+-----------+----------------------------------------+-----------+
|  FOREGROUND|      IN_SQL_EXECUTION|         8|    100.00%|        3F5322F4E8E89841727D0313B5FBB7F9|    100.00%|
|  FOREGROUND|    IN_PLSQL_EXECUTION|         8|    100.00%|        3F5322F4E8E89841727D0313B5FBB7F9|    100.00%|
|  FOREGROUND|       IN_STORAGE_READ|         8|    100.00%|        3F5322F4E8E89841727D0313B5FBB7F9|    100.00%|
+------------+----------------------+----------+-----------+----------------------------------------+-----------+

Top SQL with Top Events:
  - This Section lists the SQL statements that accounted for the highest percentages event.
  - Plan Hash: Numeric representation of the current SQL plan
  - Active Samples: num of samples for top current SQL
  - % Activity: activity percentage for given SQL ID
  - Sampled Executions: represents the number of times the current SQL execution has been sampled
  - Top Event: top event name for current SQL plan
  - % Event: activity percentage for current SQL plan
  - Top Operator/ExecPhase: top operator name or execution phase for current event
  - % Operator/ExecPhase: activity percentage for given operator
+----------------------------------------+--------------------+--------------+--------------+--------------+----------------------------------------------------------------+--------------+--------------------------------------------------------------------------------------------------------------------------------+--------------+----------------------------------------------------------------+
|                                  SQL ID|           Plan Hash|Active Samples|    % Activity|Sampled Executions|                                                       Top Event|       % Event|                                                                                                          Top Operator/ExecPhase|% Operator/ExecPhase|                                                        SQL Text|
+----------------------------------------+--------------------+--------------+--------------+--------------+----------------------------------------------------------------+--------------+--------------------------------------------------------------------------------------------------------------------------------+--------------+----------------------------------------------------------------+
|        3F5322F4E8E89841727D0313B5FBB7F9|14249117491818627721|             8|       100.00%|             3|                                                      sleep wait|       100.00%|                                                                                                                TABLE RANGE SCAN|       100.00%|          select * from emp where emp_name=? and salary>sleep(?)|
+----------------------------------------+--------------------+--------------+--------------+--------------+----------------------------------------------------------------+--------------+--------------------------------------------------------------------------------------------------------------------------------+--------------+----------------------------------------------------------------+

Top SQL with Top Operator:
  - This Section lists the SQL statements that accounted for the highest percentages of sampled session activity with sql operator
  - Plan Hash: Numeric representation of the current SQL plan
  - Active Samples: num of samples for top current SQL
  - % Activity: activity percentage for given SQL ID
  - Sampled Executions: represents the number of times the current SQL execution has been sampled
  - Top Operator: top operator name for current SQL plan
  - % Operator: activity percentage for given operator
  - Top Event: top event name for current operator
  - % Event: activity percentage for given event
+----------------------------------------+--------------------+--------------+--------------+--------------+--------------------------------------------------------------------------------------------------------------------------------+--------------+----------------------------------------------------------------+--------------+----------------------------------------------------------------+
|                                  SQL ID|           Plan Hash|Active Samples|    % Activity|Sampled Executions|                                                                                                                    Top Operator|    % Operator|                                                       Top Event|       % Event|                                                        SQL Text|
+----------------------------------------+--------------------+--------------+--------------+--------------+--------------------------------------------------------------------------------------------------------------------------------+--------------+----------------------------------------------------------------+--------------+----------------------------------------------------------------+
|        3F5322F4E8E89841727D0313B5FBB7F9|14249117491818627721|             8|       100.00%|             3|                                                                                                                TABLE RANGE SCAN|       100.00%|                                                      sleep wait|       100.00%|          select * from emp where emp_name=? and salary>sleep(?)|
+----------------------------------------+--------------------+--------------+--------------+--------------+--------------------------------------------------------------------------------------------------------------------------------+--------------+----------------------------------------------------------------+--------------+----------------------------------------------------------------+

Complete List of SQL Text:
  SQL ID: 3F5322F4E8E89841727D0313B5FBB7F9
SQL Text: select * from emp where emp_name=? and salary>sleep(?)
2).SQL Stat
mysql> select snap_id,plan_type,executions_total,source_ip,source_port
   ->  from oceanbase.DBA_WR_SQLSTAT
    ->  where sql_id='3A384EC9FBBF76DC073C209C7594BD62';
+---------+-----------+------------------+--------------+-------------+
| snap_id | plan_type | executions_total | source_ip    | source_port |
+---------+-----------+------------------+--------------+-------------+
|      22 |         1 |                1 | 10.104.56.87 |        2882 |
+---------+-----------+------------------+--------------+-------------+
3).SQL Audit
-- 开启会话级别的全链路追踪(记录所有语句的相关耗时等信息,采样频率为 50%
obclient> CALL DBMS_MONITOR.OB_SESSION_TRACE_ENABLE(null,1,0.5,'ALL');

mysql> SELECT request_id,usec_to_time(request_time),user_client_ip,user_name,db_name,
    ->  sql_id,query_sql ,ELAPSED_TIME,QUEUE_TIME,EXECUTE_TIME,plan_id,is_hit_plan,disk_reads
    ->  FROM oceanbase.gv$OB_SQL_AUDIT
    ->  WHERE query_sql LIKE '%emp_name%' limit 1\G;
*************************** 1. row ***************************
                request_id: 1669216
usec_to_time(request_time): 2024-11-26 14:54:24.977470
            user_client_ip: 82.157.26.195
                 user_name: testuser
                   db_name: default_database
                    sql_id: 5650F89701DF0872BA2FCBD059EDBFC9
                 query_sql: select * from emp where emp_name ='emp1234'
              ELAPSED_TIME: 13803
                QUEUE_TIME: 18
              EXECUTE_TIME: 271
                   plan_id: 4878
               is_hit_plan: 0
                DISK_READS: 2
4).SQL Trace
SQL Trace 能够交互式的提供上一次执行的 SQL 请求执行过程中调用链路情况,以及链路中各阶段耗时情况,以便进行性能分析或调优,快速找到性能瓶颈点。
mysql> SET ob_enable_show_trace = 1;

mysql> select * from emp where emp_name ='emp1234';
+--------+---------+----------+------------+---------+
| emp_id | dept_id | emp_name | birthday   | salary  |
+--------+---------+----------+------------+---------+
|   1234 |      74 | emp1234  | 2001-12-30 | 1148.55 |
+--------+---------+----------+------------+---------+

mysql> show trace;
+-------------------------------------------+----------------------------+------------+
| Operation                                 | StartTime                  | ElapseTime |
+-------------------------------------------+----------------------------+------------+
| com_query_process                         | 2024-11-26 14:57:02.179570 | 0.344 ms   |
| └── mpquery_single_stmt                   | 2024-11-26 14:57:02.179576 | 0.327 ms   |
|     ├── sql_compile                       | 2024-11-26 14:57:02.179584 | 0.074 ms   |
|     │   └── pc_get_plan                   | 2024-11-26 14:57:02.179590 | 0.014 ms   |
|     └── sql_execute                       | 2024-11-26 14:57:02.179673 | 0.208 ms   |
|         ├── open                          | 2024-11-26 14:57:02.179674 | 0.020 ms   |
|         ├── response_result               | 2024-11-26 14:57:02.179706 | 0.122 ms   |
|         │   └── do_local_das_task         | 2024-11-26 14:57:02.179730 | 0.031 ms   |
|         └── close                         | 2024-11-26 14:57:02.179838 | 0.031 ms   |
|             ├── close_das_task            | 2024-11-26 14:57:02.179839 | 0.009 ms   |
|             └── end_transaction           | 2024-11-26 14:57:02.179857 | 0.002 ms   |
+-------------------------------------------+----------------------------+------------+
1).调整对象:Invisible Index
mysql> explain select * from emp where emp_name ='emp1234';
=============================================================
|ID|OPERATOR        |NAME             |EST.ROWS|EST.TIME(us)|
-------------------------------------------------------------
|0 |TABLE RANGE SCAN|emp(idx_emp_name)|1       |7           |
=============================================================

-- 修改索引可见性
mysql> alter table emp alter index idx_emp_name invisible;

mysql> explain select * from emp where emp_name ='emp1234';
===============================================
ID|OPERATOR       |NAME|EST.ROWS|EST.TIME(us)|
-----------------------------------------------
|0 |TABLE FULL SCAN|emp |2       |573         |
===============================================
2).统计信息
完整、准确的统计信息,是优化器工作的前提。作为DBA日常优化的工作,统计信息是首要需要关注的。OceanBase 提供了多种统计信息的收集及查看手段。在测试中,发现一点小瑕疵,通过 Analyze 和 DBMS_STATS包的方式收集统计信息,能力上还不统一。期待未来统一起来。
-- Analyze 方式收集(未收集索引信息)
mysql> analyze table emp;

mysql> select table_name,object_type, num_rows,blocks,last_analyzed
    ->  from oceanbase.dba_tab_statistics where table_name='emp';
+------------+-------------+----------+--------+----------------------------+
| table_name | object_type | num_rows | blocks | last_analyzed              |
+------------+-------------+----------+--------+----------------------------+
| emp        | TABLE       |    10000 |   NULL | 2024-11-25 21:39:58.833398 |
+------------+-------------+----------+--------+----------------------------+

mysql> select table_name,index_name,object_type,blevel,distinct_keys,last_analyzed
    ->  from oceanbase. DBA_IND_STATISTICS where index_name='idx_emp_name';
+------------+--------------+-------------+--------+---------------+----------------------------+
| table_name | index_name   | object_type | blevel | distinct_keys | last_analyzed              |
+------------+--------------+-------------+--------+---------------+----------------------------+
| emp        | idx_emp_name | INDEX       |   NULL |          NULL | 2024-11-25 14:53:29.154282 |
+------------+--------------+-------------+--------+---------------+----------------------------+

-- DBMS_STATS 包方式收集
mysql> CALL DBMS_STATS.GATHER_TABLE_STATS ('testuser', 'emp', method_opt=>'FOR ALL COLUMNS SIZE AUTO', granularity=>'ALL', degree=>4,cascade=>true);

mysql> select table_name,object_type, num_rows,blocks,last_analyzed
    ->  from oceanbase.dba_tab_statistics where table_name='emp';
+------------+-------------+----------+--------+----------------------------+
| table_name | object_type | num_rows | blocks | last_analyzed              |
+------------+-------------+----------+--------+----------------------------+
| emp        | TABLE       |    10000 |   NULL | 2024-11-26 14:37:24.010639 |
+------------+-------------+----------+--------+----------------------------+

mysql> select table_name,index_name,object_type,blevel,distinct_keys,last_analyzed
    ->  from oceanbase. DBA_IND_STATISTICS where index_name='idx_emp_name';
+------------+--------------+-------------+--------+---------------+----------------------------+
| table_name | index_name   | object_type | blevel | distinct_keys | last_analyzed              |
+------------+--------------+-------------+--------+---------------+----------------------------+
| emp        | idx_emp_name | INDEX       |   NULL |          NULL | 2024-11-26 14:37:24.061085 |
+------------+--------------+-------------+--------+---------------+----------------------------+

写在最后
国产数据库发展时间尚短、缺乏场景打磨,存在诸多不足也可理解。但比较欣喜的是,整个国产数据库厂商都在努力追赶。近年已经多次受邀参加厂商的产品、用户、生态大会,大家都希望更多听听来自外部的声音。如此次也是OB官方联系笔者听取建议,并在新版本发布后第一时间联系笔者进行评测。
从此次的评测来看,OceanBase在SQL 管理方面取得了长足的进步,达到比较完善的程度,可满足日常SQL管理工作。在使用体验上大量仿照了Oracle的做法,上手门槛很低。当然仍存在一些不足,如文档偏重技术说明、缺少实操过程;不同兼容模式下产品能力尚未对齐等;但相信未来会越来越完善。
