Greptime 编辑寄语
这篇文章详细介绍了如何使用 Grafana Alloy 将 AWS CloudWatch 的数据发送到 GreptimeCloud,为正在探索跨平台数据集成与可视化方案的开发者和运维人员提供了一种灵活高效的时间序列数据管理方案。
感谢我们用户 jetdeng 的应用经验和文字成稿,欢迎有经验、有想法的用户踊跃投稿!
引言
CloudWach 是 AWS 上进行监控的一个服务,该服务可以对云平台的指标、日志、链路追踪进行存储和查询。如果你想把监控数据自行保存或进行分析,可以通过 CloudWatch API 将其导出并存储。例如,Datadog[1],Sysdig[2] 对于 AWS 监控有采用类似的方案。
目前主流的监控平台是 Prometheus ,其易用性收到广泛的应用。但是由于其存在 HA 和高基数的问题,而主流的HA方案 Thanos 集群又提升了维护复杂度。近年来,GreptimeDB 作为个新的时序数据库,其原生支持高可用,并且兼容 Prometheus 协议。
本文将专注于 AWS CloudWatch 的指标,通过 Grafana Alloy 将 AWS CloudWatch 的数据抓取和转化为 Prometheus 格式,将其写入到 GreptimeCloud,并通过 GreptimeCloud 的 Console 进行可视化查询。
核心工具简介
AWS CloudWatch:用于收集和监控 AWS 服务指标 Grafana Alloy:专注于数据抓取、转换与传输的工具 GreptimeCloud:高效的时序数据存储与分析平台
操作步骤
1. 在 AWS 上创建 IAM 用户并绑定 Alloy 所需 Policy
{
  "Version": "2012-10-17",
  "Statement": [
    {
      "Sid": "Stmt1674249227793",
      "Action": [
        "tag:GetResources",
        "cloudwatch:GetMetricData",
        "cloudwatch:GetMetricStatistics",
        "cloudwatch:ListMetrics",
        "ec2:DescribeTags",
        "ec2:DescribeInstances",
        "ec2:DescribeRegions",
        "iam:ListAccountAliases",
        "ec2:DescribeTransitGateway*",
        "apigateway:GET",
        "dms:DescribeReplicationInstances",
        "dms:DescribeReplicationTasks"
      ],
      "Effect": "Allow",
      "Resource": "*"
    }
  ]
}
把该 Policy 绑从对应的 AWS IAM User 上,并将该用户的 Credential 保存到部署 Grafana Alloy 实例中的 ~/.aws/crendetails 文件中
配置 Grafana Alloy
根据官方安装文档 [3] 下载并安装到运行 Alloy 的实例中,在与 Alloy 同一目录下新建一个 config.alloy 文件,该文件将会有以下内容:
prometheus.exporter.cloudwatch "aws_ec2_metrics" {
    ......
}
prometheus.scrape "awsmonitoring" {
    ......
}
prometheus.remote_write "greptimedb" {
    ......
}
2.1 「prometheus.exporter.cloudwatch」, 配置从 CloudWatch 拉取指标
prometheus.exporter.cloudwatch "aws_ec2_metrics" {
sts_region = "ap-east-1"
    discovery {
        type    = "AWS/EC2"
        regions = ["ap-east-1"]
        metric {
            name       = "CPUUtilization"
            statistics = ["Average"]
            period     = "5m"
        }
        metric {
            name       = "NetworkPacketsIn"
            statistics = ["Average"]
            period     = "5m"
        }
    }
}
该文件配置了从 ap-east-1 区域拉取 EC2 的两个指标:
CPUUtilization,统计方式采用均值,统计周期 5 分钟 NetworkPacketsIn,统计方式采用均值,统计周期 5 分钟
2.2「prometheus.scrape “awsmonitoring”」, 配置抓取目标和写入对象
prometheus.scrape "awsmonitoring" {
targets = prometheus.exporter.cloudwatch.aws_ec2_metrics.targets
forward_to = [prometheus.remote_write.greptimedb.receiver]
}
2.3 「prometheus.remote_write “greptimedb”」,配置写入的目标
请登录 GreptimeCloud[4] 的控制台,创建或选择对应的服务,在 Connect 中选择 Alloy,将配置内容复制到 config.alloy 中。
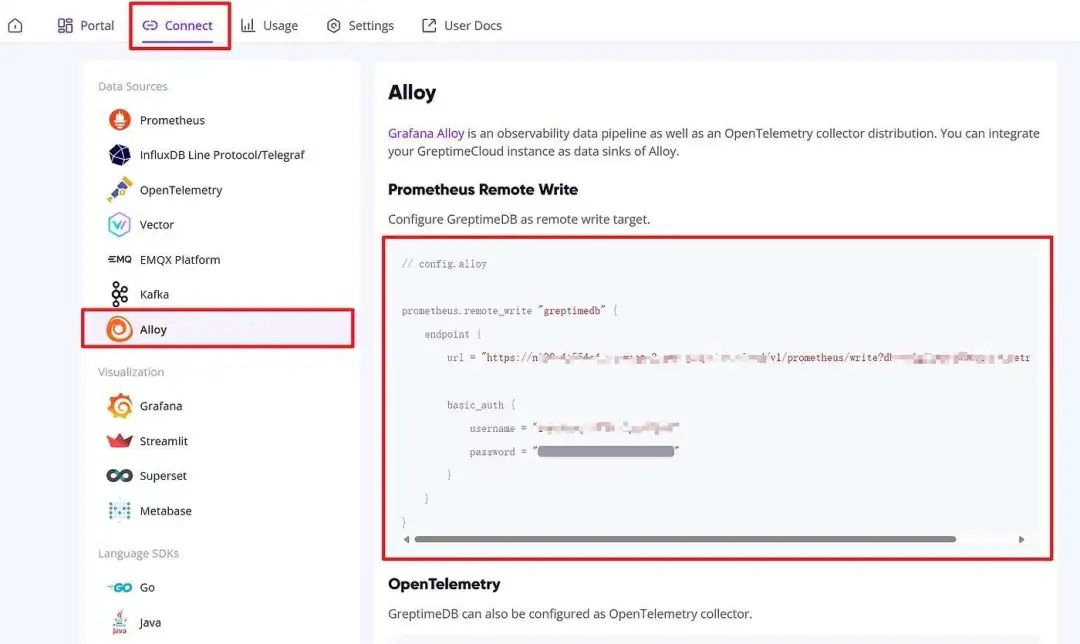
写入到 Alloy 对应 prometheus.remote_write 部分
prometheus.remote_write "greptimedb" {
    endpoint {
        url = "https://**************.us-west-2.aws.greptime.cloud/v1/prometheus/write?db=**************"

        basic_auth {
            username = "************************"
            password = "************************"
        }
    }
}
2.4 一切准备就绪后,运行命令启动 Alloy
alloy run config.alloy
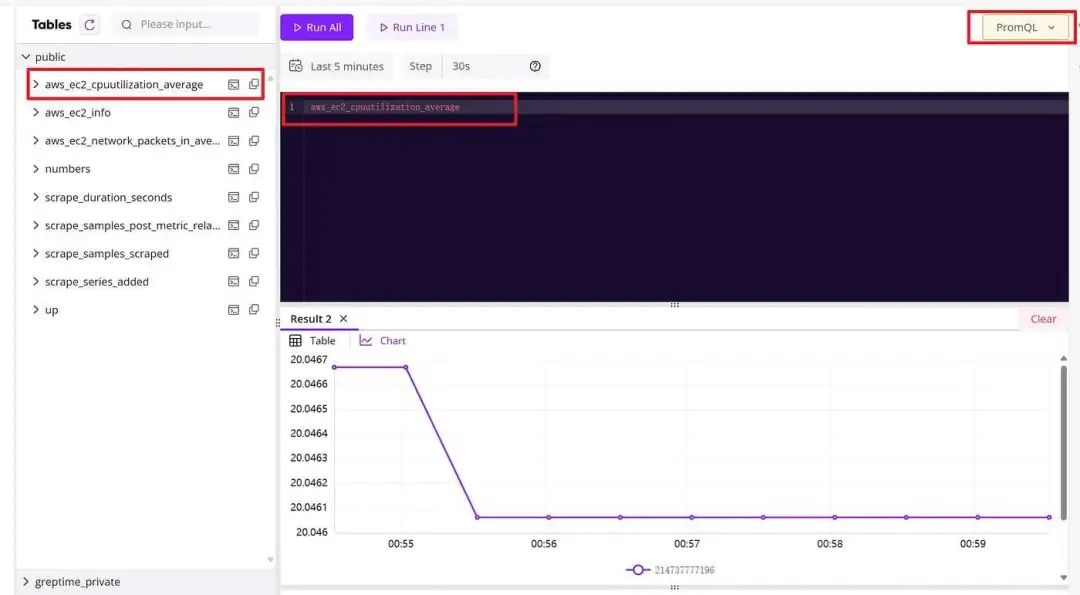
登录 GreptimeCloud ,进入对应服务的 Web Console 进行查看是否上传成功,如果出现以下的内容说明成功拉取并上传到 GreptimeCloud。
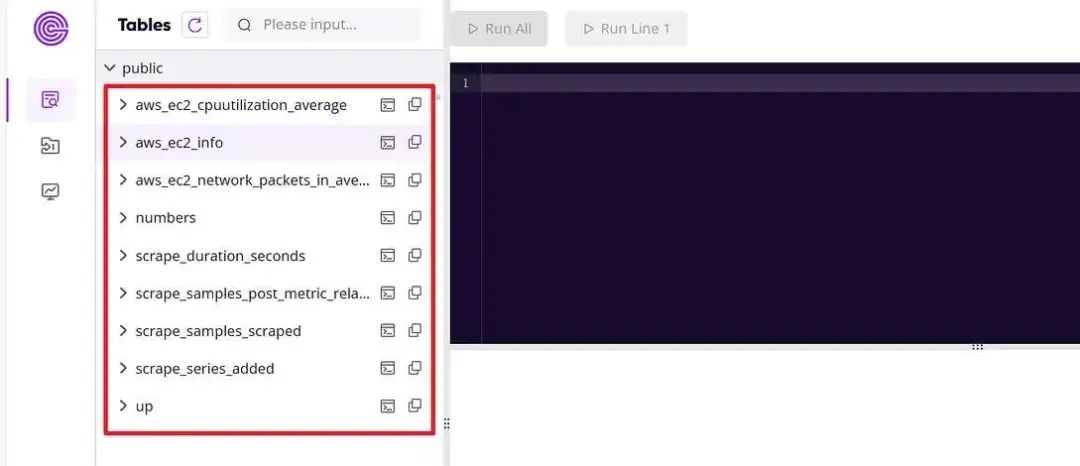
你可以使用 PromQL 在 Greptime 查询数据
同时,可以将数据接入到 Grafana 等可视化平台进行查询。或者是在 GreptimeCloud Console 上使用 Workbench 进行可视化,效果如下:
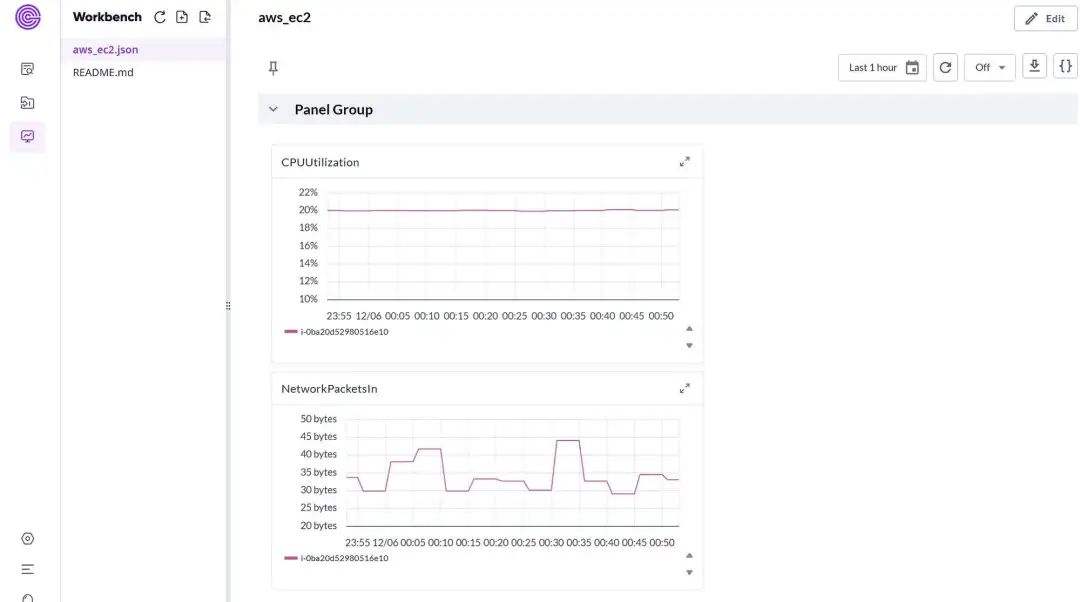
以 Greptime Console 可视化为例,在 Workbench 中新建一个aws_ec2.json 文件,并使用以下 JSON 文件作为配置,即可实现上述可视化效果。
{
  "kind": "Dashboard",
  "metadata": {
    "name": "aws_ec2",
    "project": "default",
    "version": 0
  },
  "spec": {
    "display": {
      "name": "aws_ec2"
    },
    "panels": {
      "CPUUtilization": {
        "kind": "Panel",
        "spec": {
          "display": {
            "name": "CPUUtilization"
          },
          "plugin": {
            "kind": "TimeSeriesChart",
            "spec": {
              "yAxis": {
                "show": true,
                "label": "",
                "format": {
                  "unit": "percent"
                }
              },
              "legend": {
                "position": "bottom"
              }
            }
          },
          "queries": [
            {
              "kind": "TimeSeriesQuery",
              "spec": {
                "plugin": {
                  "kind": "PrometheusTimeSeriesQuery",
                  "spec": {
                    "query": "aws_ec2_cpuutilization_average",
                    "seriesNameFormat": "{{ dimension_InstanceId}}"
                  }
                }
              }
            }
          ]
        }
      },
      "CPUUtilization-1": {
        "kind": "Panel",
        "spec": {
          "display": {
            "name": "NetworkPacketsIn"
          },
          "plugin": {
            "kind": "TimeSeriesChart",
            "spec": {
              "yAxis": {
                "show": true,
                "label": "",
                "format": {
                  "unit": "bytes"
                }
              },
              "legend": {
                "position": "bottom"
              }
            }
          },
          "queries": [
            {
              "kind": "TimeSeriesQuery",
              "spec": {
                "plugin": {
                  "kind": "PrometheusTimeSeriesQuery",
                  "spec": {
                    "query": "aws_ec2_network_packets_in_average",
                    "seriesNameFormat": "{{ dimension_InstanceId}}"
                  }
                }
              }
            }
          ]
        }
      }
    },
    "layouts": [
      {
        "kind": "Grid",
        "spec": {
          "display": {
            "title": "Panel Group",
            "collapse": {
              "open": true
            }
          },
          "items": [
            {
              "x": 0,
              "y": 0,
              "width": 13,
              "height": 7,
              "content": {
                "$ref": "#/spec/panels/CPUUtilization"
              }
            },
            {
              "x": 0,
              "y": 7,
              "width": 13,
              "height": 7,
              "content": {
                "$ref": "#/spec/panels/CPUUtilization-1"
              }
            }
          ]
        }
      }
    ],
    "variables": [],
    "duration": "1h",
    "refreshInterval": "0s"
  }
}
总结
我们基于 GreptimeCloud 和 Grafana Alloy 从 AWS CloudWatch 将指标拉取、转换、存储和可视化。该方案操作简单,维护容易。借助 GreptimeDB 强大的功能,我们甚至可以基于其构建强大的监控平台,对于云监控运维的业务场景有着很大的价值。
Reference
❝关于 Greptime
Greptime 格睿科技专注于为可观测、物联网及车联网等领域提供实时、高效的数据存储和分析服务,帮助客户挖掘数据的深层价值。目前基于云原生的时序数据库 GreptimeDB 已经衍生出多款适合不同用户的解决方案,更多信息或 demo 展示请联系下方小助手(微信号:greptime)。
欢迎对开源感兴趣的朋友们参与贡献和讨论,从带有 good first issue 标签的 issue 开始你的开源之旅吧~期待在开源社群里遇见你!添加小助手微信即可加入“技术交流群”与志同道合的朋友们面对面交流哦~
Star us on GitHub Now: https://github.com/GreptimeTeam/greptimedb
官网:https://greptime.cn/
文档:https://docs.greptime.cn/
Twitter: https://twitter.com/Greptime
Slack: https://greptime.com/slack
LinkedIn: https://www.linkedin.com/company/greptime/往期精彩文章:
点击「阅读原文」,立即体验 GreptimeDB!