


点击上方蓝字”运维笔谈”,对话回复 “阿里云k8s” 可以获取《阿里云Kubernetes项目实战手册》PDF。

Top-like interface for container metrics
Linux里查看应用的资源使用情况,我们可能会比较习惯喜欢使用top这个工具,如我们可以使用top快速查看某个进程的cpu和内存的使用情况。那么在容器环境下是否也有类似的一款工具呢?有的。
ctop :Top-like interface for container metrics.
Github地址:https://github.com/bcicen/ctop
ctop可以像top一样提供单台主机下所有容器的指标信息或者单独一个容器的指标信息。
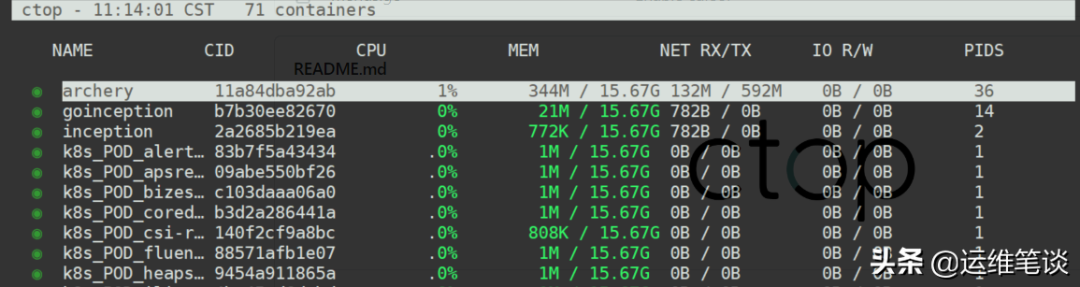
一、安装
Linux平台:
sudo wget https://github.com/bcicen/ctop/releases/download/v0.7.3/ctop-0.7.3-linux-amd64 -O usr/local/bin/ctopsudo chmod +x usr/local/bin/ctop
或者docker直接运行:
docker run --rm -ti \--name=ctop \--volume var/run/docker.sock:/var/run/docker.sock:ro \quay.io/vektorlab/ctop:latest
二、使用
我们先查看下ctop有哪些参数
ctop -hctop - interactive container viewerusage: ctop [options]options:-a show active containers only #只查当前活动的容器-connector stringcontainer connector to use (default "docker")-f string # 搜索容器,比如包含kafka前缀的容器名filter containers-h display this help dialog # 帮助信息-i invert default colors # 翻转当前终端颜色-r reverse container sort order # 排序,可以选择cpu,内存,状态等信息-s stringselect container sort field # 反排序-scale-cpushow cpu as % of system total # cpu百分比-shell stringdefault shell-v output version information and exit
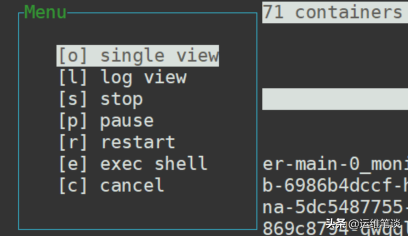
和使用top一样,我们可能会更喜欢在命令打开的情况下使用快捷键进行操作,ctop也提供了对应的按键设置。
Key Action<enter> #Open container menua #Toggle display of all (running and non-running) containersf #Filter displayed containers (esc to clear when open)H #Toggle ctop headerh #Open help dialogs #Select container sort fieldr #Reverse container sort ordero #Open single viewl #View container logs (t to toggle timestamp when open)e #Exec ShellS #Save current configuration to fileq #Quit ctop
这里我选择几个常用的截图示例让大家看看效果如何。
回车键——显示容器的菜单,具体如下图
o 是查看单独的一个容器信息
l 是查看容器的日志
s 是关闭容器
p 暂停该容器
r 重启该容器
e 是进行容器内部,默认是sh模式
 1、f 搜索容器名
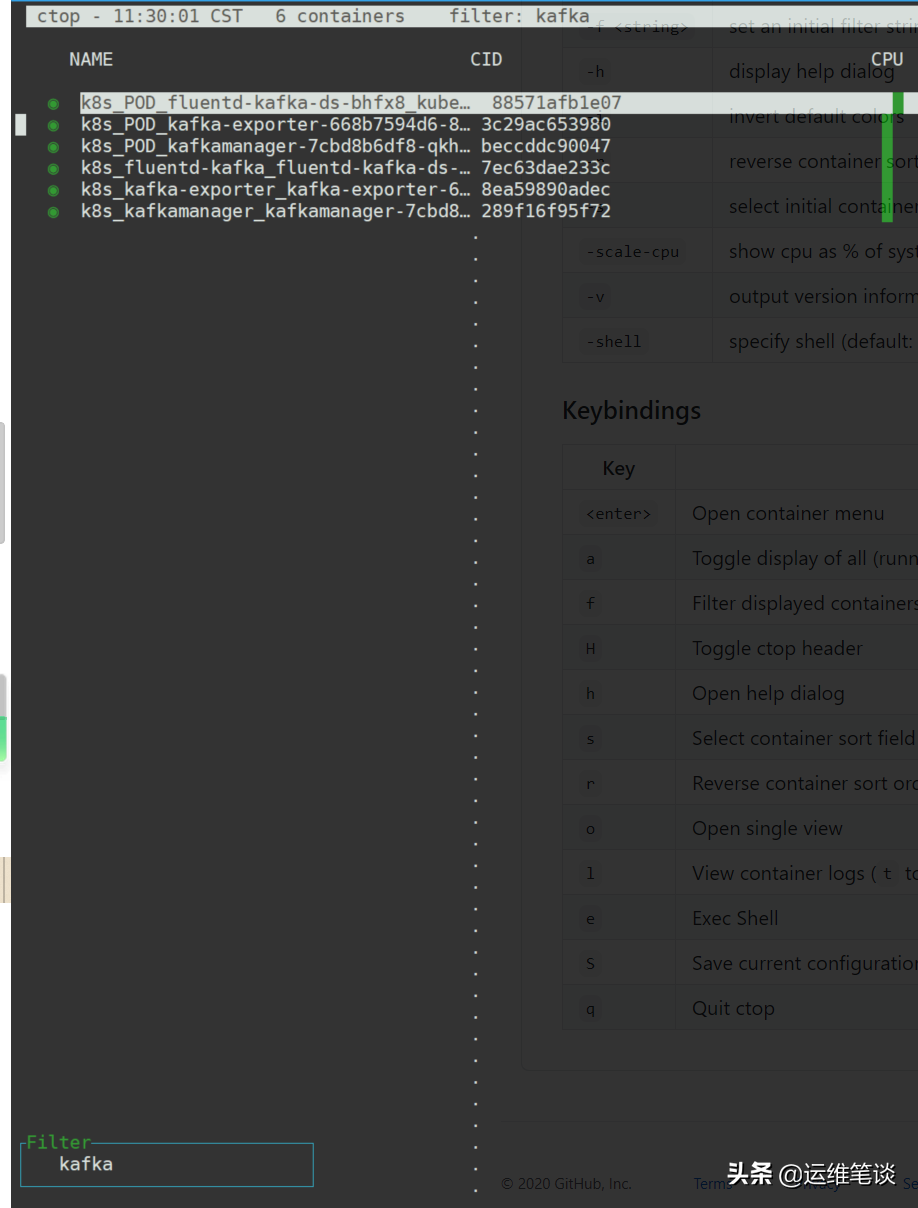 搜索包含kafka的容器
2、o 单容器信息模式
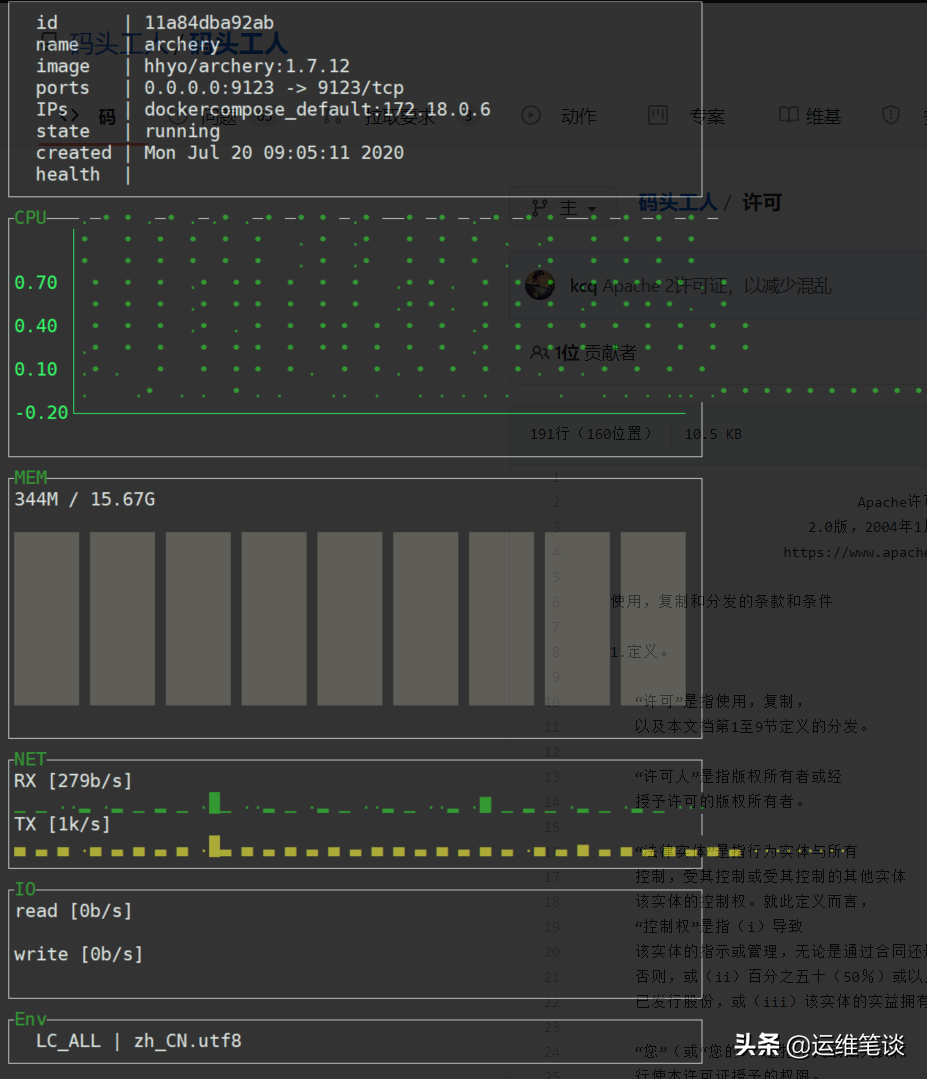 archery容器的指标信息
3、s 选择容器排序的字段,排序字段包含cpu,io,mem,mem %,name,pids,net,state
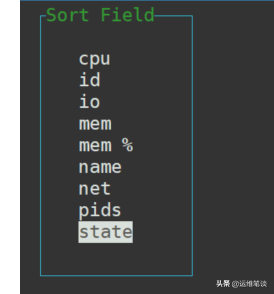
比如我选择按mem %排序(PS:能够识别添加的内存limit限制)
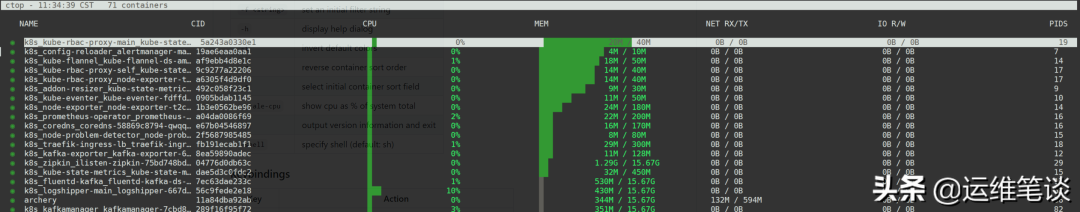 容器使用的内存百分比排序
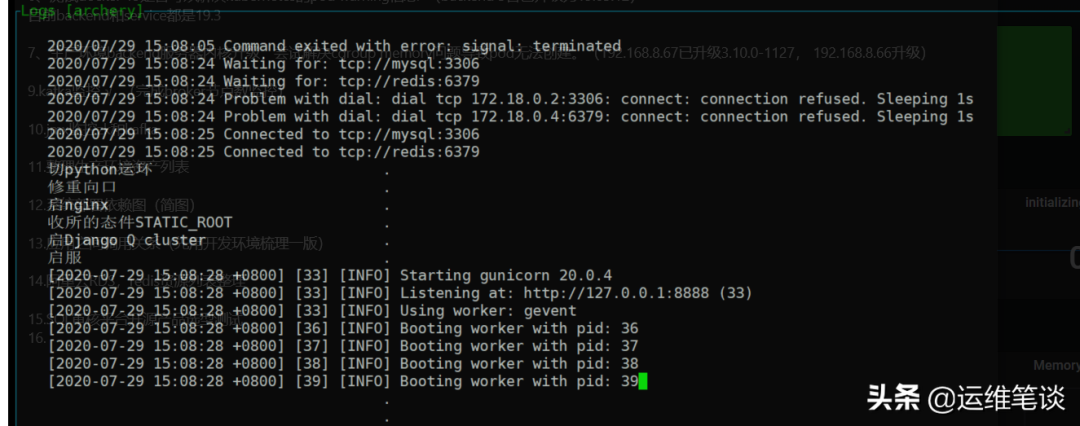
4、l 查看容器的日志,如下图查看容器名 archery的日志
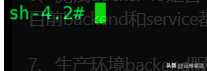
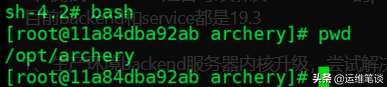
 5、e 进入容器内部,默认是sh,若容器支持bash,可以切换到bash下

文章转载自运维笔谈,如果涉嫌侵权,请发送邮件至:contact@modb.pro进行举报,并提供相关证据,一经查实,墨天轮将立刻删除相关内容。
