点击上方蓝色 “运维笔谈”,对话输入“阿里云k8s”可以获取《阿里云Kubernetes项目实战手册》PDF。
GlusterFS的监控方面我首选Prometheus,我们直接在github找已经造好的轮子。以下两个exporter值得推荐:
1. https://github.com/gluster/gluster-prometheus # glusterfs官方仓库2. https://github.com/ofesseler/gluster_exporter # 轻量简单

一、先测试下gluster-prometheus
1.Github没有编译好的二进制文件(吐槽下,还要自己编译)
yum -y install goexport GOPATH=/root/go # 安装之后需要加下GOPATH环境变量mkdir -p $GOPATH/src/github.com/glustercd $GOPATH/src/github.com/glustergit clone https://github.com/gluster/gluster-prometheus.gitcd gluster-prometheus# Install the required dependancies.# Hint: assumes that GOPATH and PATH are already configured../scripts/install-reqs.shgo get -u github.com/golang/dep/cmd/dep # 需要上网条件好go get github.com/alecthomas/gometalinter # 需要上网条件好PREFIX=/usr make # 需要上网条件好PREFIX=/usr make install
2.按照Github上教程,过程略坑,首先要在Linux服务器上安装好go环境,以下步骤是需要注意的地方,有些步骤还需要上网条件好才行!!!我尝试使用GOPROXY没有成功。
yum -y install go # go环境准备export GOPATH=/root/gogo get -u github.com/golang/dep/cmd/dep #go包管理器go get github.com/alecthomas/gometalinter #go包管理器
3.编译完成得到可执行文件gluster-exporter,若读者朋友们编译不了,可以私信我,我会把编译好的二进制文件发给你。
4.然后我们执行 PREFIX=/usr make install 会产生systemd 文件。
install -D build/gluster-exporter usr/sbin/gluster-exporterinstall -D -m 0644 build/gluster-exporter.service usr/lib/systemd/system/gluster-exporter.serviceinstall -D -m 0600 ./extras/conf/gluster-exporter.toml.sample ""/etc/gluster-exporter/gluster-exporter.toml
5.启动gluster-exporter服务
systemctl enable gluster-exportersystemctl start gluster-exporter
6.配置文件参考:/etc/gluster-exporter/gluster-exporter.toml
[globals]gluster-mgmt = "glusterd"glusterd-dir = "/var/lib/glusterd"gluster-binary-path = "gluster"# If you want to connect to a remote gd1 host, set the variable gd1-remote-host# However, using a remote host restrict the gluster cli to read-only commands# The following collectors won't work in remote mode : gluster_volume_counts, gluster_volume_profile#gd1-remote-host = "localhost"gd2-rest-endpoint = "http://127.0.0.1:24007"port = 9713metrics-path = "/metrics"log-dir = "/var/log"log-file = "gluster-exporter.log"log-level = "info"[collectors.gluster_ps]name = "gluster_ps"sync-interval = 5disabled = false[collectors.gluster_brick]name = "gluster_brick"sync-interval = 5disabled = false
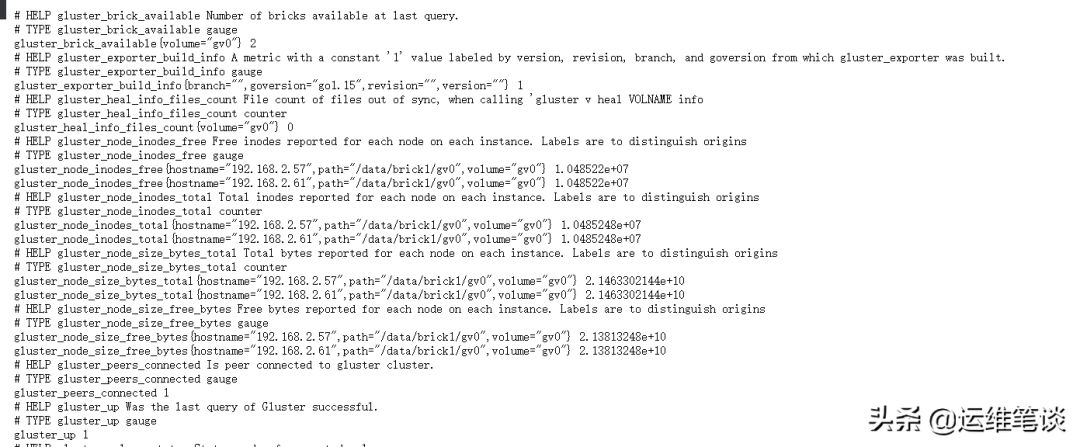
7.测试下是否获取到gluster数据,我们在浏览器访问 http://IP:9713/metrics 或者服务器上curl下。
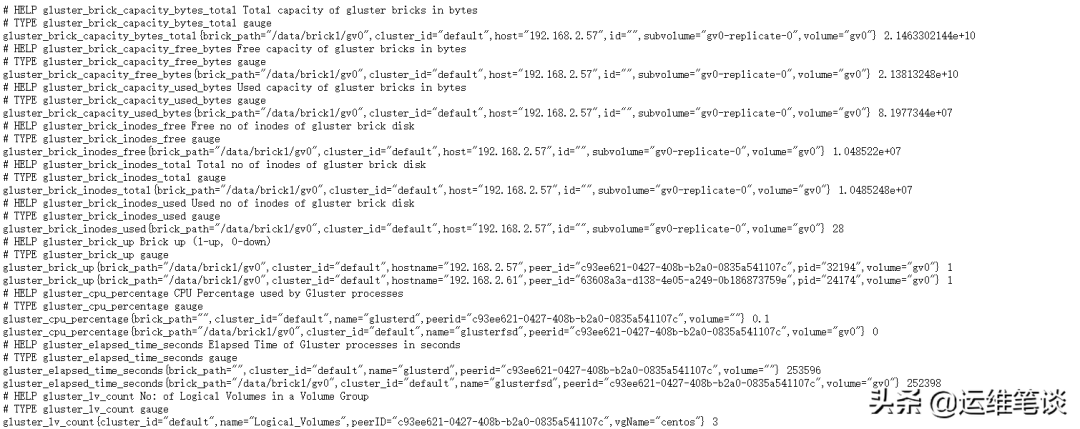
8.具体的 metric 的定义解释在:
https://github.com/gluster/gluster-prometheus/blob/master/docs/metrics.adoc
这个官方的exporter指标还是挺丰富的,gfs的CPU,内存,inode,读写,磁盘等信息都有,能满足监控的要求。
9.注意点:Glusterfs最好每个节点都跑下,有些集群的指标为了避免重复,所以first up peer in peer list will export these metrics,可以查看issues:
https://github.com/gluster/gluster-prometheus/issues/148

二、我们再测下github.com/ofesseler/gluster_exporter
1.安装
go get github.com/ofesseler/gluster_exporter # golang.org可能需要网速快才1.安装行./gluster_exporter
2.gluster_exporter 默认端口是 9189
不需要配置文件,直接在对应的glusterfs节点上运行即可。
3.获取的指标相对官方来说少了一些,总体还是够用的,主要是通过以下命令获取到信息。
gluster volume infogluster peer statusgluster volume profile gv_test info cumulativegluster volume status all detail
三、添加到prometheus服务端
1.创建service和servicemonitor文件
我们的Prometheus是通过prometheus-operator跑在Kubernetes集群上,所以还需要手动添加下service和servicemonitor。
a.创建一个service文件
apiVersion: v1kind: Servicemetadata:name: gluster-exporternamespace: monitoringlabels:k8s-app: gluster-exporterspec:type: ClusterIPclusterIP: Noneports:- name: portport: 9189protocol: TCP---apiVersion: v1kind: Endpointsmetadata:name: glusterexporternamespace: monitoringlabels:k8s-app: glusterexportersubsets:- addresses:- ip: 192.168.2.61nodeName: gfs- ip: 192.168.2.57nodeName: node01ports:- name: portport: 9189protocol: TCP
b.创建一个servicemonitor文件用来做prometheus的服务发现。
apiVersion: monitoring.coreos.com/v1kind: ServiceMonitormetadata:name: gluster-exporternamespace: monitoringlabels:k8s-app: gluster-exporterspec:endpoints:- port: portinterval: 30sscheme: httpselector:matchLabels:k8s-app: gluster-exporternamespaceSelector:matchNames:- monitoring
2.kubectl apply -f 执行下刚才创建service和servicemonitor文件
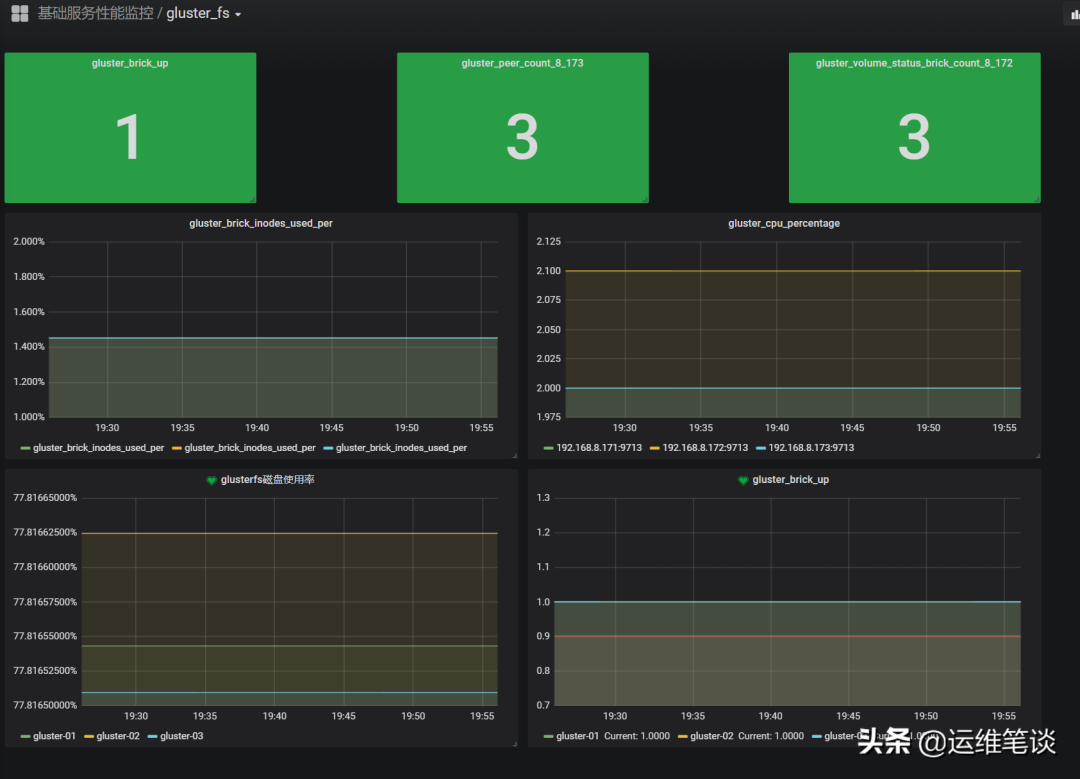
四、Grafana绘图
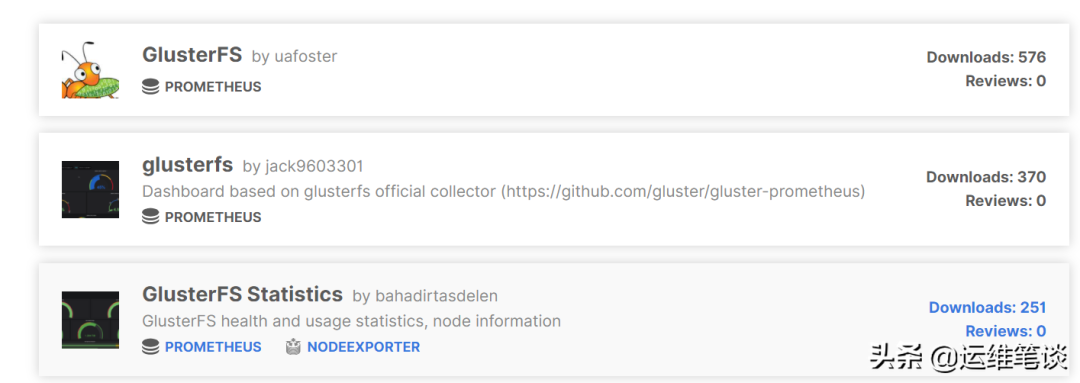
1.Grafana的官方有对应的glusterfs的模板,喜欢的读者可以去下载
https://grafana.com/grafana/dashboards?search=gluster
2.我没有使用grafana上的模板,自己做了一个简单的,如下图: