


前言:
最近闲来无事在尝试把大学学的C语言开发捡起来,然后了解一些PG的源码相关知识,本篇文章适用于对Linux 以及c语言开发感兴趣的小伙伴阅读并使用。在我们日常的开发中,通常情况下会对自己写的代码进行调试,GDB(GNU Debugger)则是一个功能强大的程序调试工具。如果想成为一个Linux开发者或者开源数据库的开发者熟练掌握GDB工具也是必须掌握的技能。
一、什么是GDB (了解的可以跳过)
GDB(GNU Debugger)是GNU项目中的一个关键组成部分,它是一款功能强大的程序调试工具,广泛应用于Linux和其他类Unix操作系统中。GDB支持多种编程语言,特别是C和C++,使得开发者能够在源代码级别上深入调试他们的程序。通过GDB,开发者可以设置断点、单步执行代码、查看和修改变量值、检查调用栈以及执行其他调试任务,从而更有效地定位和解决程序中的错误。
GDB的工作原理基于进程控制和符号表管理。它能够控制被调试程序的执行,包括启动、暂停、继续执行以及单步执行等操作。同时,GDB能够读取程序的符号表信息,这些符号表记录了程序中的函数名、变量名、类型信息等调试信息,从而帮助开发者理解程序的内部结构和状态。除了基本的调试功能外,GDB还提供了一系列高级特性,如条件断点、自动显示变量、远程调试以及多线程调试等。这些特性进一步增强了GDB的调试能力,使得开发者可以更加灵活和高效地进行程序调试。
二、如何安装GDB
在Debian/Ubuntu系统中,可以使用以下命令安装GDB:
sudo apt-get update
sudo apt-get install gdb
在CentOS/RHEL系统中,可以使用以下命令:
yum -y install gdb 在Fedora系统中,可以使用以下命令:
sudo dnf install gdb
安装完了可以自己验证下。
三、如何使用GDB
[root@Halo16 ~]# gdb --help
This is the GNU debugger.  Usage:

    gdb [options] [executable-file [core-file or process-id]]
    gdb [options] --args executable-file [inferior-arguments ...]
    gdb [options] [--python|-P] script-file [script-arguments ...]

Options:

  --args             Arguments after executable-file are passed to inferior
  -b BAUDRATE        Set serial port baud rate used for remote debugging.
  --batch            Exit after processing options.
  --batch-silent     As for --batch, but suppress all gdb stdout output.
  --return-child-result
                     GDB exit code will be the child's exit code.
  --cd=DIR           Change current directory to DIR.
  --command=FILE, -x Execute GDB commands from FILE.
  --eval-command=COMMAND, -ex
                     Execute a single GDB command.
                     May be used multiple times and in conjunction
                     with --command.
  --init-command=FILE, -ix Like -x but execute it before loading inferior.
  --init-eval-command=COMMAND, -iex Like -ex but before loading inferior.
  --core=COREFILE    Analyze the core dump COREFILE.
  --pid=PID          Attach to running process PID.
  --dbx              DBX compatibility mode.
  --directory=DIR    Search for source files in DIR.
  --exec=EXECFILE    Use EXECFILE as the executable.
  --fullname         Output information used by emacs-GDB interface.
  --help             Print this message.
  --interpreter=INTERP
                     Select a specific interpreter / user interface
  -l TIMEOUT         Set timeout in seconds for remote debugging.
  --nw		     Do not use a window interface.
  --nx               Do not read any .gdbinit files.
  --nh               Do not read .gdbinit file from home directory.
  --python, -P       Following argument is Python script file; remaining
                     arguments are passed to script.
  --quiet            Do not print version number on startup.
  --readnow          Fully read symbol files on first access.
  --readnever        Do not read symbol files.
  --se=FILE          Use FILE as symbol file and executable file.
  --symbols=SYMFILE  Read symbols from SYMFILE.
  --tty=TTY          Use TTY for input/output by the program being debugged.
  --tui              Use a terminal user interface.
  --version          Print version information and then exit.
  -w                 Use a window interface.
  --write            Set writing into executable and core files.
  --xdb              XDB compatibility mode.

At startup, GDB reads the following init files and executes their commands:
   * system-wide init file: /etc/gdbinit

For more information, type "help" from within GDB, or consult the
GDB manual (available as on-line info or a printed manual).
Report bugs to "<http://www.gnu.org/software/gdb/bugs/>".
在使用GDB 之前需要使用带有-g编译选项的GCC命令来编译源程序,以包含调试信息。例如:
1、编译程序:
gcc -g -o zzgdb zzgdb.c2、启动GDB:
gdb ./zzgdb3、常用命令:
run [arguments] 或 r [arguments]
- 运行程序,可以传递命令行参数。
start
- 运行程序直到main函数的入口。
continue 或 c
- 继续运行程序,直到遇到断点或程序结束。
next 或 n
- 单步执行下一行代码,函数调用视为单一步骤(不进入函数内部)。
step 或 s
- 单步进入函数内部执行。
finish
- 执行到当前函数返回。
jump [address] 或 j [address]
- 让程序跳转到指定地址执行。
until [location]
- 执行直到离开当前循环或到达指定位置。
quit 或 q
- 退出GDB。
4、如果需要进行调试程序:
break [location] 或 b [location]
- 在指定位置设置断点。location可以是行号、函数名、文件名:行号或地址。
break if [condition]
- 设置条件断点,仅当condition为真时才触发断点。
clear [location]
- 清除指定位置的断点。
delete [Num] 或 d [Num]
- 删除编号为Num的断点。
delete 或 d
- 删除所有断点。
enable [Num]
- 启用编号为Num的断点。
disable [Num]
- 禁用编号为Num的断点。
info break 或 info b
- 显示所有断点的信息。
5、内存查看命令
x/[N][F][U] [ADDR]
- 查看内存内容。N表示需要显示的内存单元个数,F表示显示格式(如x为十六进制,d为十进制等),U表示每个单元的大小(如b为字节,h为半字,w为字,g为双字)。ADDR是起始地址。
setprint asm-demangle on
- 设置反汇编时显示易读的名字
6、反汇编命令:
disass [function]
- 反汇编指定的函数。
disass [address]
- 反汇编指定的地址。
disass [addr_start] [addr_end]
- 反汇编起始地址和结束地址之间的代码。
disass [addr_start],+[offset]
- 反汇编起始地址+偏移量之间的代码。
四、案例
1、示例代码(zzgdbtest.c)
#include <stdio.h>

int add(int a, int b) {
    return a + b;
}

int main() {
    int x = 5;
    int y = 10;
    int result = add(x, y);
    printf("Result: %d\n", result);
    return 0;
}
1、编译源代码:
gcc -g zzgdbtest.c -o zzgdbtest2、启动GDB :
gdb ./zzgdbtest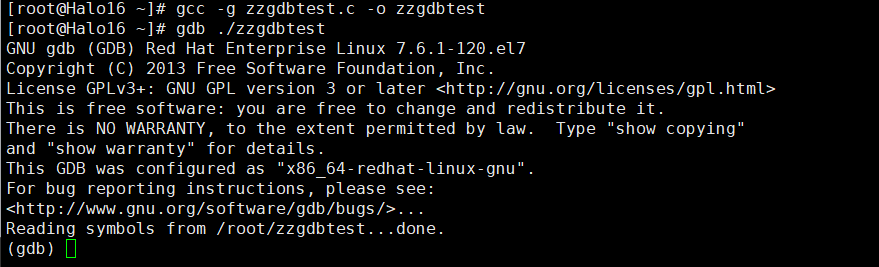
3、设置断点 :
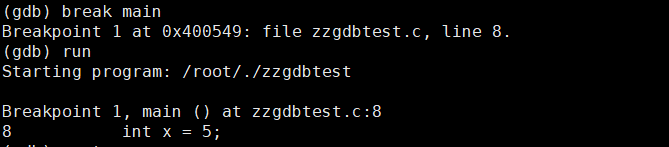
在 main 函数的入口设置断点:
(gdb) break mainBreakpoint 1 at 0x400549: file zzgdbtest.c, line 8.
缺个包,顺手打上。
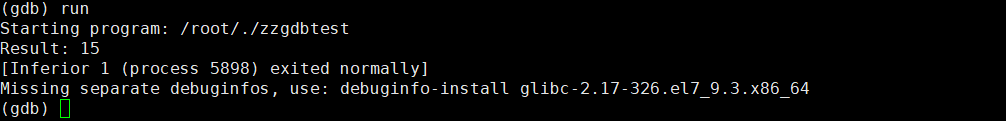
4、运行程序 :
(gdb) run
Starting program: /root/./zzgdbtest

Breakpoint 1, main () at zzgdbtest.c:8
8	    int x = 5;
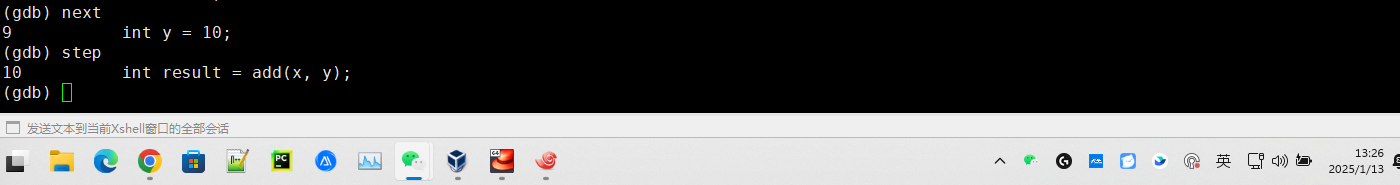
如果需要单步调试,那就如下,或者用step:
(gdb) next
9	    int y = 10;
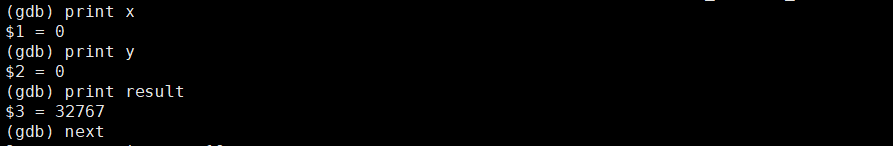
5、查看变量 :
(gdb) print x
$1 = 0
(gdb) print y
$2 = 0
(gdb) print result
$3 = 32767
简单的使用方式,大概就是这个样子。
最后:
虽然是慢工,但是不是什么细活, 2025年的开年第一篇,我们下期见。
