


Table of Contents
Preface
- Visualizing the Oracle Performance Graph by Average Active Sessions (Chinese)
- Visualizing the Oracle Performance Graph by Average Active Sessions & Logic CPUs (Chinese)
- Visualizing the Oracle Performance Graph by Average Runnable Processes (Chinese)
- Visualizing the Oracle Performance Graph by Active Sessions Per Activity Class (Chinese)


Dimension Directory Lists
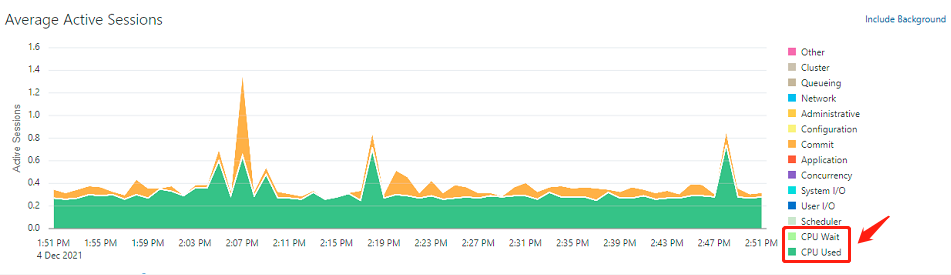
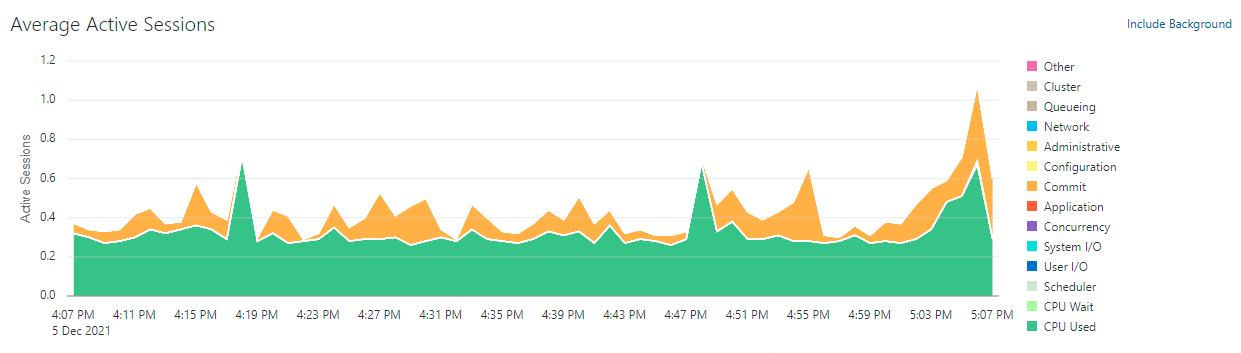
Active Sessions Per Wait Class in last 1 hour
Exploring "CPU Used" and "CPU Wait"
SET LINESIZE 200

COLUMN metric_name FORMAT a30
COLUMN metric_unit FORMAT a25

SELECT DISTINCT metric_name
     , metric_unit
FROM v$sysmetric_history
WHERE metric_name LIKE '%Database%'
OR    metric_name LIKE '%CPU%'
ORDER BY 1
;

METRIC_NAME                    METRIC_UNIT
------------------------------ -------------------------
Background CPU Usage Per Sec   CentiSeconds Per Second
CPU Usage Per Sec              CentiSeconds Per Second  <<==
CPU Usage Per Txn              CentiSeconds Per Txn
Database CPU Time Ratio        % Cpu/DB_Time            <<==
Database Time Per Sec          CentiSeconds Per Second  <<==
Database Wait Time Ratio       % Wait/DB_Time
Host CPU Usage Per Sec         CentiSeconds Per Second
Host CPU Utilization (%)       % Busy/(Idle+Busy)

8 rows selected.
As you can see above my query returned line 2, 4 and 5 (marked with "<<=="), we hope to get a conclusion that "CPU Usage Per Sec" compares with "Database Time Per Sec" * "Database CPU Time Ratio", the following is the corresponding SQL query and result.
SET LINESIZE 200
SET PAGESIZE 100

COLUMN sample_time     FORMAT a11
COLUMN metric_name     FORMAT a11
COLUMN active_sessions FORMAT 999,999.999

WITH
cpu_1 AS
(
  SELECT TO_CHAR(end_time, 'hh24:mi:ss') sample_time
       , DECODE(metric_name, 'CPU Usage Per Sec', 'CPU_1') metric_name
       , ROUND(value/1e2, 3) active_sessions
  FROM v$sysmetric_history
  WHERE metric_name = 'CPU Usage Per Sec'
  AND   group_id = 2
  AND   end_time >= SYSDATE - INTERVAL '60' MINUTE
  ORDER BY sample_time
),
db_cpu AS
(
  SELECT TO_CHAR(end_time, 'hh24:mi:ss') sample_time
       , MAX(DECODE(metric_name, 'Database Time Per Sec'  , value/1e2)) aas_value
       , MAX(DECODE(metric_name, 'Database CPU Time Ratio', value/1e2)) cpu_ratio
  FROM v$sysmetric_history
  WHERE metric_name IN ('Database Time Per Sec', 'Database CPU Time Ratio')
  AND   group_id = 2
  AND   end_time >= SYSDATE - INTERVAL '60' MINUTE
  GROUP BY TO_CHAR(end_time, 'hh24:mi:ss')
  ORDER BY sample_time
),
cpu_2 AS
(
  SELECT sample_time
       , 'CPU_2' metric_name
       , ROUND(aas_value*cpu_ratio, 3) active_sessions
  FROM db_cpu
)
SELECT c1.sample_time
     , c2.sample_time
     , 'CPU Diff' metric_name
     , c1.active_sessions - c2.active_sessions active_sessions
FROM cpu_1 c1
   , cpu_2 c2
WHERE c1.sample_time = c2.sample_time
;

SAMPLE_TIME SAMPLE_TIME METRIC_NAME ACTIVE_SESSIONS
----------- ----------- ----------- ---------------
09:26:44    09:26:44    CPU Diff               .000
09:27:45    09:27:45    CPU Diff               .000
09:28:45    09:28:45    CPU Diff               .000
09:29:44    09:29:44    CPU Diff               .000
09:30:45    09:30:45    CPU Diff               .000
09:31:44    09:31:44    CPU Diff               .000
09:32:45    09:32:45    CPU Diff               .000
09:33:44    09:33:44    CPU Diff               .000
09:34:45    09:34:45    CPU Diff               .000
09:35:45    09:35:45    CPU Diff               .000
09:36:44    09:36:44    CPU Diff               .000
09:37:45    09:37:45    CPU Diff               .000
09:38:45    09:38:45    CPU Diff               .000
09:39:44    09:39:44    CPU Diff               .000
09:40:45    09:40:45    CPU Diff               .000
09:41:44    09:41:44    CPU Diff               .000
09:42:45    09:42:45    CPU Diff               .000
09:43:45    09:43:45    CPU Diff               .000
09:44:45    09:44:45    CPU Diff               .000
09:45:45    09:45:45    CPU Diff               .000
09:46:44    09:46:44    CPU Diff               .000
09:47:45    09:47:45    CPU Diff               .000
09:48:45    09:48:45    CPU Diff               .000
09:49:44    09:49:44    CPU Diff               .000
09:50:45    09:50:45    CPU Diff               .000
09:51:45    09:51:45    CPU Diff               .000
09:52:45    09:52:45    CPU Diff               .000
09:53:45    09:53:45    CPU Diff               .000
09:54:45    09:54:45    CPU Diff               .000
09:55:45    09:55:45    CPU Diff               .000
09:56:45    09:56:45    CPU Diff               .000
09:57:45    09:57:45    CPU Diff               .000
09:58:45    09:58:45    CPU Diff               .000
09:59:45    09:59:45    CPU Diff               .000
10:00:44    10:00:44    CPU Diff               .000
10:01:45    10:01:45    CPU Diff               .000
10:02:45    10:02:45    CPU Diff               .000
10:03:45    10:03:45    CPU Diff               .000
10:04:45    10:04:45    CPU Diff               .000
10:05:45    10:05:45    CPU Diff               .000
10:06:45    10:06:45    CPU Diff               .000
10:07:45    10:07:45    CPU Diff               .000
10:08:45    10:08:45    CPU Diff               .000
10:09:45    10:09:45    CPU Diff               .000
10:10:45    10:10:45    CPU Diff               .000
10:11:45    10:11:45    CPU Diff               .000
10:12:45    10:12:45    CPU Diff               .000
10:13:45    10:13:45    CPU Diff               .000
10:14:45    10:14:45    CPU Diff               .000
10:15:45    10:15:45    CPU Diff               .000
10:16:45    10:16:45    CPU Diff               .000
10:17:46    10:17:46    CPU Diff               .000
10:18:45    10:18:45    CPU Diff               .000
10:19:45    10:19:45    CPU Diff               .000
10:20:46    10:20:46    CPU Diff               .000
10:21:45    10:21:45    CPU Diff               .000
10:22:45    10:22:45    CPU Diff               .000
10:23:45    10:23:45    CPU Diff               .000
10:24:45    10:24:45    CPU Diff               .000
10:25:45    10:25:45    CPU Diff               .000

60 rows selected.
Amazing! They're real equivalent. Next we investigate the case of "Database CPU Time Ratio" + "Database Wait Time Ratio". Taking a closer look at this SQL query and result as below:
SET LINESIZE 200
SET PAGESIZE 100

COLUMN sample_time     FORMAT a11
COLUMN metric_name     FORMAT a11
COLUMN active_sessions FORMAT 999,999.999

WITH
cpu_and_wait_ratio AS
(
  SELECT TO_CHAR(end_time, 'hh24:mi:ss') sample_time
       , MAX(DECODE(metric_name, 'Database CPU Time Ratio' , value/1e2)) cpu_ratio
       , MAX(DECODE(metric_name, 'Database Wait Time Ratio', value/1e2)) wait_ratio
  FROM v$sysmetric_history
  WHERE metric_name IN ('Database CPU Time Ratio', 'Database Wait Time Ratio')
  AND   group_id = 2
  AND   end_time >= SYSDATE - INTERVAL '60' MINUTE
  GROUP BY TO_CHAR(end_time, 'hh24:mi:ss')
  ORDER BY sample_time
)
SELECT sample_time
     , 'Total Ratio' metric_name
     , ROUND(cpu_ratio+wait_ratio, 3) total_ratio
FROM cpu_and_wait_ratio
ORDER BY sample_time
;

SAMPLE_TIME METRIC_NAME TOTAL_RATIO
----------- ----------- -----------
09:41:44    Total Ratio       1.292
09:42:45    Total Ratio       1.452
09:43:45    Total Ratio       1.432
09:44:45    Total Ratio       1.425
09:45:45    Total Ratio       1.272
09:46:44    Total Ratio       1.165
09:47:45    Total Ratio       1.164
09:48:45    Total Ratio       1.061
09:49:44    Total Ratio       1.296
09:50:45    Total Ratio       1.406
09:51:45    Total Ratio        1.44
09:52:45    Total Ratio       1.365
09:53:45    Total Ratio       1.124
09:54:45    Total Ratio       1.307
09:55:45    Total Ratio        1.15
09:56:45    Total Ratio       1.255
09:57:45    Total Ratio       1.342
09:58:45    Total Ratio       1.168
09:59:45    Total Ratio       1.337
10:00:44    Total Ratio       1.323
10:01:45    Total Ratio       1.313
10:02:45    Total Ratio       1.284
10:03:45    Total Ratio       1.124
10:04:45    Total Ratio       1.204
10:05:45    Total Ratio       1.057
10:06:45    Total Ratio       1.085
10:07:45    Total Ratio           1
10:08:45    Total Ratio       1.296
10:09:45    Total Ratio       1.368
10:10:45    Total Ratio       1.326
10:11:45    Total Ratio       1.405
10:12:45    Total Ratio       1.326
10:13:45    Total Ratio       1.246
10:14:45    Total Ratio       1.326
10:15:45    Total Ratio       1.184
10:16:45    Total Ratio       1.375
10:17:46    Total Ratio       1.415
10:18:45    Total Ratio       1.061
10:19:45    Total Ratio       1.075
10:20:46    Total Ratio       1.265
10:21:45    Total Ratio       1.198
10:22:45    Total Ratio        1.34
10:23:45    Total Ratio       1.293
10:24:45    Total Ratio       1.273
10:25:45    Total Ratio       1.221
10:26:45    Total Ratio       1.254
10:27:46    Total Ratio       1.221
10:28:45    Total Ratio       1.219
10:29:46    Total Ratio       1.315
10:30:45    Total Ratio       1.087
10:31:45    Total Ratio       1.256
10:32:45    Total Ratio       1.213
10:33:45    Total Ratio       1.295
10:34:46    Total Ratio       1.394
10:35:45    Total Ratio       1.176
10:36:45    Total Ratio       1.018
10:37:45    Total Ratio       1.196
10:38:45    Total Ratio       1.169
10:39:46    Total Ratio       1.225
10:40:45    Total Ratio       1.184

60 rows selected.
Wow! The ratio is exceeded 100%, why? We know, on one hand AAS ("Average Active Sessions", aka, "Database Time Per Sec") includes the CPU Time and Wait Time (non-idle) on oracle database, on the other hand CPU Time on oracle database also contains CPU Used and CPU Wait, I think that the metric_name "Database Wait Time Ratio" should include the ratio of CPU Wait and Wait Time (non-idle), otherwise the prior total ratio is impossible to exceed 100%. In other words oracle calculates CPU Wait twice in "Database CPU Time Ratio" and "Database Wait Time Ratio". However, our aim is to acquire CPU Used and CPU Wait from total CPU Time. Now the current workaround retrieving CPU Used is like this, "Database Time Per Sec" * (1 - "Database Wait Time Ratio"), next CPU Wait is such as, "CPU Usage Per Sec" - "CPU Used". Certainly, the subsequent SQL query and result is as follows:
-- The SQL statement about 'CPU Used' and 'CPU Wait' is right.

SET LINESIZE 200
SET PAGESIZE 150

COLUMN sample_time     FORMAT a11
COLUMN metric_name     FORMAT a11
COLUMN active_sessions FORMAT 999,999.999

WITH
all_cpu AS
(
  SELECT TO_CHAR(end_time, 'hh24:mi:ss') sample_time
       , DECODE(metric_name, 'CPU Usage Per Sec', 'CPU') metric_name
       , ROUND(value/1e2, 3) active_sessions
  FROM v$sysmetric_history
  WHERE metric_name = 'CPU Usage Per Sec'
  AND   group_id = 2
  AND   end_time >= SYSDATE - INTERVAL '60' MINUTE
  ORDER BY sample_time
),
db_wait AS
(
  SELECT TO_CHAR(end_time, 'hh24:mi:ss') sample_time
       , MAX(DECODE(metric_name, 'Database Time Per Sec'   , value/1e2)) aas_value
       , MAX(DECODE(metric_name, 'Database Wait Time Ratio', value/1e2)) wait_ratio
  FROM v$sysmetric_history
  WHERE metric_name IN ('Database Time Per Sec', 'Database Wait Time Ratio')
  AND   group_id = 2
  AND   end_time >= SYSDATE - INTERVAL '60' MINUTE
  GROUP BY TO_CHAR(end_time, 'hh24:mi:ss')
  ORDER BY sample_time
),
cpu_used AS
(
  SELECT sample_time
       , 'CPU Used' metric_name
       , ROUND(aas_value*(1-wait_ratio), 3) active_sessions
  FROM db_wait
),
cpu_wait AS
(
  SELECT cu.sample_time
       , 'CPU Wait' metric_name
       , ac.active_sessions - cu.active_sessions active_sessions
  FROM all_cpu  ac
     , cpu_used cu
  WHERE ac.sample_time = cu.sample_time
)
SELECT * FROM cpu_used
UNION ALL
SELECT * FROM cpu_wait
;

SAMPLE_TIME METRIC_NAME ACTIVE_SESSIONS
----------- ----------- ---------------
10:30:45    CPU Used               .386
10:31:45    CPU Used               .301
10:32:45    CPU Used               .240
10:33:45    CPU Used               .261
10:34:46    CPU Used               .200
10:35:45    CPU Used               .290
10:36:45    CPU Used               .312
10:37:45    CPU Used               .244
10:38:45    CPU Used               .274
10:39:46    CPU Used               .268
10:40:45    CPU Used               .283
10:41:45    CPU Used               .193
10:42:45    CPU Used               .209
10:43:45    CPU Used               .263
10:44:46    CPU Used               .242
10:45:45    CPU Used               .257
10:46:45    CPU Used               .285
10:47:46    CPU Used               .222
10:48:45    CPU Used               .615
10:49:45    CPU Used               .179
10:50:45    CPU Used               .196
10:51:45    CPU Used               .204
10:52:45    CPU Used               .251
10:53:45    CPU Used               .317
10:54:46    CPU Used               .225
10:55:45    CPU Used               .211
10:56:45    CPU Used               .242
10:57:46    CPU Used               .287
10:58:45    CPU Used               .253
10:59:45    CPU Used               .209
11:00:46    CPU Used               .182
11:01:46    CPU Used               .254
11:02:45    CPU Used               .255
11:03:46    CPU Used               .291
11:04:45    CPU Used               .435
11:05:46    CPU Used               .430
11:06:46    CPU Used               .485
11:07:45    CPU Used               .343
11:08:45    CPU Used               .224
11:09:46    CPU Used               .226
11:10:46    CPU Used               .206
11:11:45    CPU Used               .257
11:12:46    CPU Used               .218
11:13:46    CPU Used               .237
11:14:46    CPU Used               .219
11:15:46    CPU Used               .222
11:16:45    CPU Used               .194
11:17:46    CPU Used               .218
11:18:45    CPU Used               .624
11:19:45    CPU Used               .206
11:20:46    CPU Used               .212
11:21:45    CPU Used               .246
11:22:46    CPU Used               .272
11:23:46    CPU Used               .283
11:24:45    CPU Used               .252
11:25:46    CPU Used               .414
11:26:46    CPU Used               .356
11:27:45    CPU Used               .249
11:28:46    CPU Used               .426
11:29:46    CPU Used               .263
10:30:45    CPU Wait               .033
10:31:45    CPU Wait               .077
10:32:45    CPU Wait               .051
10:33:45    CPU Wait               .077
10:34:46    CPU Wait               .079
10:35:45    CPU Wait               .051
10:36:45    CPU Wait               .006
10:37:45    CPU Wait               .048
10:38:45    CPU Wait               .047
10:39:46    CPU Wait               .060
10:40:45    CPU Wait               .052
10:41:45    CPU Wait               .084
10:42:45    CPU Wait               .080
10:43:45    CPU Wait               .033
10:44:46    CPU Wait               .035
10:45:45    CPU Wait               .033
10:46:45    CPU Wait               .062
10:47:46    CPU Wait               .075
10:48:45    CPU Wait               .070
10:49:45    CPU Wait               .089
10:50:45    CPU Wait               .083
10:51:45    CPU Wait               .071
10:52:45    CPU Wait               .039
10:53:45    CPU Wait               .048
10:54:46    CPU Wait               .058
10:55:45    CPU Wait               .066
10:56:45    CPU Wait               .054
10:57:46    CPU Wait               .029
10:58:45    CPU Wait               .070
10:59:45    CPU Wait               .068
11:00:46    CPU Wait               .082
11:01:46    CPU Wait               .022
11:02:45    CPU Wait               .044
11:03:46    CPU Wait               .049
11:04:45    CPU Wait               .064
11:05:46    CPU Wait               .064
11:06:46    CPU Wait               .037
11:07:45    CPU Wait               .072
11:08:45    CPU Wait               .074
11:09:46    CPU Wait               .064
11:10:46    CPU Wait               .079
11:11:45    CPU Wait               .039
11:12:46    CPU Wait               .056
11:13:46    CPU Wait               .067
11:14:46    CPU Wait               .063
11:15:46    CPU Wait               .054
11:16:45    CPU Wait               .074
11:17:46    CPU Wait               .068
11:18:45    CPU Wait               .062
11:19:45    CPU Wait               .072
11:20:46    CPU Wait               .060
11:21:45    CPU Wait               .038
11:22:46    CPU Wait               .034
11:23:46    CPU Wait               .020
11:24:45    CPU Wait               .032
11:25:46    CPU Wait               .063
11:26:46    CPU Wait               .076
11:27:45    CPU Wait               .073
11:28:46    CPU Wait               .059
11:29:46    CPU Wait               .080

120 rows selected.
[Back to ASPWC in last 1 hour]
Exploring the rest of Wait Class
I would like to thank Kyle Hailey because his SQL code snippet (also mentioned in my previous blog note) gave me some inspiration and thought. See here:
......
select
                 decode(n.wait_class,'User I/O','User I/O',
                                     'Commit','Commit',
                                     'Wait')                               CLASS,
                 sum(round(m.time_waited/m.INTSIZE_CSEC,3))                AAS,
                 BEGIN_TIME ,
                 END_TIME
           from  v$waitclassmetric  m,
                 v$system_wait_class n
           where m.wait_class_id=n.wait_class_id
             and n.wait_class != 'Idle'
           group by  decode(n.wait_class,'User I/O','User I/O', 'Commit','Commit', 'Wait'), BEGIN_TIME, END_TIME
......
Finally the SQL about Wait Class (due to so many returned lines thus omitted it) like this,
-- Wait Class (but no found 'Queueing').
SET LINESIZE 200
SET PAGESIZE 800
COLUMN sample_time FORMAT a11
COLUMN metric_name FORMAT a15
COLUMN active_sessions FORMAT 999,999.999
SELECT TO_CHAR(wcmh.end_time, 'hh24:mi:ss') sample_time
, swc.wait_class metric_name
, ROUND(wcmh.time_waited_fg/wcmh.intsize_csec, 3) active_sessions
FROM v$waitclassmetric_history wcmh
, v$system_wait_class swc
WHERE wcmh.wait_class_id = swc.wait_class_id
AND swc.wait_class <> 'Idle'
AND wcmh.end_time >= SYSDATE - INTERVAL '60' MINUTE
ORDER BY DECODE(swc.wait_class, 'Scheduler' , 1
, 'User I/O' , 2
, 'System I/O' , 3
, 'Concurrency' , 4
, 'Application' , 5
, 'Commit' , 6
, 'Configuration' , 7
, 'Administrative', 8
, 'Network' , 9
, 'Queueing' , 10
, 'Cluster' , 11
, 'Other' , 12
)
, sample_time
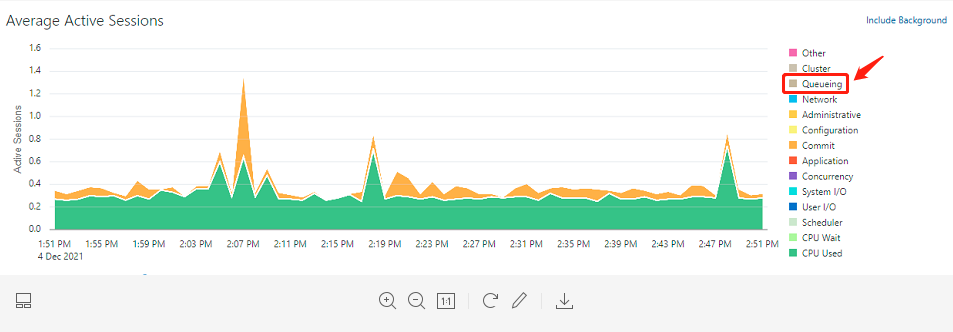
;Nevertheless I've no found this wait class with "Queueing" from above query result, you know, we can see the legend of "Queueing" from EMCC 13.5 in the following screenshot.
[Back to ASPWC in last 1 hour]
Adding "Queueing"
We can separately check the column "wait_class" from the view "v$system_wait_class" and "v$event_name", they're as below:
SELECT DISTINCT wait_class FROM v$system_wait_class ORDER BY 1;

WAIT_CLASS
---------------
Administrative
Application
Commit
Concurrency
Configuration
Idle
Network
Other
Scheduler
System I/O
User I/O

11 rows selected.
SELECT DISTINCT wait_class FROM v$event_name ORDER BY 1;
WAIT_CLASS
---------------
Administrative
Application
Cluster
Commit
Concurrency
Configuration
Idle
Network
Other
Queueing <<==
Scheduler
System I/O
User I/O
13 rows selected.Good! There exists "Queueing" on the SQL query of view "v$event_name". So we have to slightly adjust the preceding SQL about Wait Class, such as,
-- Wait Class (it has 'Queueing').

SET LINESIZE 200
SET PAGESIZE 800

COLUMN sample_time     FORMAT a11
COLUMN metric_name     FORMAT a15
COLUMN active_sessions FORMAT 999,999.999

WITH en_wc AS
(
  SELECT DISTINCT wait_class_id
       , wait_class
  FROM v$event_name
)
SELECT TO_CHAR(wcmh.end_time, 'hh24:mi:ss') sample_time
     , ew.wait_class metric_name
     , ROUND(wcmh.time_waited_fg/wcmh.intsize_csec, 3) active_sessions
FROM v$waitclassmetric_history wcmh
   , en_wc ew
WHERE wcmh.wait_class_id = ew.wait_class_id
AND   ew.wait_class <> 'Idle'
AND   wcmh.end_time >= SYSDATE - INTERVAL '60' MINUTE
ORDER BY DECODE(ew.wait_class, 'Scheduler'     , 1
                             , 'User I/O'      , 2
                             , 'System I/O'    , 3
                             , 'Concurrency'   , 4
                             , 'Application'   , 5
                             , 'Commit'        , 6
                             , 'Configuration' , 7
                             , 'Administrative', 8
                             , 'Network'       , 9
                             , 'Queueing'      , 10
                             , 'Cluster'       , 11
                             , 'Other'         , 12
               )
       , sample_time
;
[Back to ASPWC in last 1 hour]
Integrating "CPU Used", "CPU Wait" and "Wait Class" by "WITH xxx AS () ..."
The big query finished integrating "CPU Used", "CPU Wait" and "Wait Class" by "WITH xxx AS () ..." is as follows.
-- Active Sessions Per Wait Class from EMCC 13.5 in last 1 hour.

SET LINESIZE 200
SET PAGESIZE 1000

COLUMN sample_time     FORMAT a11
COLUMN metric_name     FORMAT a15
COLUMN active_sessions FORMAT 999,999.999

WITH
all_cpu AS
(
  SELECT TO_CHAR(end_time, 'hh24:mi:ss') sample_time
       , DECODE(metric_name, 'CPU Usage Per Sec', 'CPU') metric_name
       , ROUND(value/1e2, 3) active_sessions
  FROM v$sysmetric_history
  WHERE metric_name = 'CPU Usage Per Sec'
  AND   group_id = 2
  AND   end_time >= SYSDATE - INTERVAL '60' MINUTE
  ORDER BY sample_time
),
db_wait AS
(
  SELECT TO_CHAR(end_time, 'hh24:mi:ss') sample_time
       , MAX(DECODE(metric_name, 'Database Time Per Sec'   , value/1e2)) aas_value
       , MAX(DECODE(metric_name, 'Database Wait Time Ratio', value/1e2)) wait_ratio
  FROM v$sysmetric_history
  WHERE metric_name IN ('Database Time Per Sec', 'Database Wait Time Ratio')
  AND   group_id = 2
  AND   end_time >= SYSDATE - INTERVAL '60' MINUTE
  GROUP BY TO_CHAR(end_time, 'hh24:mi:ss')
  ORDER BY sample_time
),
cpu_used AS
(
  SELECT sample_time
       , 'CPU Used' metric_name
       , ROUND(aas_value*(1-wait_ratio), 3) active_sessions
  FROM db_wait
),
cpu_wait AS
(
  SELECT cu.sample_time
       , 'CPU Wait' metric_name
       , ac.active_sessions - cu.active_sessions active_sessions
  FROM all_cpu  ac
     , cpu_used cu
  WHERE ac.sample_time = cu.sample_time
),
en_wc AS
(
  SELECT DISTINCT wait_class_id
       , wait_class
  FROM v$event_name
),
wait_class AS
(
  SELECT TO_CHAR(wcmh.end_time, 'hh24:mi:ss') sample_time
       , ew.wait_class metric_name
       , ROUND(wcmh.time_waited_fg/wcmh.intsize_csec, 3) active_sessions
  FROM v$waitclassmetric_history wcmh
     , en_wc ew
  WHERE wcmh.wait_class_id = ew.wait_class_id
  AND   ew.wait_class <> 'Idle'
  AND   wcmh.end_time >= SYSDATE - INTERVAL '60' MINUTE
  ORDER BY DECODE(ew.wait_class, 'Scheduler'     , 1
                               , 'User I/O'      , 2
                               , 'System I/O'    , 3
                               , 'Concurrency'   , 4
                               , 'Application'   , 5
                               , 'Commit'        , 6
                               , 'Configuration' , 7
                               , 'Administrative', 8
                               , 'Network'       , 9
                               , 'Queueing'      , 10
                               , 'Cluster'       , 11
                               , 'Other'         , 12
                 )
         , sample_time
)
SELECT * FROM cpu_used
UNION ALL
SELECT * FROM cpu_wait
UNION ALL
SELECT * FROM wait_class
;
[Back to ASPWC in last 1 hour]
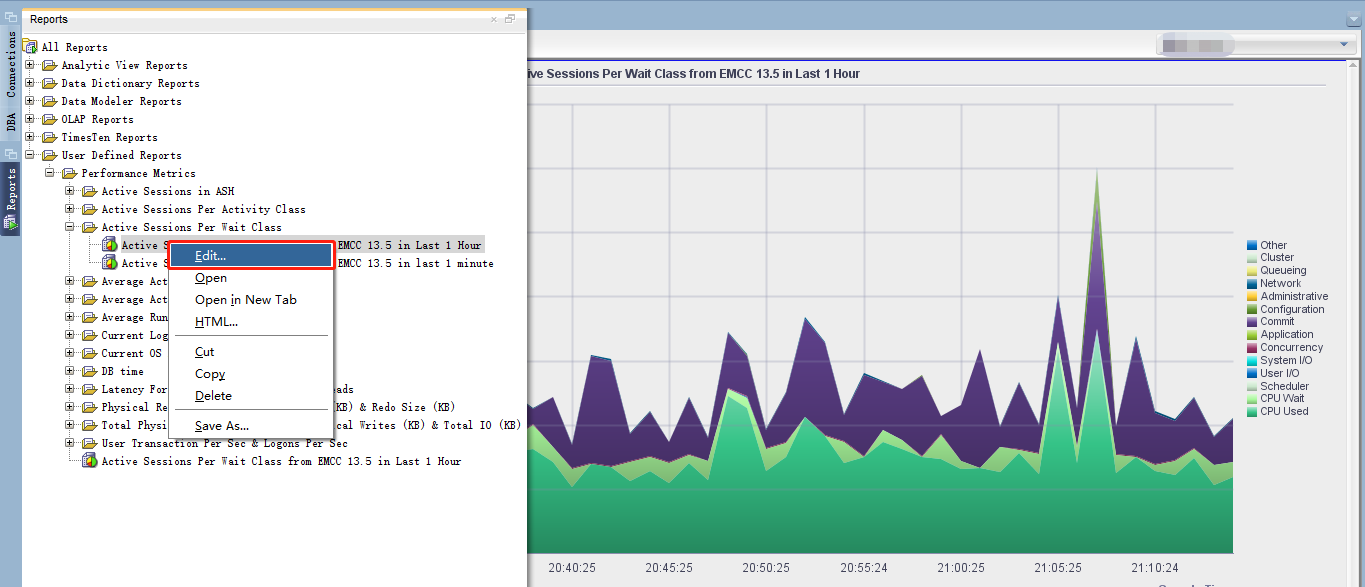
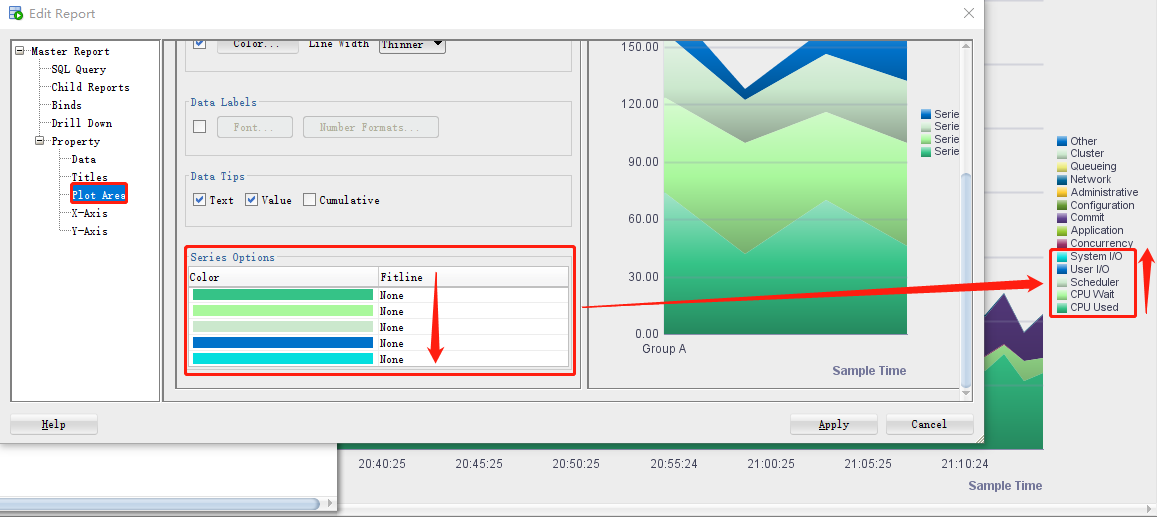
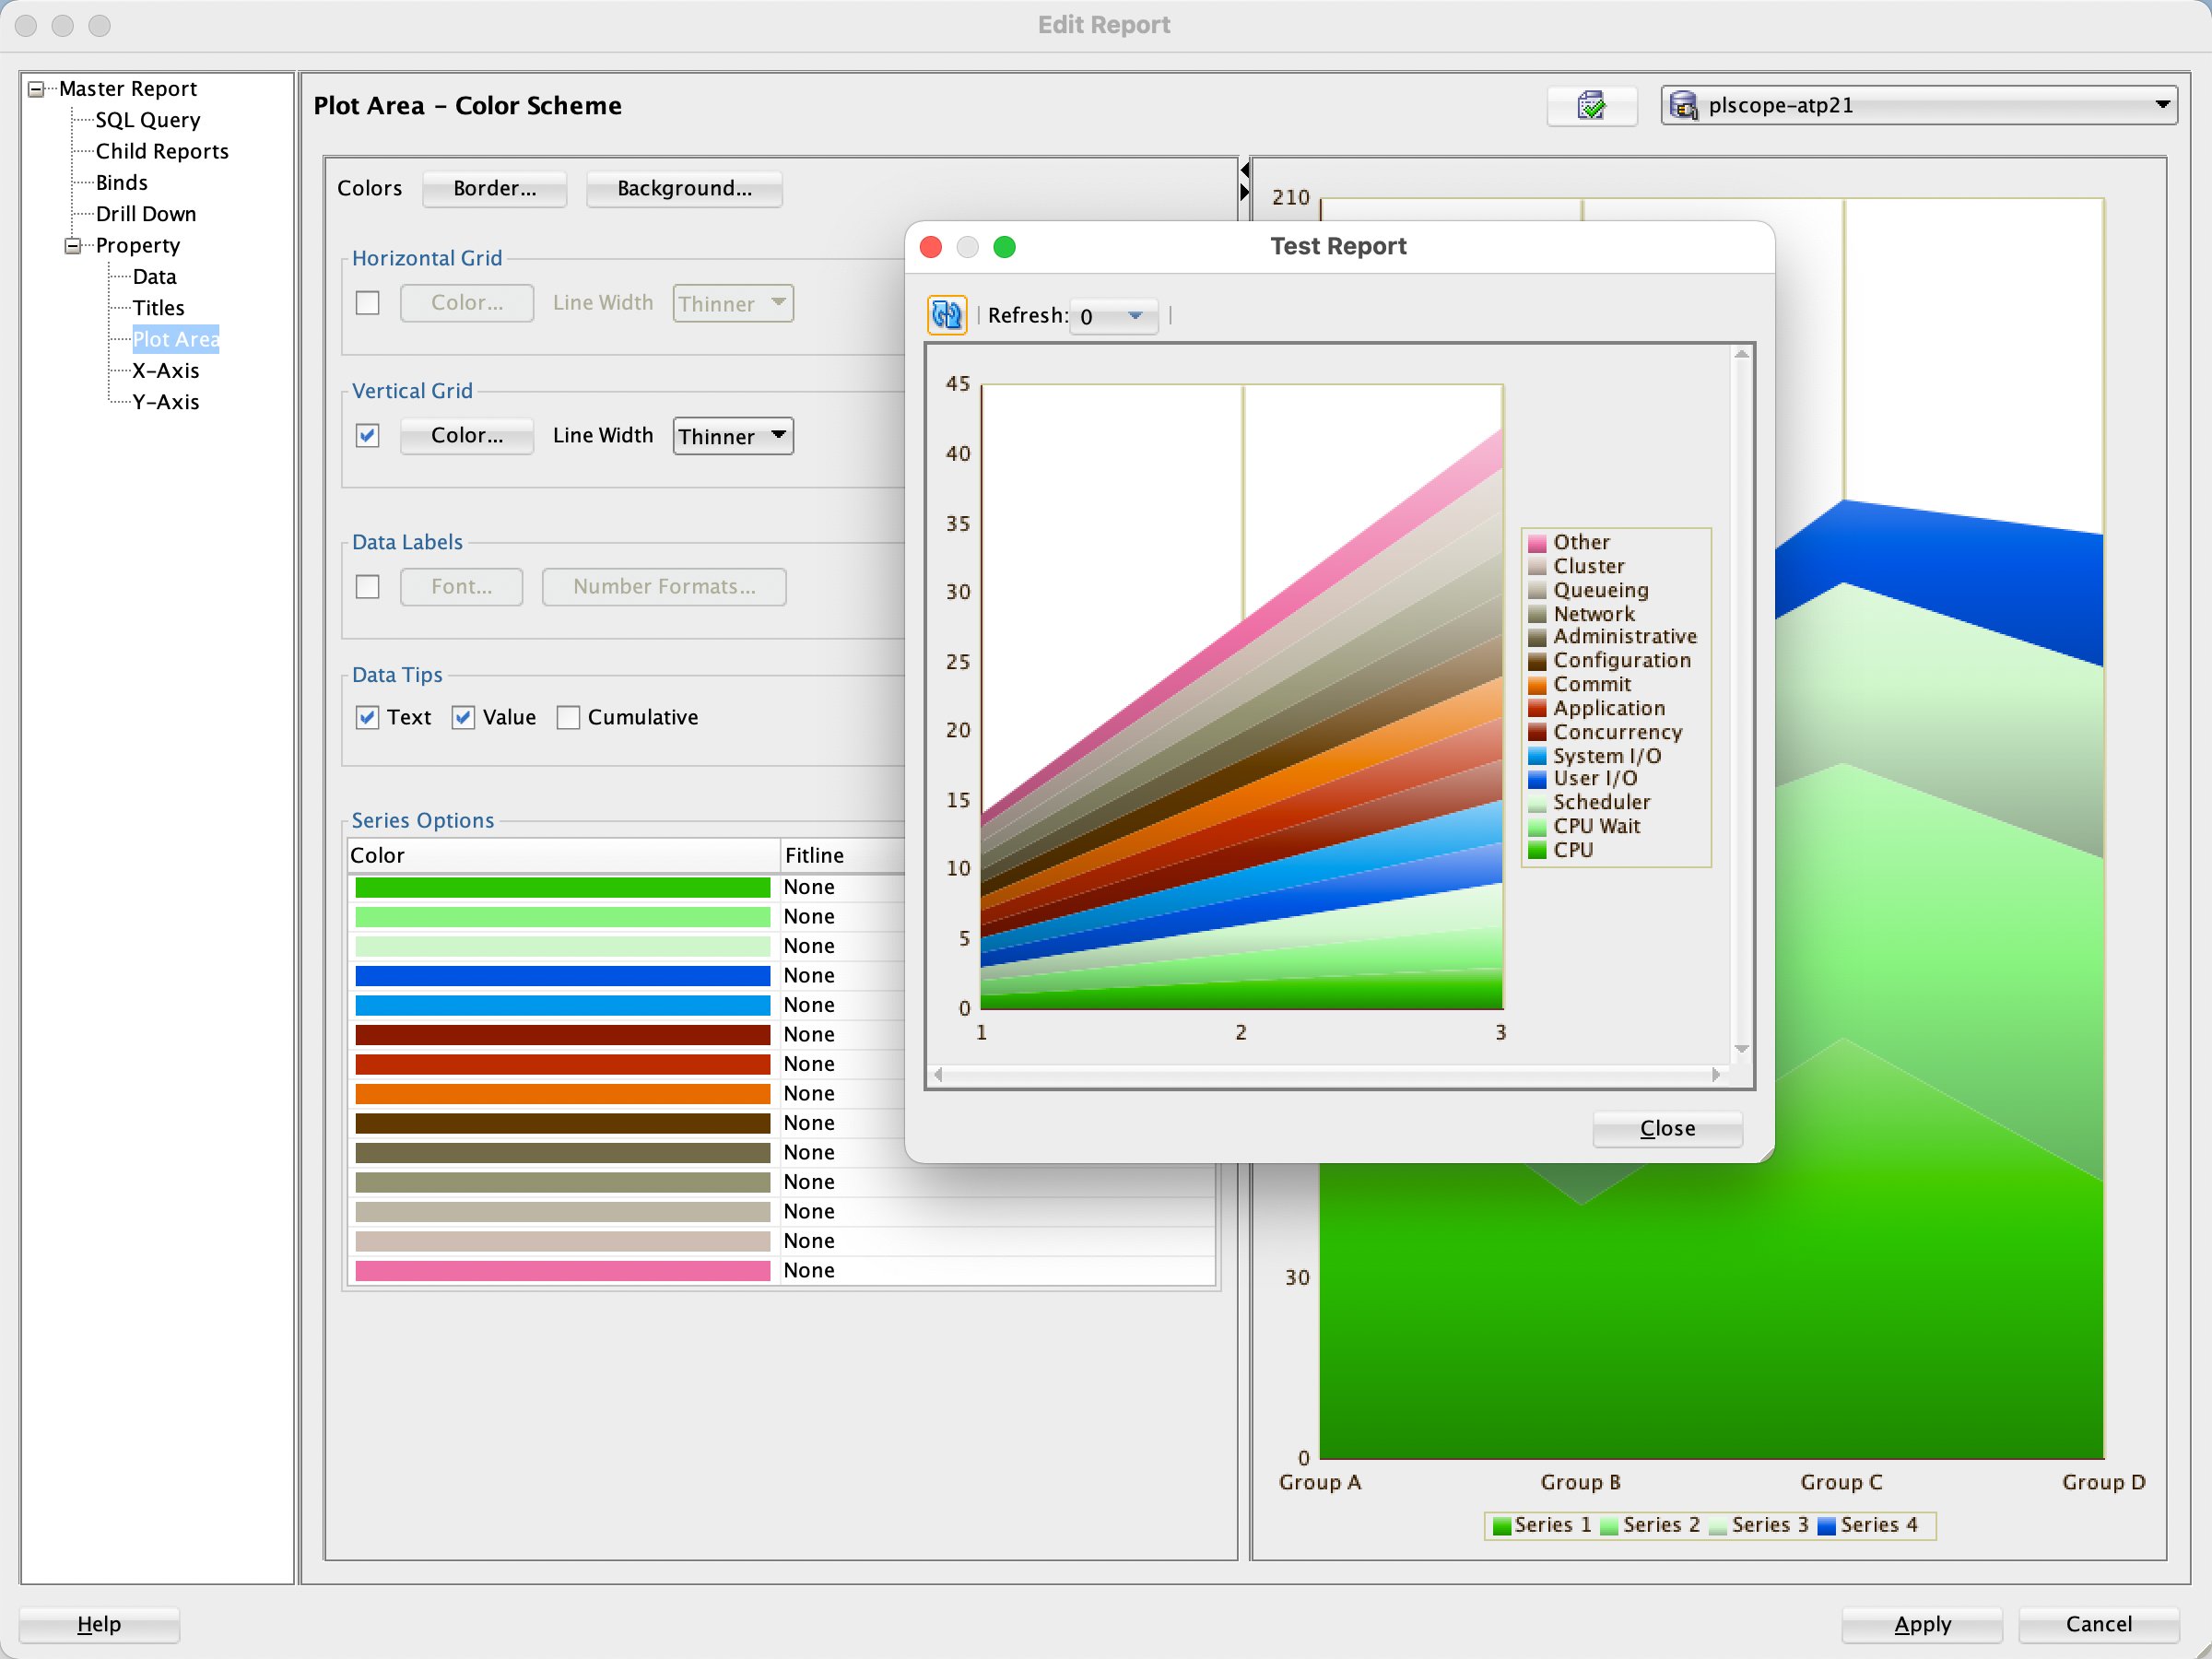
Visualizing ASPWC by Oracle SQL Developer 21.2
Imported the XML file by clicking "open report" that you'll find when right clicking the mouse on the section "User Defined Reports" (showing in Reports tab, you can find "Reports" in the top menu "View") on Oracle SQL Developer 21.2, next I've noticed that the rest 9 number of legend colors of the graph is different from EMCC 13.5 when connecting to my oracle db to check it. Yes, SQL Developer 21.2 has only set the default 5 number of legend colors in the section "Series Options" of Plot Area on the "Edit Report" dialog box. Taking a look at the following 3 screenshots.

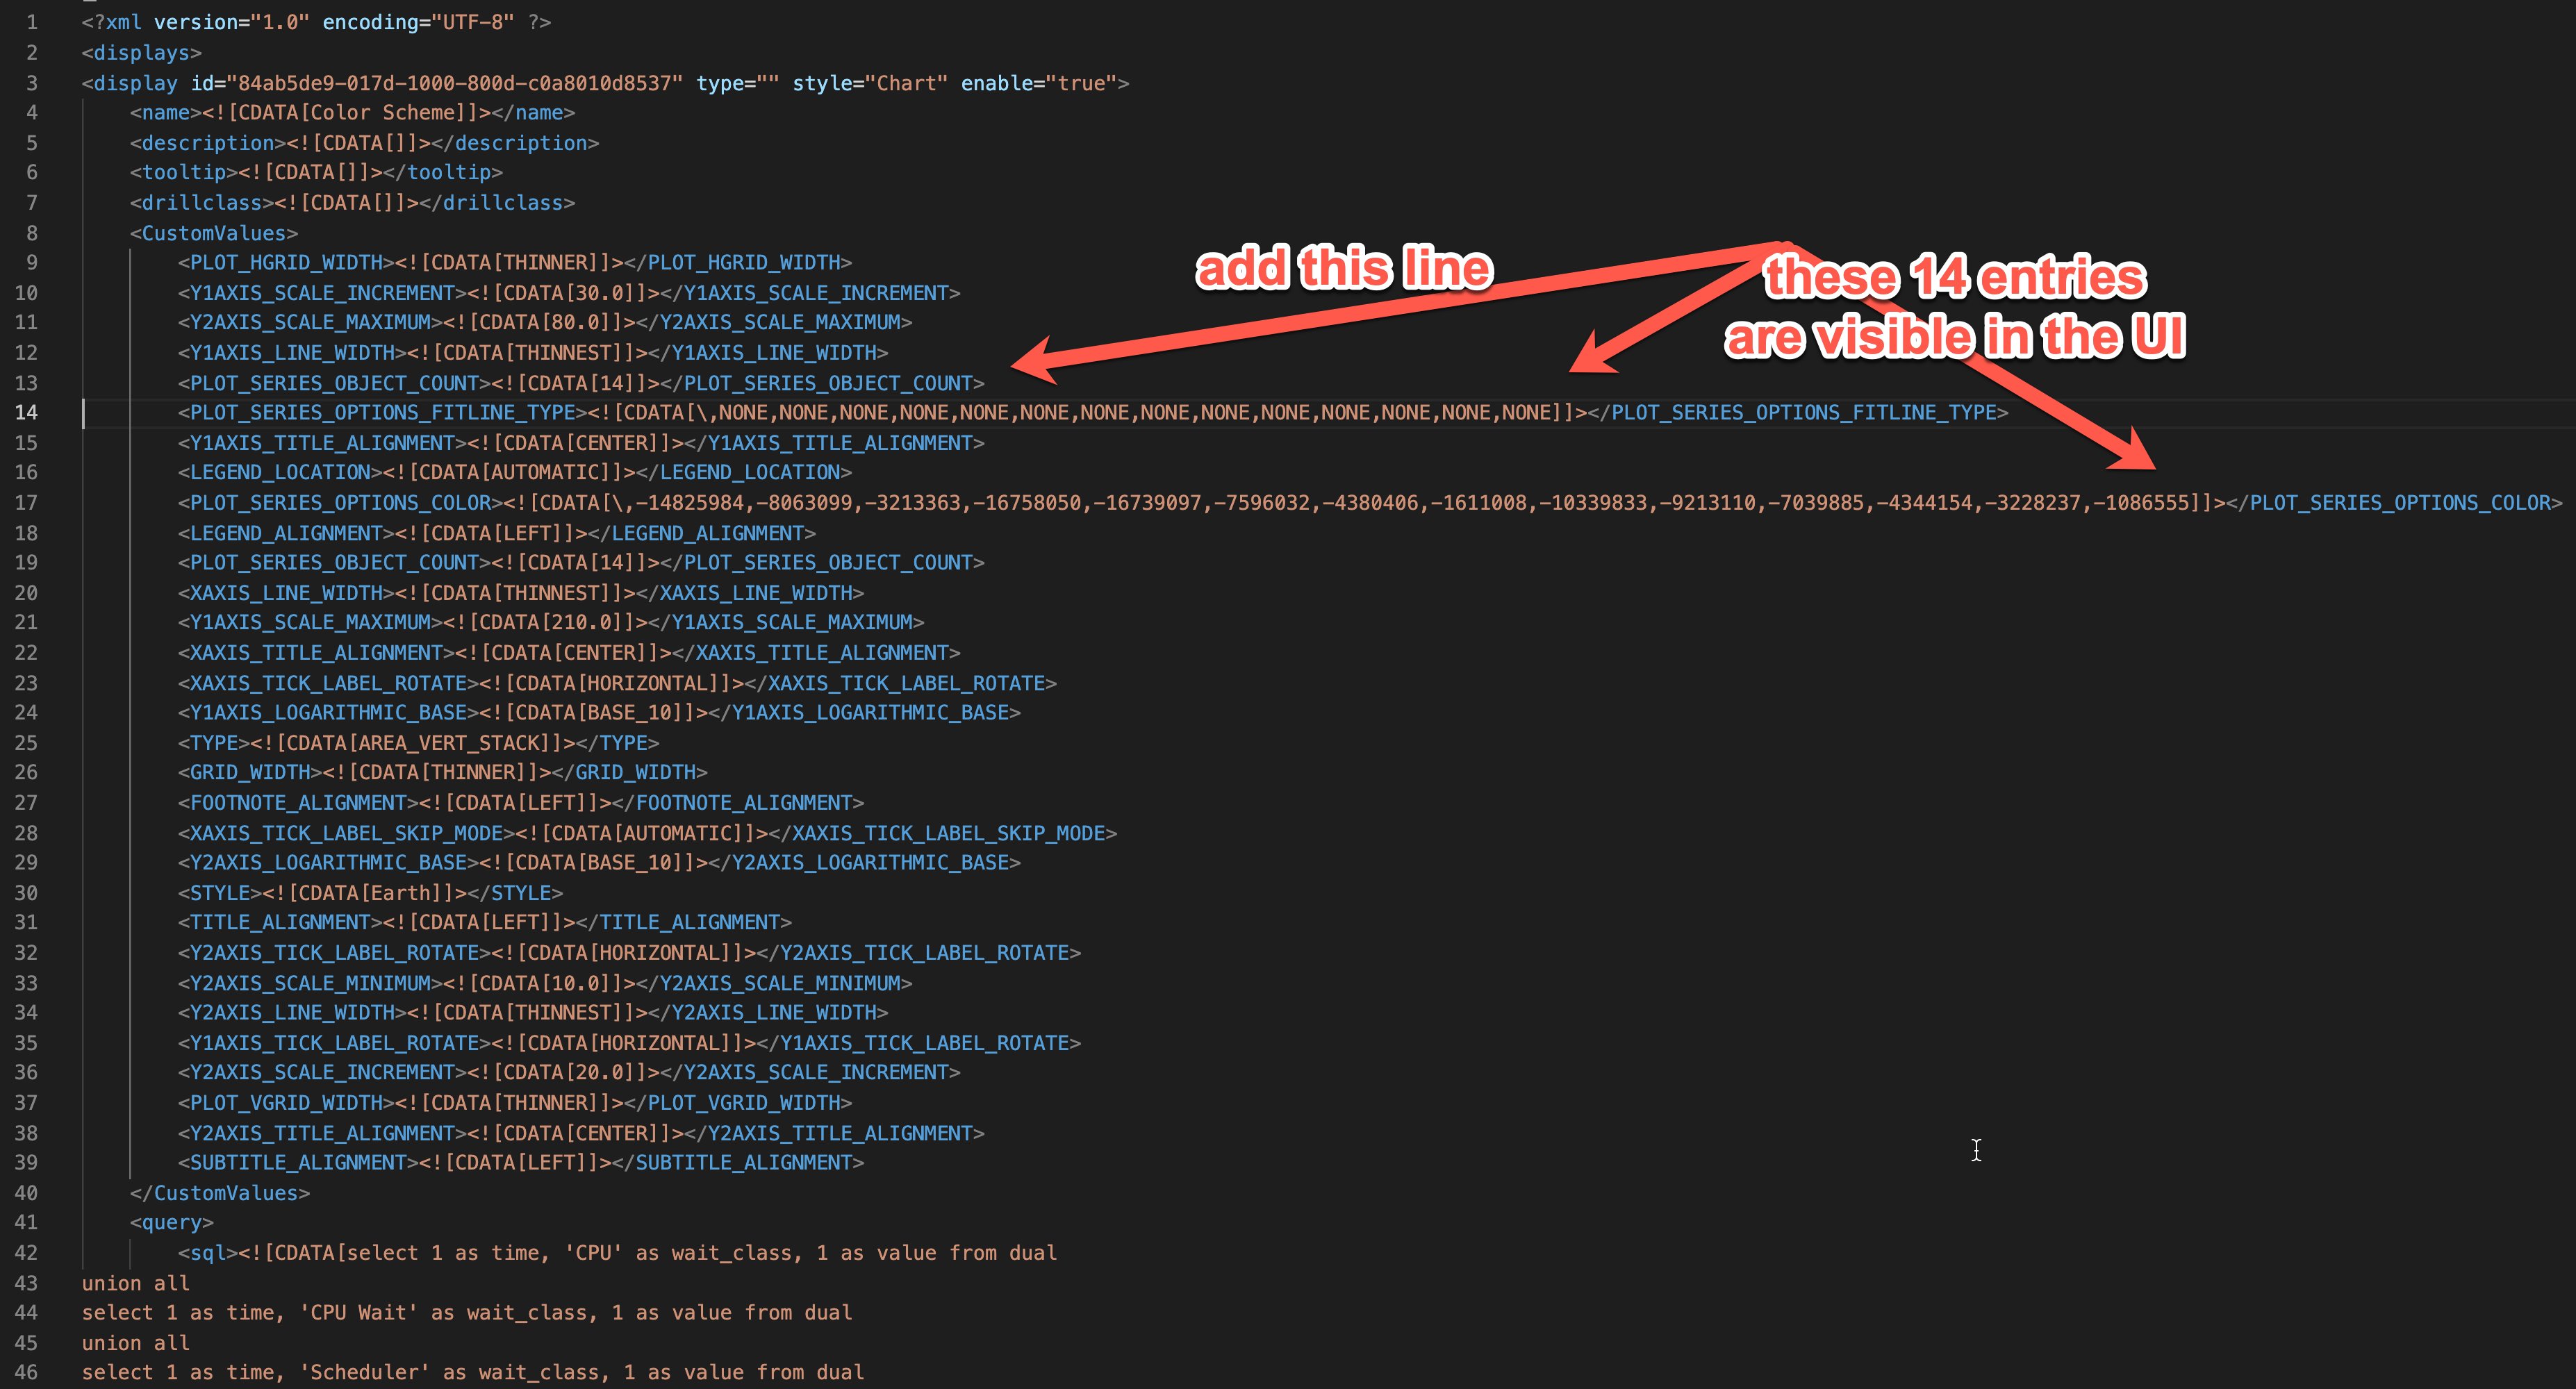
Fortunately Philipp Salvisberg gave me a nice workaround, here I quoted his approach and screenshots as below.
Save the report as XML and amend it according the screenshot. Then open the report from XML. You can change the color scheme in SQLDev for all 14 values. However,
is lost when the report is saved.
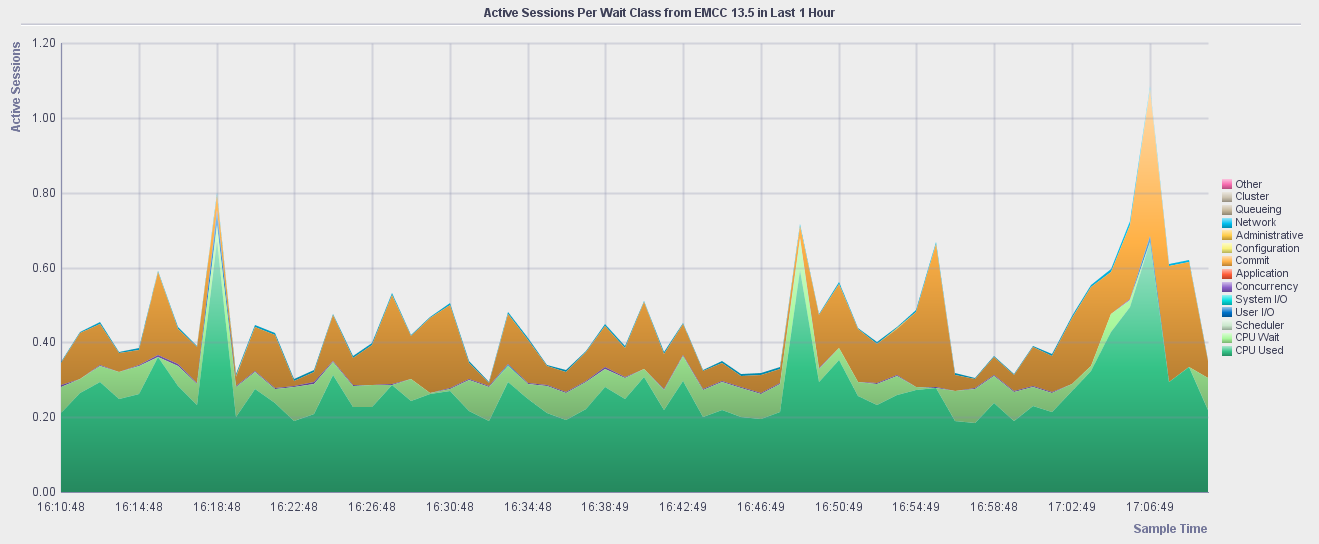
Now we use the previously same steps to import the XML file to "User Defined Reports" of SQL Developer and then recheck the graph. Here's the screenshot.
[Back to ASPWC in last 1 hour]
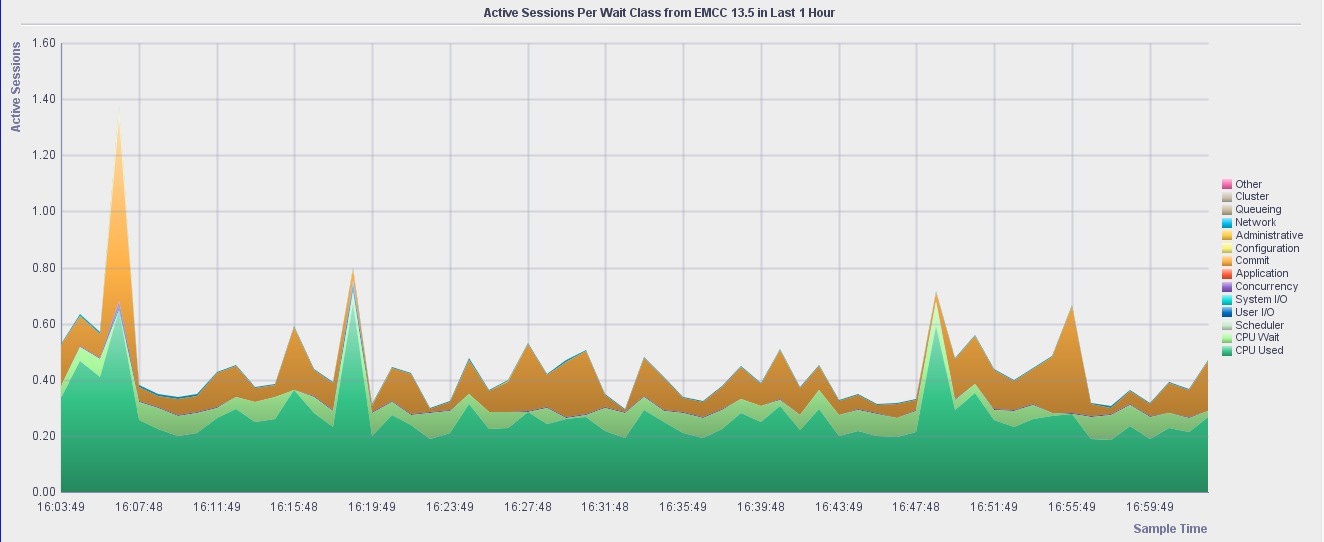
The graph from SQL Developer versus EMCC
Let's compare the graph between SQL Developer and EMCC, here's almost identical result.
[Back to ASPWC in last 1 hour]
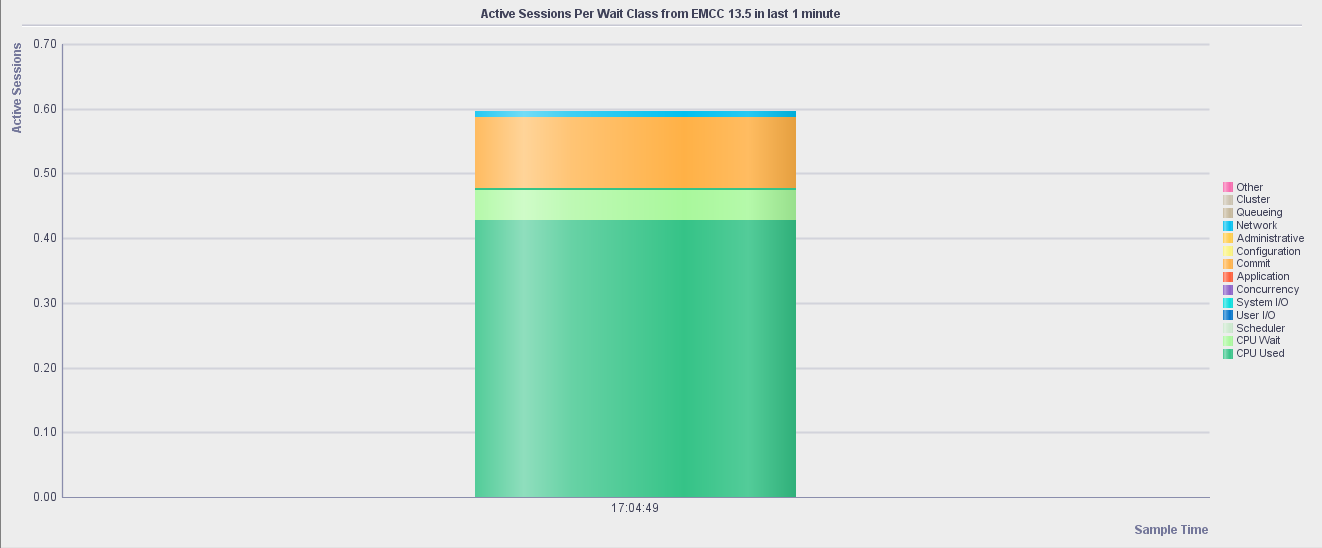
Active Sessions Per Wait Class in last 1 minute
Due to spend plenty of time talking about the final visualizing graph on the preceding section hence I'll use the simple several steps to finish visualizing the graph in this section. We directly import the XML file to "User Defined Reports" of Oracle SQL Developer 21.2, here's the corresponding the graph.
How to acquire the legend colors from EMCC
First of all, we use a screen-capture tool to capture each legend color on the graph "Active Sessions Per Wait Class" from EMCC 13.5, secondly save it to a local file, thirdly uploading this picture to the website that is able to identify the RGB value (it's hexadecimal starting with "#"), fourthly converting "#xxxxxx" to "RGB (xxx, xxx, xxx)" using the website. Ultimately we've gotten the following RGB value.
-- Each Legend Color from the Graph of "Active Sessions Per Wait Class" of EMCC 13.5.
--
-- CPU Used      , #35C387 -> RGB (53 , 195, 135)
-- CPU Wait      , #A9F89C -> RGB (169, 248, 156)
-- Scheduler     , #CBE8CD -> RGB (203, 232, 205)
-- User I/O      , #0072CA -> RGB (0  , 114, 202)
-- System I/O    , #04DEDE -> RGB (4  , 222, 222)
-- Concurrency   , #8B60C9 -> RGB (139, 96 , 201)
-- Application   , #FF5C38 -> RGB (255, 92 , 56 )
-- Commit        , #FFB146 -> RGB (255, 177, 70 )
-- Configuration , #FAF37D -> RGB (250, 243, 125)
-- Administrative, #FFCC48 -> RGB (255, 204, 72 )
-- Network       , #00C0F0 -> RGB (0  , 192, 240)
-- Queueing      , #C5B79B -> RGB (197, 183, 155)
-- Cluster       , #CBC2AF -> RGB (203, 194, 175)
-- Other         , #F76AAE -> RGB (247, 106, 174)
At this very moment all of the content about this blog note has been introduced completely. You can acquire all of source codes from here and here. Any suggestion and opinion is always welcome, don't hesitate to leave your comments in the bottom of comment area. I'll read every message and reply to you as soon as possible.
