


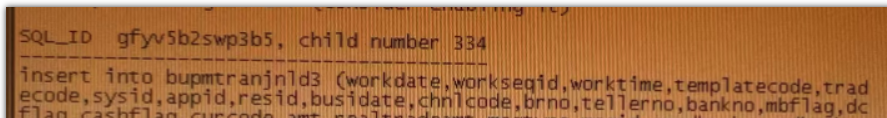
	 接到应用反馈:10点左右数据库insert有卡顿,下面去数据库验证是否有类似卡顿:col SQL_OPNAME for a10
	set linesize  1000
	col SAMPLE_TIME for  a20
	col SQL_ID for  a20
	col event for  a20
	set linesize  10000
	col  sql_opname for a20
	select *
	  from (select *
			  from (select a.*, rownum rn
					  from (select min(to_char(sample_time, 'yyyymmdd hh24:mi:ss')) sample_time,
								   session_id,session_serial#,
								   sql_id,
								   sql_exec_id,
								   sql_opname,
								   inst_id,
								   user_id,
								   sql_plan_hash_value,
								   count(1),
								   round(avg(time_waited / 1000), 0) avg_time_ms,
								   round(max(time_waited / 1000), 0) max_time_ms
							  from gv$active_session_history a
							 where sample_time >=to_date('20250211 10:00:00','yyyymmdd hh24:mi:ss')
							   and sample_time <=to_date('20250211 10:10:00','yyyymmdd hh24:mi:ss')
							  and (SQL_OPNAME ='INSERT')
							 group by session_id,session_serial#,sql_id, sql_exec_id, sql_opname,inst_id,user_id,sql_plan_hash_value
							 order by count(1) desc) a)
			 where rownum <= 16)
	 where rn >= 1;

SAMPLE_TIME          SESSION_ID SESSION_SERIAL# SQL_ID               SQL_EXEC_ID SQL_OPNAME              INST_ID    USER_ID SQL_PLAN_HASH_VALUE   COUNT(1) AVG_TIME_MS MAX_TIME_MS         RN
-------------------- ---------- --------------- -------------------- ----------- -------------------- ---------- ---------- ------------------- ---------- ----------- ----------- ----------
20250211 10:05:46           691           37991 gfyv5b2swp3b5           41837181 INSERT                        2         63                   0         10         157         964          1
20250211 10:05:46          2410           17069 dry6dft649gyf           40508808 INSERT                        2         63                   0          8         184        1298          2
20250211 10:05:46          2146           34319 4ks61k3kmr4k3           33554515 INSERT                        2         63                   0          7         183        1095          3
20250211 10:05:46          1461           59437 5h0dxb2akxyvu           33554520 INSERT                        2         63                   0          6         256        1399          4
20250211 10:05:46           212            5099 8437xg030af9t           40501562 INSERT                        2         63                   0          6         324        1511          5
20250211 10:05:46          3915           58069 cq6xr2v3kak9p           41848481 INSERT                        2         63                   0          6         258        1395          6
20250211 10:05:46           472           15051 agvws654zd9us           41853910 INSERT                        2         63                   0          5         340        1524          7
20250211 10:05:46          1169            3603 c92bck5q6avp4           40505450 INSERT                        2         63                   0          5         262        1219          8
20250211 10:05:46          4438           50537 fwgxaua47vwaa           41850655 INSERT                        2         63                   0          4         359        1383          9
20250211 10:05:46          1733           25347 8437xg030af9t           40501561 INSERT                        2         63                   0          4         390        1486         10
20250211 10:05:46          3916            2465 dry6dft649gyf           40508807 INSERT                        2         63                   0          2         271         360         11
数据库中确实发现在10:05的时候部分insert 执行时间达到10秒,找出两条慢的sql查看下具体都等待哪些等待事件:
col event for a30
col p3 for 99999999999999999999999999
select sql_plan_line_id,sql_plan_hash_value, event,count(1),to_char(min(sample_time),'yyyy-mm-dd hh24:mi:ss') min
   from gv$active_session_history
  where session_id = '691'
    and session_serial# = '37991'
    and sql_id = 'gfyv5b2swp3b5'
   and sql_exec_id = '41837181'
  group by sql_plan_line_id,sql_plan_hash_value, event
  order by count(1);
SQL_PLAN_LINE_ID SQL_PLAN_HASH_VALUE EVENT                            COUNT(1) MIN
---------------- ------------------- ------------------------------ ---------- ---------------------------------------------------------
                                   0 latch: row cache objects                1 2025-02-11 10:05:47
                                   0 enq: US - contention                    9 2025-02-11 10:05:46

    该sql 一共执行了10秒,其中 “latch: row cache objects” 1秒,“enq: US - contention” 9秒

col event for a30
col p3 for 99999999999999999999999999
select sql_plan_line_id,sql_plan_hash_value, event,count(1),to_char(min(sample_time),'yyyy-mm-dd hh24:mi:ss') min
   from gv$active_session_history
  where session_id = '2410'
    and session_serial# = '17069'
    and sql_id = 'dry6dft649gyf'
   and sql_exec_id = '40508808'
  group by sql_plan_line_id,sql_plan_hash_value, event
  order by count(1);

SQL_PLAN_LINE_ID SQL_PLAN_HASH_VALUE EVENT                            COUNT(1) MIN
---------------- ------------------- ------------------------------ ---------- ---------------------------------------------------------
                                   0 latch: row cache objects                1 2025-02-11 10:05:48
                                   0 enq: US - contention                    7 2025-02-11 10:05:46
该sql 一共执行了8秒,其中 “latch: row cache objects” 1秒,“enq: US - contention” 7秒
又找了其他sql 发现都是等待 “latch: row cache objects”和 "enq: US - contention”,第一感觉是undo空间不够导致,火速查看发现undo使用率才20%左右,那不是undo空间不够导致
以第一个sql 会突破口,想查看下这个sql 被谁阻塞了?
-- 超找阻塞源:
col SQL_OPNAME for a10
set linesize  1000
col SAMPLE_TIME for  a20
col SQL_ID for  a20
col event for  a40
col BLOCKING_ID  for  a40
select  inst_id,min(to_char(sample_time, 'yyyymmdd hh24:mi:ss')) sample_time,sql_id,event,blocking_inst_id || '_' || blocking_session  blocking_id,count(1)
  from  gv$active_session_history a
							 where sample_time >=to_date('20250211 10:00:00','yyyymmdd hh24:mi:ss')
							   and sample_time <=to_date('20250211 10:10:00','yyyymmdd hh24:mi:ss')
      and  session_id = '691'
   and session_serial# = '37991'
    and sql_id = 'gfyv5b2swp3b5'
  and sql_exec_id = '41837181'
   group by  inst_id,sql_id,event,blocking_inst_id || '_' || blocking_session
   order by 2 ;
INST_ID SAMPLE_TIME SQL_ID EVENT BLOCKING_ID COUNT(1)
---------- -------------------- -------------------- ---------------------------------------- ---------------------------------------- ----------
2 20250211 10:05:46 gfyv5b2swp3b5 enq: US - contention 2_2159 1
2 20250211 10:05:47 gfyv5b2swp3b5 latch: row cache objects 2_966 1
2 20250211 10:05:48 gfyv5b2swp3b5 enq: US - contention 2_55 1
2 20250211 10:05:49 gfyv5b2swp3b5 enq: US - contention 2_4059 1
2 20250211 10:05:50 gfyv5b2swp3b5 enq: US - contention 2_1633 1
2 20250211 10:05:51 gfyv5b2swp3b5 enq: US - contention 2_2048 1
2 20250211 10:05:52 gfyv5b2swp3b5 enq: US - contention 2_4163 1
2 20250211 10:05:53 gfyv5b2swp3b5 enq: US - contention _ 1
2 20250211 10:05:54 gfyv5b2swp3b5 enq: US - contention 2_3435 1
2 20250211 10:05:55 gfyv5b2swp3b5 enq: US - contention 2_419 1 发现阻塞的会话每次都不一样,懵,尝试查看阻塞源正在执行的sql和event:
col SQL_OPNAME for a10
set linesize  1000
col SAMPLE_TIME for  a20
col SQL_ID for  a20
col event for  a40
col BLOCKING_ID  for  a40
select  to_char(sample_time,'hh24:mi:ss') sample_time,sql_id,event,sql_opname,CURRENT_OBJ#,CURRENT_FILE# , CURRENT_BLOCK#,blocking_inst_id || '_' || blocking_session  blocking_id,p2
  from gv$active_session_history a
							 where sample_time >=to_date('20250211 10:00:00','yyyymmdd hh24:mi:ss')
							   and sample_time <=to_date('20250211 10:10:00','yyyymmdd hh24:mi:ss')
and inst_id || '_' || session_id='2_4163'10:05:55 88urhcjtjykwd enq: TX - contention SELECT 4284682 148 1279487 _ 31
10:05:54 88urhcjtjykwd enq: TS - contention SELECT -1 0 0 _ 4
10:05:52 88urhcjtjykwd enq: TX - contention SELECT -1 0 0 _ 10:05:52 88urhcjtjykwd select 阻塞了一秒 insert --gfyv5b2swp3b5。这里有点说不通了,select理论上不应该导致insert呀。怀疑两个sql 操作的同一张表:

对比发现,这2个sql 操作的是完全独立的两张表,sql 2的select 是通过dblink完成的。完全独立的两张表,表2的select 为啥会影响表1的insert了?又懵了
根据上面的思路去查找影响了8秒的阻塞源:
col SQL_OPNAME for a10
set linesize  1000
col SAMPLE_TIME for  a20
col SQL_ID for  a20
col event for  a40
col BLOCKING_ID  for  a40
select  inst_id,min(to_char(sample_time, 'yyyymmdd hh24:mi:ss')) sample_time,sql_id,event,blocking_inst_id || '_' || blocking_session  blocking_id,count(1)
  from  gv$active_session_history a
							 where sample_time >=to_date('20250211 10:00:00','yyyymmdd hh24:mi:ss')
							   and sample_time <=to_date('20250211 10:10:00','yyyymmdd hh24:mi:ss')
      and  session_id = '2410'
   and session_serial# = '17069'
    and sql_id = 'dry6dft649gyf'
  and sql_exec_id = '40508808'
   group by  inst_id,sql_id,event,blocking_inst_id || '_' || blocking_session
   order by 2 ;

   INST_ID SAMPLE_TIME          SQL_ID               EVENT                                    BLOCKING_ID                                COUNT(1)
---------- -------------------- -------------------- ---------------------------------------- ---------------------------------------- ----------
         2 20250211 10:05:46    dry6dft649gyf        enq: US - contention                     2_486                                             2
         2 20250211 10:05:48    dry6dft649gyf        latch: row cache objects                 2_1318                                            1
         2 20250211 10:05:49    dry6dft649gyf        enq: US - contention                     2_4169                                            1
         2 20250211 10:05:50    dry6dft649gyf        enq: US - contention                     _                                                 2
         2 20250211 10:05:51    dry6dft649gyf        enq: US - contention                     2_2048                                            1
         2 20250211 10:05:52    dry6dft649gyf        enq: US - contention                     2_1271                                            1
select to_char(sample_time,'hh24:mi:ss') sample_time,sql_id,event,sql_opname,CURRENT_OBJ#,CURRENT_FILE# , CURRENT_BLOCK#,blocking_inst_id || '_' || blocking_session blocking_id,p2
from gv$active_session_history a
where sample_time >=to_date('20250211 10:00:00','yyyymmdd hh24:mi:ss')
and sample_time <=to_date('20250211 10:10:00','yyyymmdd hh24:mi:ss')
and inst_id || '_' || session_id = '2_2048'
order by 1;
10:05:51 88urhcjtjykwd enq: TX - contention SELECT -1 0 0 _ 又是dblink的 select,dblink 的select 影响了非同一张表的insert。从目前的得到如下结论:同一个dblink的 select 影响了不同表的insert,insert等待事件是“enq: US - contention” 和“latch: row cache objects”
去收费群咨询专家发现:dblink 的select会产生一个隐性的事务,这下就解释得通了,dblink的select产生的事务 影响了库的全局事务,那应该还是undo出问题了。
继续从等待事件“enq: US - contention”查找线索
查看mos发现:High US - contention enqueue , latch: row cache objects and rowcache locks may be seen while trying to online a new undo segment
US产生的原因是online undo段不足导致,查看数据库发现该隐含参数未配置:
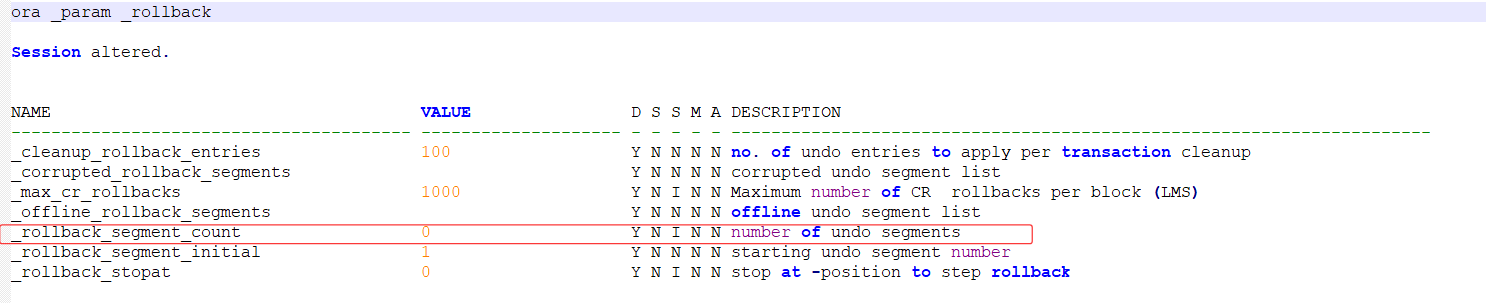
select count(1) from dba_rollback_segs where status='ONLINE' and instance_num =1;
通过以上sql查看目前数据库的回滚段online数是201,针对高并发环境这个值确实有点小
解决办法:
alter system set "_rollback_segment_count"=2000 sid='*';
修改后问题解决
