


应用反馈有交易超时,查看数据库发现慢的很夸张:
	col SQL_OPNAME for a10
	set linesize  1000
	col SAMPLE_TIME for  a20
	col SQL_ID for  a20
	col event for  a20
	set linesize  10000
	col  sql_opname for a20
	select *
	  from (select *
			  from (select a.*, rownum rn
					  from (select min(to_char(sample_time, 'yyyymmdd hh24:mi:ss')) sample_time,
								   session_id,session_serial#,
								   sql_id,
								   sql_exec_id,
								   sql_opname,
								   inst_id,
								   user_id,
								   sql_plan_hash_value,
								   count(1),
								   round(avg(time_waited / 1000), 0) avg_time_ms,
								   round(max(time_waited / 1000), 0) max_time_ms
							  from gv$active_session_history a
							 where sample_time >=to_date('20250212 09:30:00','yyyymmdd hh24:mi:ss')
							   and sample_time <=to_date('20250212 09:40:00','yyyymmdd hh24:mi:ss')
							   and (SQL_OPNAME ='INSERT' OR SQL_OPNAME='UPDATE')
							 group by session_id,session_serial#,sql_id, sql_exec_id, sql_opname,inst_id,user_id,sql_plan_hash_value
							 order by count(1) desc) a)
			 where rownum <= 50)
	 where rn >= 1;
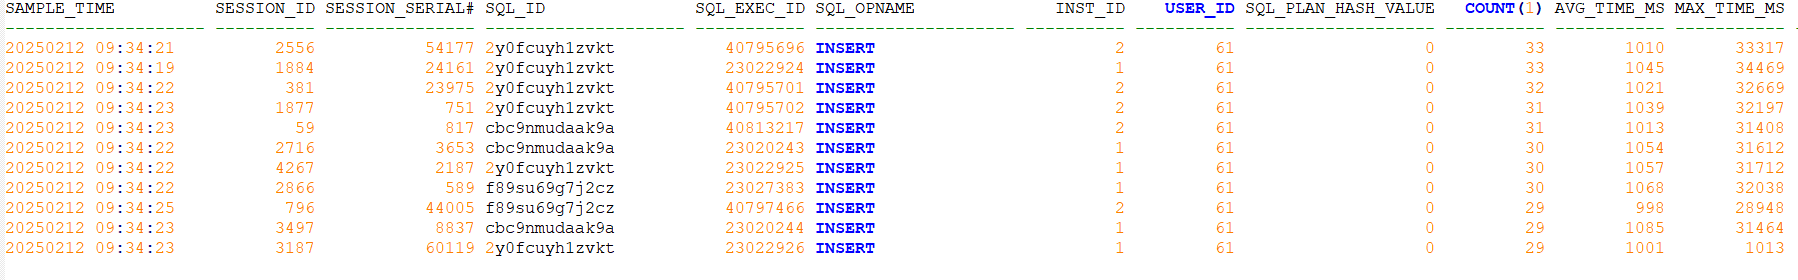
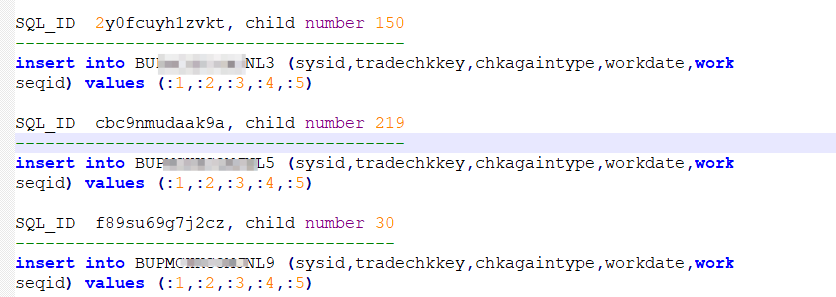
很普通的insert,一次insert一条记录,耗时最长的达到了33秒
尝试去查询阻塞源:
col SQL_OPNAME for a10
set linesize  1000
col SAMPLE_TIME for  a20
col SQL_ID for  a20
col event for  a40
col BLOCKING_ID  for  a40
select  inst_id,min(to_char(sample_time, 'yyyymmdd hh24:mi:ss')) sample_time,sql_id,event,blocking_inst_id || '_' || blocking_session  blocking_id,count(1)
          from gv$active_session_history
							 where sample_time >=to_date('20250212 09:30:00','yyyymmdd hh24:mi:ss')
							   and sample_time <=to_date('20250212 09:40:00','yyyymmdd hh24:mi:ss')
      and  session_id = '2556'
   and session_serial# = '54177'
    and sql_id = '2y0fcuyh1zvkt'
  and sql_exec_id = '40795696'
   group by  inst_id,sql_id,event,blocking_inst_id || '_' || blocking_session
   order by 2 ;
没人影响它,又查了其他insert,都是依旧,执行慢,等待事件是gc buffer busy release,没阻塞源。这样的话insert 慢只能是库本身卡了
查看节点1的awr报告:
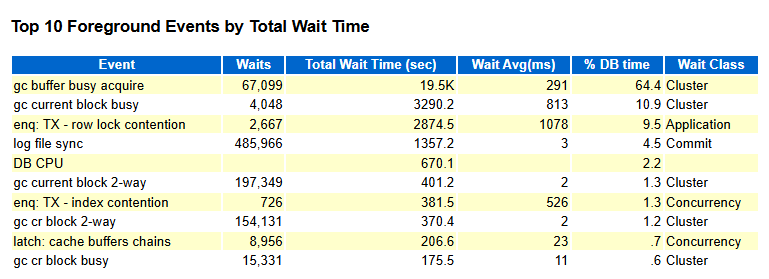
gc确实很厉害,还有行锁,其他正常
查看节点2的awr报告:
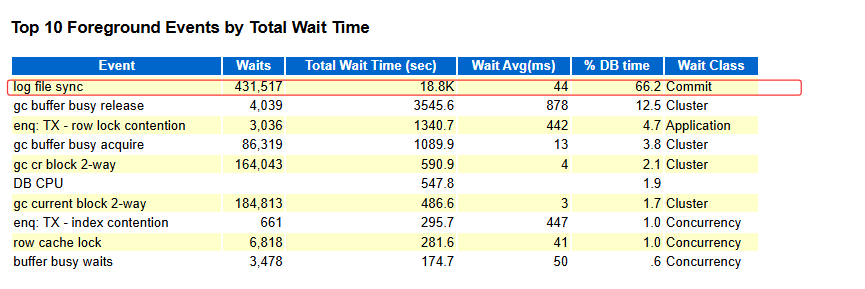
节点2的log file sync 有很明显的异常,怀疑是日志落盘慢,去ash里查看:
--查看io情况
col session_id for a20
col event for a40
select to_char(min(sample_time), 'yyyymmdd hh24:mi:ss') sample_time,
       inst_id || '_' || session_id session_id,
       event,
       count(1),
       round(avg(time_waited / 1000), 0) avg_time_ms,
       round(max(time_waited / 1000), 0) max_time_ms,
       seq#,
       blocking_inst_id || '_' || blocking_session blocking_id
  from gv$active_session_history
  							 where sample_time >=to_date('20250212 09:30:00','yyyymmdd hh24:mi:ss')
							   and sample_time <=to_date('20250212 09:36:00','yyyymmdd hh24:mi:ss')
                      AND  event like '%log file parallel write%'
 group by seq#,
          event,
          inst_id || '_' || session_id,
          blocking_inst_id || '_' || blocking_session
order by sample_time; 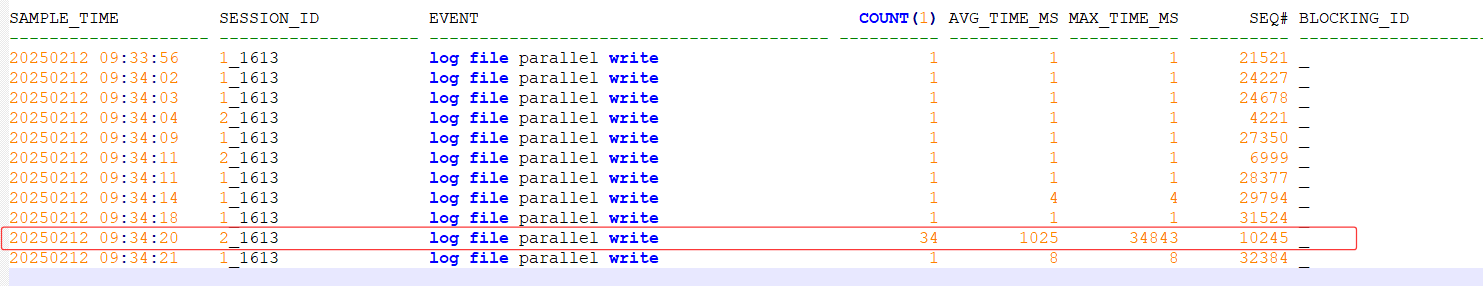
可以看到在9点34:20秒的时候 log file parallel write 达到了34秒,这个绝对是不正常的。又去查看了下lgwr的trc发现:
*** 2025-02-12 09:34:54.130
Warning: log write elapsed time 34843ms, size 1KB
顺序写入1KB 日志文件花费了34秒,很夸张吧。
那为啥日志落盘慢会影响到gc了?
查找资料发现:

logfile parallel write 慢会造成gc 的原因:
在rac环境中rac flush redo会受到写redo慢的影响,从而出现gc buffer busy release/acquire。
redo flush是Oracle为了保证Instance Recovery实例恢复机制,而要求每一个current block在本地节点local instance被修改后,必须要将该current block相关的redo 写入到logfile 后(要求LGWR必须完成写入后才能返回),
才能由LMS进程传输给其他节点使用。RAC 的Redo
flush慢造成gc buffer busy release/acquire等待
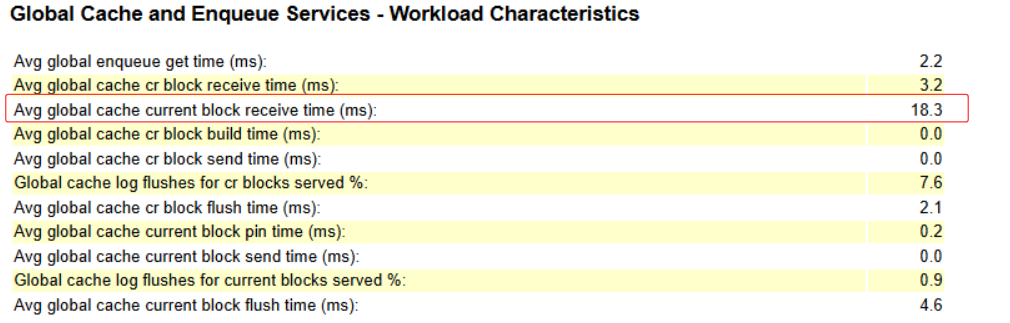
再回头查看awr,对比两节点的RAC Statistics 信息:
节点1:
节点2:
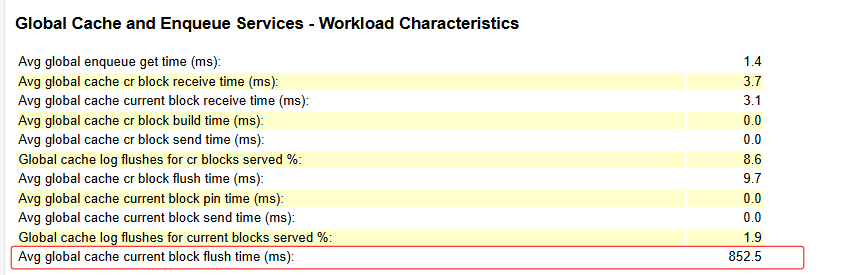
节点2的global cache current block flush time 是节点1的200多倍
把日志落盘慢反馈给存储同事,通过排查发现存储有个模块有问题导致其中一条链路异常,更换模块后问题解决
