


说明:经评论区大佬指点,prometheus能使用原生的mysqld_exporter监控到MySQL MGR,
参考文档:
https://cloud.tencent.com/document/product/1416/111841
https://segmentfault.com/a/1190000044009032
自定义exporter的原文如下:
prometheus无法使用原生的mysqld_exporter监控到MySQL MGR,因此可以手动编写一个exporter来实现。
另外percona的PMM可原生监控MGR,如果没有非要统一使用prometheus的要求,也可以单独使用PMM监控,此处不做介绍。
手动编写exporter来实现MGR的监控过程如下。
安装python3环境
被采集的MySQL节点是redhat7.8,所以手动安装python3环境:
sudo yum install python3
注意要3.7以上的版本。
由于是内网环境,需要我们手动配置pypi源。
编辑如下文件,如果没有则手动创建:
mkdir ~/.pip
vim ~/.pip/pip.conf
添加如下内容:
[global]
index-url = https://mirrors.hxxxxn.com/repository/Pypi/simple/

[install]
trusted-host=mirrors.hxxxxn.com
随便安装一个包来验证:
pip3 install requests
安装所需要的包
所需要的包如下:
prometheus-client
mysql-connector-python
PYyaml
使用pypi安装:
pip3 install prometheus-client
pip3 install protobuf
pip3 install mysql-connector-python
pip3 install PYyaml
注:如果是编译安装的则命令可以用pip3.7 install。
编写配置文件
创建并编辑MySQL配置文件:
mkdir /app/exporter
vim /app/exporter/mysql_instances_config.yml
写入被监控节点信息:
    mysql_instances:
      - host: '10.0.19.127'
        port: 3306
      - host: '10.0.19.126'
        port: 3306

    mysql_credentials:
      user: 'exporter'
      password: '123456'
编写exporter程序
创建并编辑exporter程序文件:
vim /app/exporter/exporter_mysqlmgr1.py
以监控mgr节点状态为例,示例代码如下:
from prometheus_client import start_http_server, Gauge
import mysql.connector
import time
import yaml


# 定义读取配置文件的函数
def load_config(file_path):
    with open(file_path, 'r') as file:
        configfile = yaml.safe_load(file)
    return configfile


# 从配置文件加载MySQL实例和凭据
config = load_config('/app/exporter/mysql_instances_config.yml')
mysql_instances = [(item['host'], item['port']) for item in config['mysql_instances']]
mysql_user = config['mysql_credentials']['user']
mysql_password = config['mysql_credentials']['password']


# 定义指标replication_group_status
replication_group_status = Gauge(
    'replication_group_status',
    'Status of MySQL Group Replication',
    ['member_host']
)


def collect_metrics():
    for host, port in mysql_instances:
        configmysql = {
            'user': mysql_user,
            'password': mysql_password,
            'host': host,
            'port': port,
            'database': 'performance_schema',
        }

        try:
            conn = mysql.connector.connect(**configmysql)  # 使用 `mysql.connector.connect`
            cursor = conn.cursor()
            cursor.execute(
                "SELECT MEMBER_HOST, MEMBER_STATE FROM performance_schema.replication_group_members")
            rows = cursor.fetchall()

            # 更新 Prometheus 指标
            for row in rows:
                member_host, member_state = row
                status_value = 1 if member_state == 'ONLINE' else 0
                replication_group_status.labels(member_host=member_host).set(status_value)

            cursor.close()
            conn.close()
        except mysql.connector.Error as err:
            print(f"Error connecting to MySQL instance {host}:{port} - {err}")


if __name__ == '__main__':
    start_http_server(9106)  # 启动 HTTP 服务,区别默认暴露的9104端口
    while True:
        collect_metrics()  # 定期收集指标
        time.sleep(30)  # 每 30 秒收集一次
后台运行
后台运行exporter程序,日志见output.log
nohup python3.7 /app/exporter/exporter_mysqlmgr1.py > output.log 2>&1 &
检查端口:
netstat -tnulp
如果需要systemctl启动可以参考网上的方法,这里不做介绍。
网页访问:
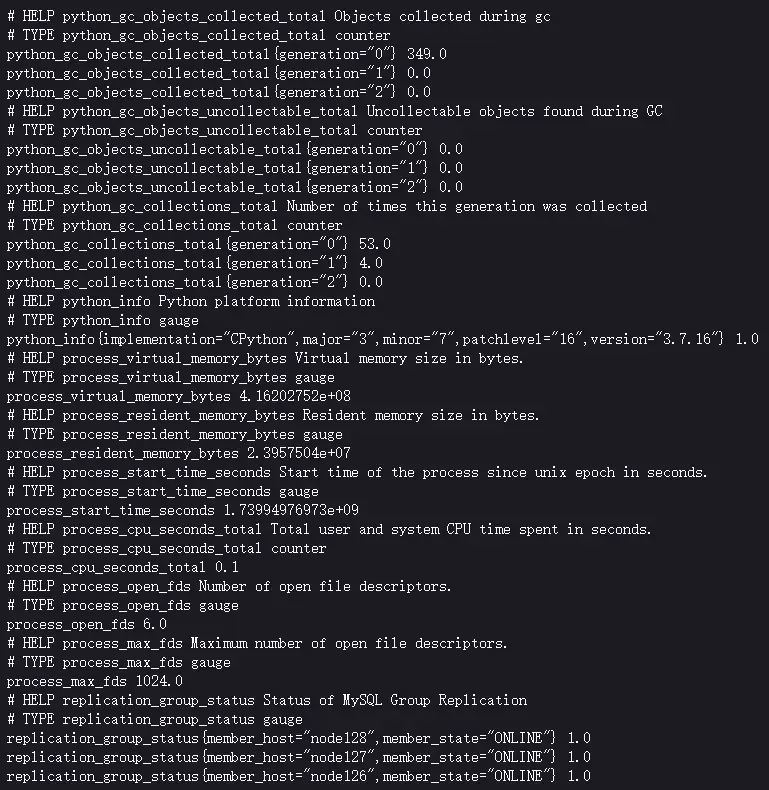
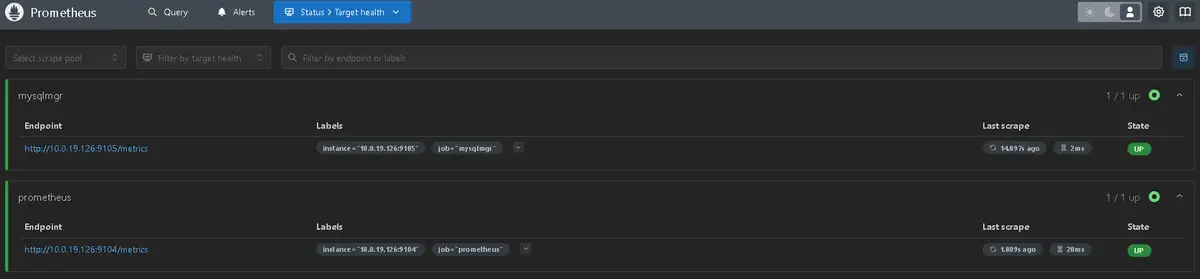
配置prometheus
在prometheus的yml文件末尾添加如下内容:
  - job_name: "mysqlmgr3"
    static_configs:
      - targets: ["10.0.19.126:9106"]
注意yml文件格式,如果未与上方内容对齐则会出问题。
然后重启prometheus后,网页显示:
grafana面板配置
参考下图:
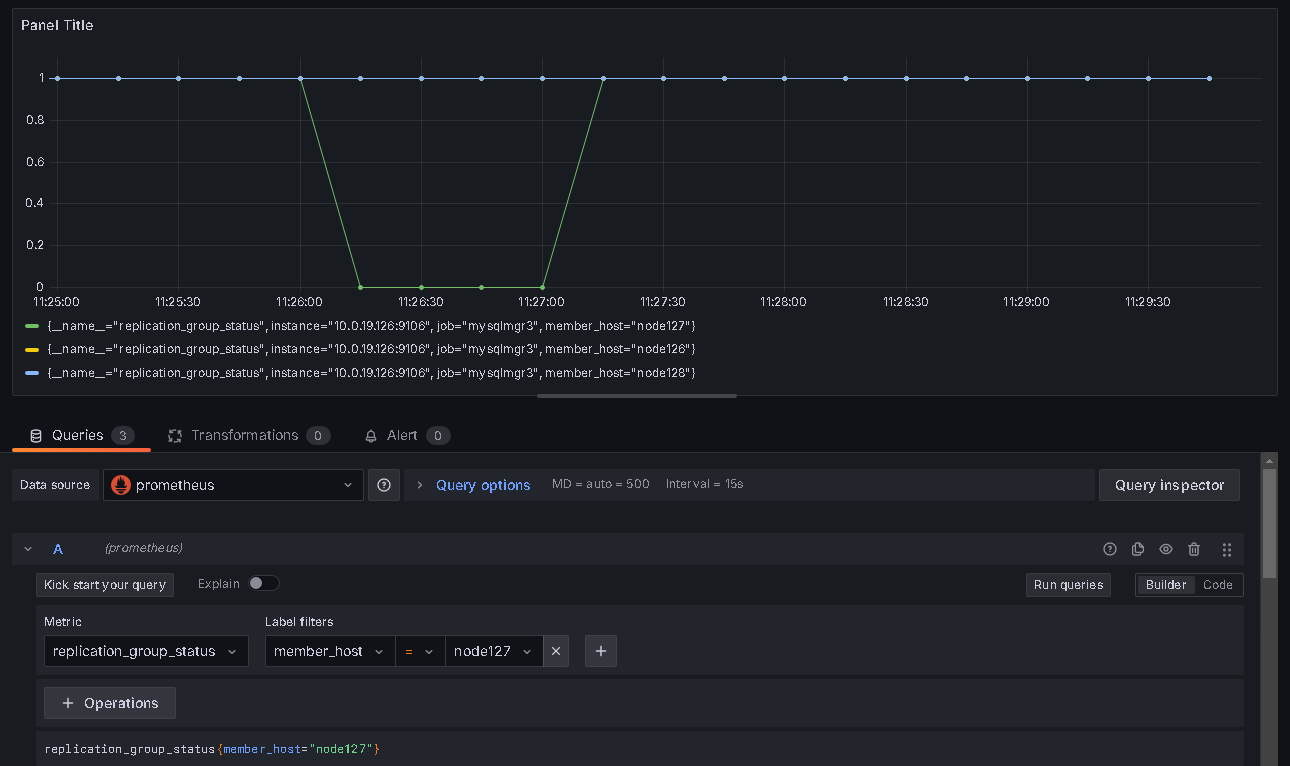
指标名字为 replication_group_status,当状态为 ONLINE 时 value 为1,否则为 0。
参考:
https://blog.csdn.net/weixin_59526725/article/details/141425630
最后修改时间:2025-03-06 10:04:20
「喜欢这篇文章,您的关注和赞赏是给作者最好的鼓励」
关注作者
【版权声明】本文为墨天轮用户原创内容,转载时必须标注文章的来源(墨天轮),文章链接,文章作者等基本信息,否则作者和墨天轮有权追究责任。如果您发现墨天轮中有涉嫌抄袭或者侵权的内容,欢迎发送邮件至:contact@modb.pro进行举报,并提供相关证据,一经查实,墨天轮将立刻删除相关内容。
