


测试数据准备
create table person_data(name string comment '姓名',sex string comment '性别',age int comment'年龄',year_income decimal(15,2) comment '年收入')comment '分布测试数据'ROW FORMAT DELIMITED FIELDS TERMINATED BY ','stored as textfile;
数据准备:
张三,男,24,100000丽丽,女,20,50000王五,男,38,200000阿姨,女,40,500000王麻子,男,25,150000李四,男,45,300000
加载数据:
load data local inpath '/home/bigdata/testdata/person.csv' overwrite into table person_data;
需求和输出表结构
性别分布,(男/女)年龄段分布 (1-20],(20-30],(30,40],(40,60],60以上年收入段分布 (0-10万],(10-30万],(30-50万],50万以上
输出表结构:
create table distributed_data(distributed_type string comment '分布项类型',distributed_item string comment '分布项名称',distributed_num int comment '分布项数量',distributed_num_rate decimal(15,2) comment '分布项所占比率',distributed_amount decimal(15,2) comment '分布项内的年收入',distributed_amount_rate decimal(15,2) comment '分布项内的年收入所占比率')comment '分布项结果数据'stored as textfile;
写法一
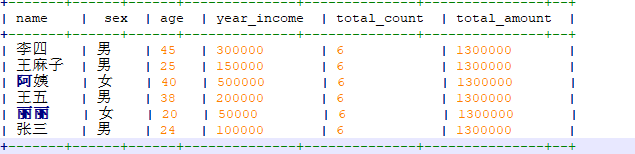
1 首先为每行数据通过开窗函数增加总记录数和总金额列:
selectname,sex,age,year_income,count(name)over(partition by 1 ) as total_count,sum(year_income)over(partition by 1 ) as total_amountfrom person_data
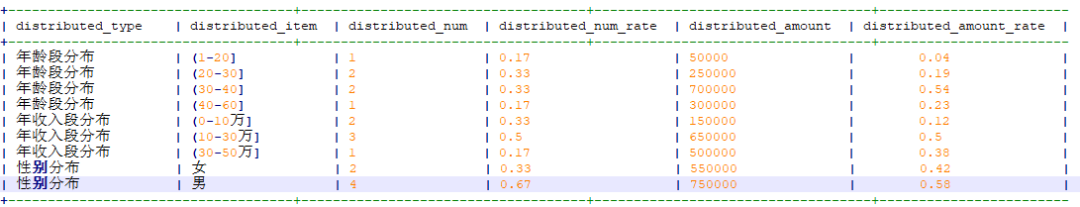
2 分成多个部分分别统计性别、年龄等分布,通过union all 将数据写入目标表
with person_data_tmp as (selectname,sex,age,year_income,--数据打标签casewhen age >1 and age <=20 then '(1-20]'when age >20 and age <=30 then '(20-30]'when age >30 and age <=40 then '(30-40]'when age >40 and age <=60 then '(40-60]'else '60以上' end as age_stage,casewhen year_income >0 and year_income <=10*10000 then '(0-10万]'when year_income >10*10000 and year_income <=30*10000 then '(10-30万]'when year_income >30*10000 and year_income <=50*10000 then '(30-50万]'else '50万以上' end as year_amount_stage,count(name)over(partition by 1 ) as total_count,sum(year_income)over(partition by 1 ) as total_amountfrom person_data)--写入数据insert overwrite table distributed_dataselect"性别分布" as distributed_type,sex as distributed_item,count(1) as distributed_num,count(1)/max(total_count) as distributed_num_rate,sum(year_income) as distributed_amount,sum(year_income)/max(total_amount) as distributed_amount_ratefrom person_data_tmpgroup by sexunion allselect"年龄段分布" as distributed_type,age_stage as distributed_item,count(1) as distributed_num,count(1)/max(total_count) as distributed_num_rate,sum(year_income) as distributed_amount,sum(year_income)/max(total_amount) as distributed_amount_ratefrom person_data_tmpgroup by age_stageunion allselect"年收入段分布" as distributed_type,year_amount_stage as distributed_item,count(1) as distributed_num,count(1)/max(total_count) as distributed_num_rate,sum(year_income) as distributed_amount,sum(year_income)/max(total_amount) as distributed_amount_ratefrom person_data_tmpgroup by year_amount_stage
结果数据:
写法2
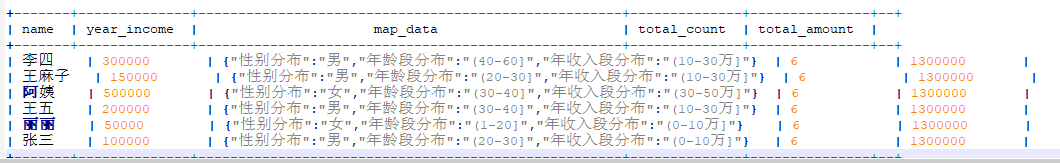
1 构建Map结构为数据打上标签
selectname,year_income,map ("性别分布",sex,"年龄段分布",casewhen age >1 and age <=20 then '(1-20]'when age >20 and age <=30 then '(20-30]'when age >30 and age <=40 then '(30-40]'when age >40 and age <=60 then '(40-60]'else '60以上' end ,"年收入段分布",casewhen year_income >0 and year_income <=10*10000 then '(0-10万]'when year_income >10*10000 and year_income <=30*10000 then '(10-30万]'when year_income >30*10000 and year_income <=50*10000 then '(30-50万]'else '50万以上' end) as map_data,count(name)over(partition by 1 ) as total_count,sum(year_income)over(partition by 1 ) as total_amountfrom person_data;
结果:
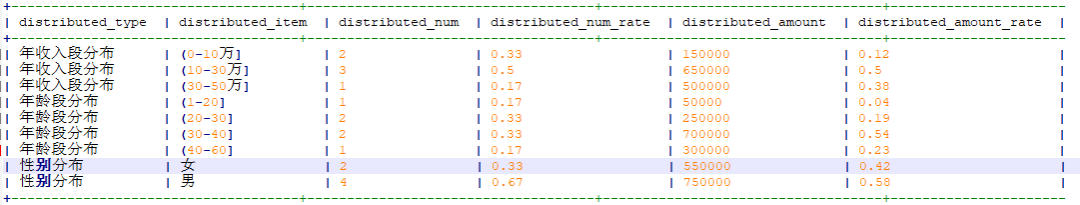
2 集合lateral view函数对map_data数据进行侧写
insert overwrite table distributed_dataselectdistributed_type,distributed_item,count(1) as distributed_num,count(1)/max(total_count) as distributed_num_rate,sum(year_income) as distributed_amount,sum(year_income)/max(total_amount) as distributed_amount_ratefrom(selectname,year_income,distributed_type,distributed_item,total_count,total_amountfrom(selectname,year_income,map ("性别分布",sex,"年龄段分布",casewhen age >1 and age <=20 then '(1-20]'when age >20 and age <=30 then '(20-30]'when age >30 and age <=40 then '(30-40]'when age >40 and age <=60 then '(40-60]'else '60以上' end ,"年收入段分布",casewhen year_income >0 and year_income <=10*10000 then '(0-10万]'when year_income >10*10000 and year_income <=30*10000 then '(10-30万]'when year_income >30*10000 and year_income <=50*10000 then '(30-50万]'else '50万以上' end) as map_data,count(name)over(partition by 1 ) as total_count,sum(year_income)over(partition by 1 ) as total_amountfrom person_data)tmplateral view explode(map_data) k as distributed_type,distributed_item)tmp2group by distributed_type,distributed_item;
得到的分布结果数据如下:
文章转载自趣说大数据,如果涉嫌侵权,请发送邮件至:contact@modb.pro进行举报,并提供相关证据,一经查实,墨天轮将立刻删除相关内容。
