


本文主要对hive(2.3.7)的metrics体系进行总结,hive的常用服务包括hs2和hms,这里也以这两者为主。这里围绕hive的metrics参数配置,源代码中各部分对metrics的收集以及暴露着手。
一、HiveServer2 UI
从hive2.0.0之后,hive提供了HS2的UI界面,默认通过10002端口打开,可以看到session,log以及metrics相关信息。具体参考官网链接 (https://cwiki.apache.org/confluence/display/Hive/Setting+Up+HiveServer2#SettingUpHiveServer2-WebUIforHiveServer2)
通过http://host:10002/jmx 就可以看到hs2的一些metrics,主要围绕jvm,通过一些参数配置可以增加其他metrics,Hive中可以配置的metrics的相关信息(https://cwiki.apache.org/confluence/display/Hive/Configuration+Properties#ConfigurationProperties-Metrics)
| 参数 | 默认值 | 含义 |
| hive.metastore.metrics.enabled | false | 打开metastore的监控 |
| hive.server2.metrics.enabled | false | 打开hs2的监控 |
| hive.service.metrics.class | CodahaleMetrics | hive监控体系实现类 |
| hive.service.metrics.reporter | JSON_FILE, | 监控信息的返回格式,可选JSON_FILE,CONSOLE,JMX多个选项用逗号分隔 |
在hive-site.xml进行配置hive.metastore.metrics.enabled=true,再次访问jmx就可以看到metrics:name=xxx的metrics,如下:

二、Hive源代码
从上图能看到metrics:name=api_和metrics:name=active_calls_开头的监控信息,这些类在org.apache.hadoop.hive.common.metrics.metrics2.CodahaleMetrics中定义,而这个类的调用有hive.metrics.class来控制的。接下来整理下最主要的三部分,MetricsFactory类, CodahaleMetrics类以及Reporter类。
1. MetricsFactory类
通过调用org.apache.hadoop.hive.common.metrics.common.MetricsFactory的init方法构造出来CodahaleMetrics类,如下所示
/*** Initializes static Metrics instance.*/public synchronized static void init(HiveConf conf) throws Exception {if (metrics == null) {Class metricsClass = conf.getClassByName(conf.getVar(HiveConf.ConfVars.HIVE_METRICS_CLASS));Constructor constructor = metricsClass.getConstructor(HiveConf.class);metrics = (Metrics) constructor.newInstance(conf);}}
HiveMetastore,HiveServer2,JvmPauseMonitor,PerfLogger,Operation, SQLOperation等类通过MetricsFactory.getInstance()获取Metrics发送metrics。
JVMPauseMonitor类
当Hive启动JVM进程时候就会生成JVMPauseMonitor对象来收集JVM相关的metrics,如下
JvmPauseMonitor pauseMonitor = new JvmPauseMonitor(conf);pauseMonitor.start();
在start里面,生成一个守护线程,Monitor是JvmPauseMonitor的内部类
public void start() {Preconditions.checkState(monitorThread == null,"JvmPauseMonitor thread is Already started");monitorThread = new Daemon(new Monitor());monitorThread.start();}
Monitor的run方法内有三处调用incrementMetricsCounter对相应的metrics进行累加,主要包括以下三个metrics
public static final String JVM_PAUSE_INFO = "jvm.pause.info-threshold";public static final String JVM_PAUSE_WARN = "jvm.pause.warn-threshold";public static final String JVM_EXTRA_SLEEP = "jvm.pause.extraSleepTime";
HiveMetaStore类
这个类以收集与元数据操作有关的操作的metrics,比如对数据库,表,分区等,每当发生这些行为时,就会调用startFunction进行更新
private String startFunction(String function, String extraLogInfo) {incrementCounter(function);logInfo((getThreadLocalIpAddress() == null ? "" : "source:" + getThreadLocalIpAddress() + " ") +function + extraLogInfo);if (MetricsFactory.getInstance() != null) {MetricsFactory.getInstance().startStoredScope(MetricsConstant.API_IN_PREFIX + function);}return function;}
这里面MetricsConstant.API_IN_PREFIX就是api_,所以开头的截图看到的很多操作以api_开头。
PerfLogger类
这个主要用于监控代码片段的执行,比如执行时间等;具体调用方式,把日志调整为DEBUG级别时,调用PerfLogBegin开始收集metrics,在PerfLogEnd方法会输出该方法的运行耗时时间等信息。
/*** Call this function when you start to measure time spent by a piece of code.* @param callerName the logging object to be used.* @param method method or ID that identifies this perf log element.*/public void PerfLogBegin(String callerName, String method) {long startTime = System.currentTimeMillis();startTimes.put(method, new Long(startTime));if (LOG.isDebugEnabled()) {LOG.debug("<PERFLOG method=" + method + " from=" + callerName + ">");}beginMetrics(method);}
HiveServer2类
在hiveserver2中主要是init和stop中调用,在init中进行初始化,在stop中关闭metrics。启动之后,会生成CLIService对象,后续关于SQL的metrics都有Operation处理。
@Overridepublic synchronized void init(HiveConf hiveConf) {//Initialize metrics first, as some metrics are for initialization stuff.try {if (hiveConf.getBoolVar(ConfVars.HIVE_SERVER2_METRICS_ENABLED)) {MetricsFactory.init(hiveConf);}} catch (Throwable t) {LOG.warn("Could not initiate the HiveServer2 Metrics system. Metrics may not be reported.", t);}...}
@Overridepublic synchronized void stop() {...// Shutdown Metricsif (MetricsFactory.getInstance() != null) {try {MetricsFactory.close();} catch (Exception e) {LOG.error("error in Metrics deinit: " + e.getClass().getName() + " "+ e.getMessage(), e);}}...}
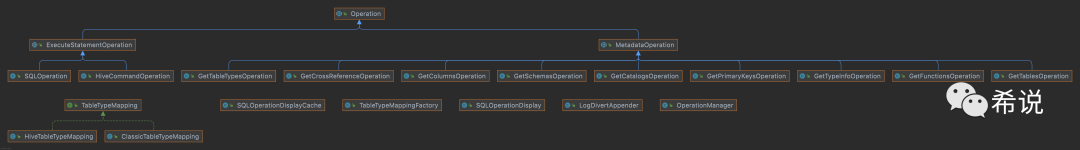
Operation类
有两个子类MetadataOperation
和ExecuteStagementOperation
,继承关系如下:
2. CodahaleMetrics类
这个是hive整个代码里面收集metrics的主要类,这里主要有以下重要的方法
(1)incrementCounter(String name, long increment)
该方法根据监控项的名称name,找到对应监控项的值,然后增加该监控项的数值increment。
(2)decrementCounter(String name, long decrement)
与上面的方法相反,减少监控项的数值。
(3)startStoredScope
前面HiveMetaStore.startFunction方法,连接该metastore执行不同操作时调用的方法,全部进入这个方法中,该方法的监控值加1,然后将数据存入StoredScope对象中,这个对象中存储的数值可以由JMXReporter或者JsonFileReporter向外部暴露。
private String startFunction(String function, String extraLogInfo) {incrementCounter(function);logInfo((getThreadLocalIpAddress() == null ? "" : "source:" + getThreadLocalIpAddress() + " ") +function + extraLogInfo);if (MetricsFactory.getInstance() != null) {MetricsFactory.getInstance().startStoredScope(MetricsConstant.API_IN_PREFIX + function);}return function;}
(4)endStoredScope
与上面的方法相反,从当前线程移除指定监控项目
@Overridepublic void endStoredScope(String name) {if (threadLocalScopes.get().containsKey(name)) {threadLocalScopes.get().get(name).close();threadLocalScopes.get().remove(name);}}
(5)initReporting
初始化Reporter对象,由hive.service.metrics.reporter控制
3. Reporter
这里是向外部暴露Metrics信息的地方,常用的有以下两个实现,由参数hive.service.metrics.reporter配置具体的输出方式。在上面的initReporting来构造对应的Reporter。
(1)JMXReporter
位于metrics-core-3.1.0.jar的com.codahale.metrics路径下。构造好该对象,调用start方法,这个值得再总结下。
(2)JsonFileReporter
JsonFileReporter是CodahaleMetrics的内部类。start方法定时从MetricRegistry类中取出收集到的监控数据,输出到hive.service.metrics.file.location路径下。
到这里对hive整个的metrics体系有个大致的整理,后续会介绍怎么通过prometheus收集,以及收集过程的遇到的坑。
本文参考:
https://blog.600mb.com/a?ID=00850-0e1a4f84-c85d-40b8-b154-49cd6761453b
https://blog.csdn.net/dabokele/article/details/84449789
