


1 安装前准备
1.1 主机环境
准备一台虚拟机
1.2 规划安装目录
将prometheus相关服务都安装在/data/目录下面,最好/data是一块单独的磁盘,易于扩容
mkdir -p data/{prometheus,grafana,alertmanager,node_exporter}
1.3 下载安装包
下载地址:
https://prometheus.io/download/ https://grafana.com/grafana/download/
版本信息:
Prometheus版本:2.53.4 grafana版本:11.5.3 alertmanager版本:0.28.1 exporter版本:1.9.0 # 进入/data目录
cd /data

# 下载prometheus
wget https://github.com/prometheus/prometheus/releases/download/v2.53.4/prometheus-2.53.4.linux-amd64.tar.gz

# 下载grafana
wget https://dl.grafana.com/enterprise/release/grafana-enterprise-11.5.3.linux-amd64.tar.gz

# 下载altermanager
wget https://github.com/prometheus/alertmanager/releases/download/v0.28.1/alertmanager-0.28.1.linux-amd64.tar.gz

# 下载node_exporter
wget https://github.com/prometheus/node_exporter/releases/download/v1.9.0/node_exporter-1.9.0.linux-amd64.tar.gz
2 安装prometheus相关服务
2.1 安装Prometheus
解压安装包
[root@localhost ~]# cd data
[root@localhost data]# tar -xvf prometheus-2.53.4.linux-amd64.tar.gz
[root@localhost data]# mv prometheus-2.53.4.linux-amd64/* data/prometheus
创建prometheus用户
useradd -M -s sbin/nologin prometheus
授予prometheus目录权限
chown -R prometheus.prometheus /data/prometheus
给prometheus创建systemd服务
cat >> etc/systemd/system/prometheus.service << EOF
[Unit]
Description=Prometheus Server
Documentation=https://prometheus.io/docs/introduction/overview
After=network.target

[Service]
Type=simple
User=prometheus
Group=prometheus
Restart=on-failure
ExecStart=/data/prometheus/prometheus \
  --config.file=/data/prometheus/prometheus.yml \
  --storage.tsdb.path=/data/prometheus/data \
  --storage.tsdb.retention.time=15d \
  --web.enable-lifecycle

[Install]
WantedBy=multi-user.target
EOF
重载服务
systemctl daemon-reload
启动prometheus并设置开机自启动
systemctl enable --now prometheus.service
检查状态
systemctl status prometheus.service
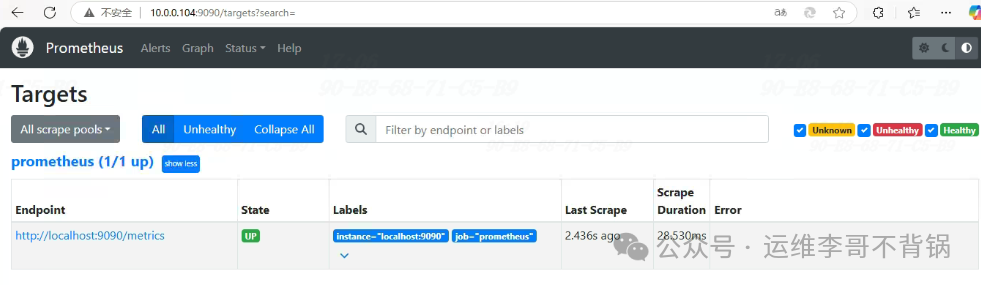
访问prometheus
2.2 安装alertmanager
解压安装包
tar -xvf alertmanager-0.28.1.linux-amd64.tar.gz
解压的内容复制到/data/alertmanager目录
mv data/alertmanager-0.28.1.linux-amd64/* data/alertmanager
更改alertmanager权限
chown -R prometheus.prometheus data/alertmanager
给alertmanager创建systemd服务
cat >> etc/systemd/system/alertmanager.service << EOF
[Unit]
Desciption=Alert Manager
wants=network-online.target
After=network-online.target

[Service]
Type=simple
User=prometheus
Group=prometheus
ExecStart=/data/alertmanager/alertmanager \
--config.file=/data/alertmanager/alertmanager.yml \
--storage.path=/data/alertmanager/data
Restart=always

[Install]
WantedBy=multi-user.target
EOF
启动alertmanager
# 重载服务
systemctl daemon-reload

# 启动并设置开机自启动
systemctl enable --now  alertmanager.service
查看alertmanager状态
systemctl status alertmanger
将alertmanager加入prometheus。
vi /data/prometheus/prometheus.yml
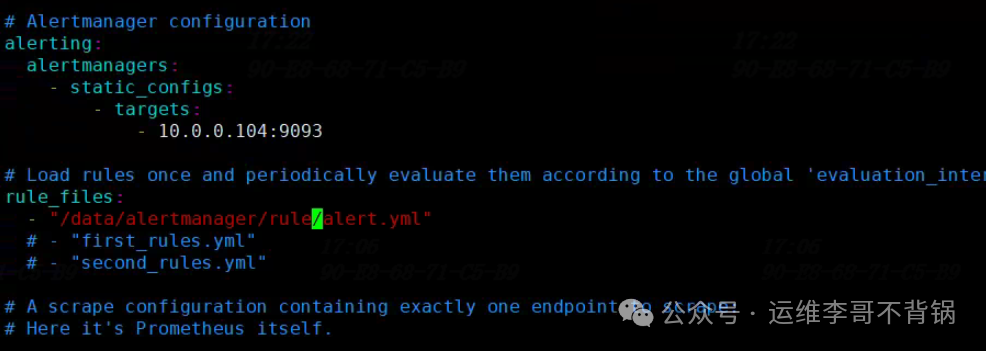
# Alertmanager configuration
alerting:
alertmanagers:
- static_configs:
- targets:
# 根据实际填写alertmanager的IP地址
- 10.0.0.104:9093
# Load rules once and periodically evaluate them according to the global 'evaluation_interval'.
rule_files:
# 根据实际名修改文件名,可以有多个规则文件
- "/data/alertmanger/rule/alert.yml"
增加触发器配置文件
# 新建存放告警文件目录
mkdir data/alertmanager/rule
chown -R prometheus.prometheus data/alertmanager

# 编辑配置文件
vim data/alertmanager/rule/alert.yml

groups:
  - name: 主机状态监控
    rules:
      - alert: 主机宕机
        expr: up == 0
        for: 1m
        labels:
          severity: critical
        annotations:
          summary: "{{ $labels.instance }} 主机宕机,请尽快处理"
          description: "{{ $labels.instance }} 已经宕机超过 1 分钟。请检查服务状态。"
检查配置
cd /data/prometheus/
[root@localhost prometheus]# ./promtool  check config prometheus.yml
Checking prometheus.yml
  SUCCESS: 1 rule files found
 SUCCESS: prometheus.yml is valid prometheus config file syntax

Checking data/alertmanager/rule/alert.yml
  SUCCESS: 1 rules found
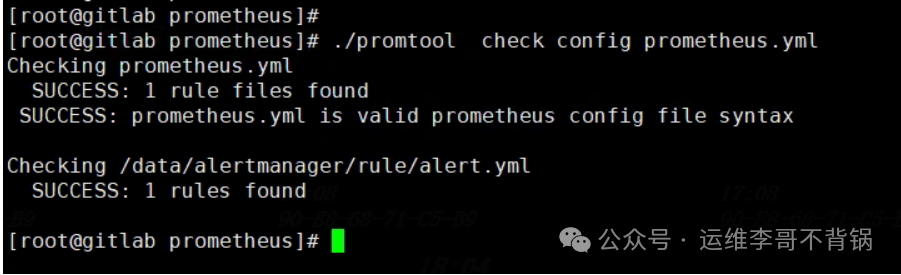
一定要检测通过再进行重启prometheus
重启prometheus
systemctl restart prometheus
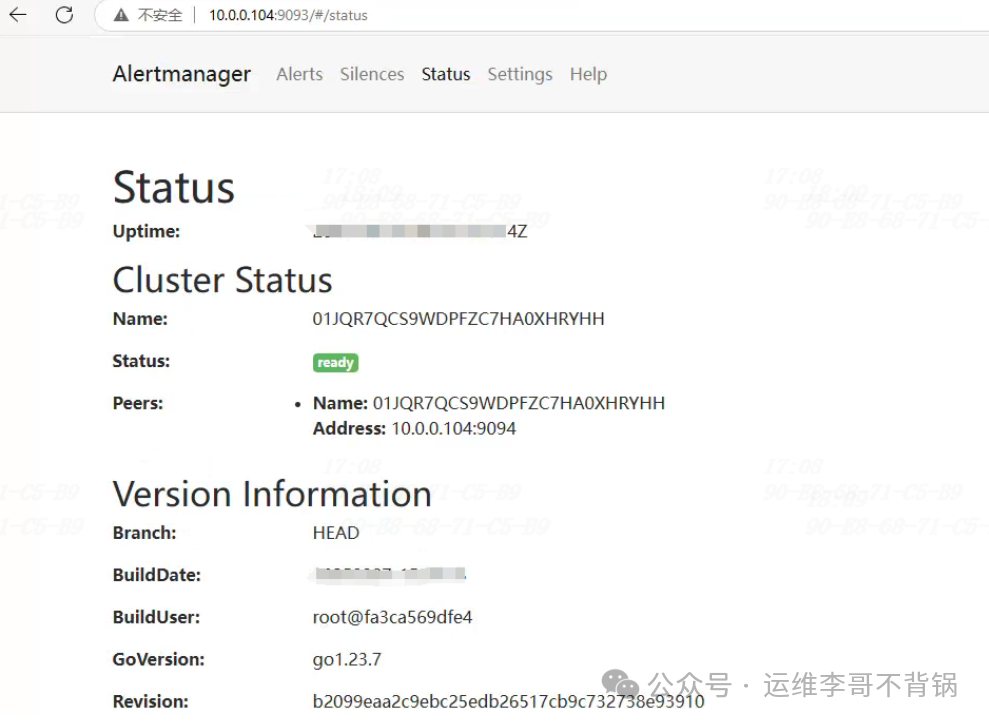
访问alertmanager:
http://10.0.0.104:9093
2.3 安装node_exporter
解压安装包
tar -xvf node_exporter-1.9.0.linux-amd64.tar.gz
解压的内容复制到/data/node_exporter目录
mv node_exporter-1.9.0.linux-amd64/* data/node_exporter
修改权限
chown prometheus.prometheus -R data/node_exporter
给node_exporter创建systemd服务
cat >> etc/systemd/system/node_exporter.service << EOF
[Unit]
Description=node_exporter
Documentation=https://prometheus.io/
After=network.target

[Service]
User=prometheus
Group=prometheus
ExecStart=/data/node_exporter/node_exporter
Restart=on-failure

[Install]
WantedBy=multi-user.target
EOF
启动node_exporter
systemctl daemon-reload
systemctl enable --now node_exporter.service
查看状态
systemctl status node_exporter
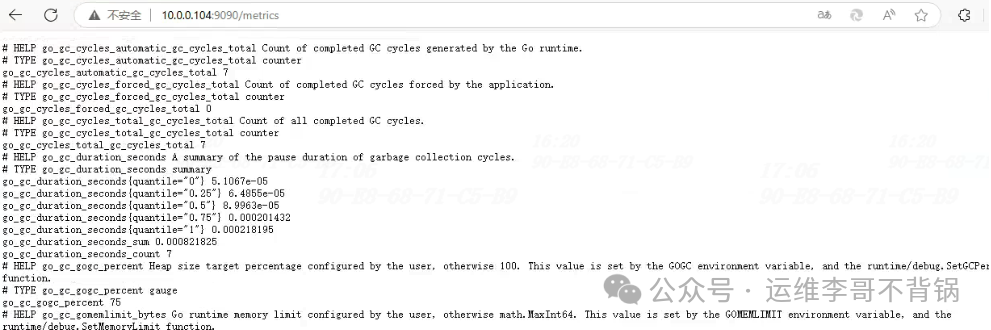
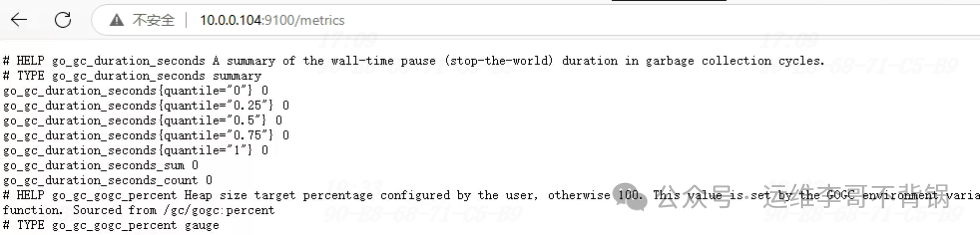
访问地址:
http://10.0.0.104:9100/metrics
2.4 配置prometheus
vi data/prometheus/prometheus.yml
# 在尾部添加一个job_name,可以添加多个targets
- job_name: "node_exporter"
    static_configs:
      - targets: ["10.0.0.104:9100"]
        labels:
          instance: 10.0.0.104服务器
重载prometheus
# 重启前检查配置是否正确
./promtool  check config prometheus.yml

# 平滑加载
curl -X POST http://10.0.0.104:9090/-/reload

# 或者直接重启
systemctl restart prometheus
登录prometheus查看-node_exporter是否起来了
2.5 安装Grafana
解压安装包
tar -xvf grafana-enterprise-11.5.3.linux-amd64.tar.gz
将解压内容移动到/data/grafana
mv grafana-v11.5.3/* data/grafana
更改grafana目录权限
chown -R prometheus.prometheus /data/grafana
给grafana创建systemd服务
cat >> etc/systemd/system/grafana-server.service << EOF
[Unit]
Description=Grafana server
Documetation=http://dosc.grafana.org

[Service]
Type=simple
User=prometheus
Group=prometheus
Restart=on-failure
ExecStart=/data/grafana/bin/grafana-server --config=/data/grafana/conf/defaults.ini --homepath=/data/grafana

[Install]
WantedBy=multi-user.target
EOF
启动grafana
# 重载系统服务
systemctl daemon-reload

# 启动并设置开机自启动
systemctl enable --now grafana-server.service
查看状态
systemctl status grafana-server.service
访问grafana
http://10.0.0.104:3000
默认用户名/密码:admin/admin

2.6 grafana对接prometheus
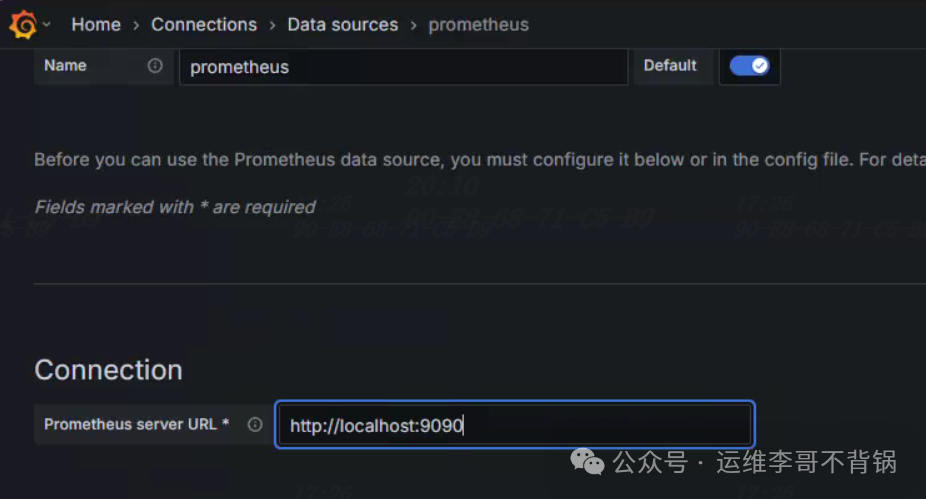
从Grafana官网导入符合要求的仪表盘
https://grafana.com/grafana/dashboards
在grafana右上角处点击Import dashboard,

导入id号或json文件,在grafana官网可以直接获取。
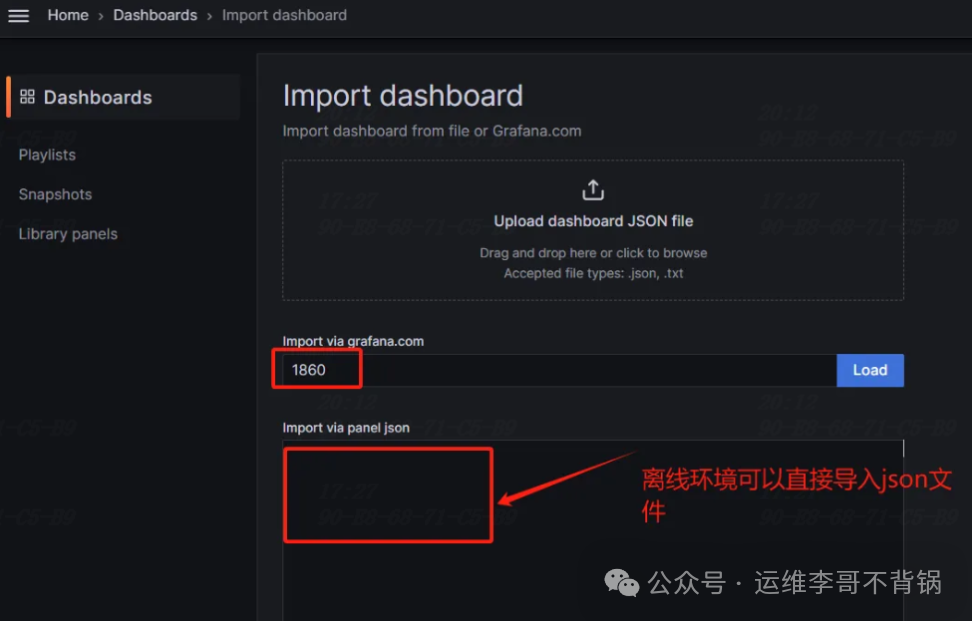
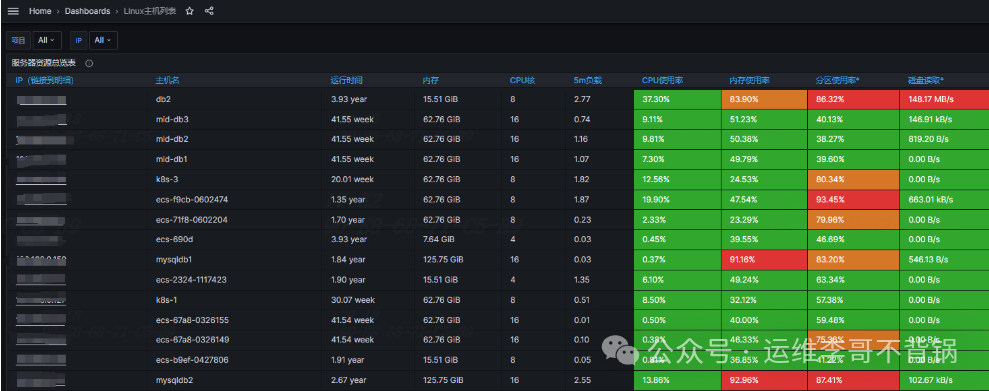
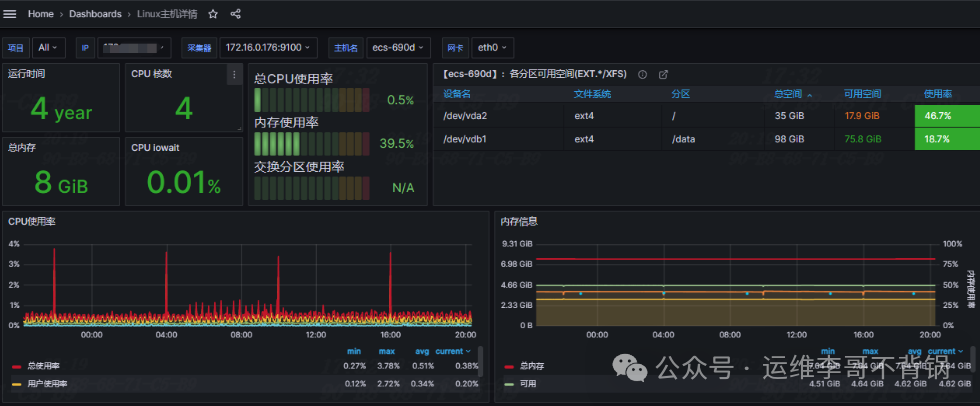
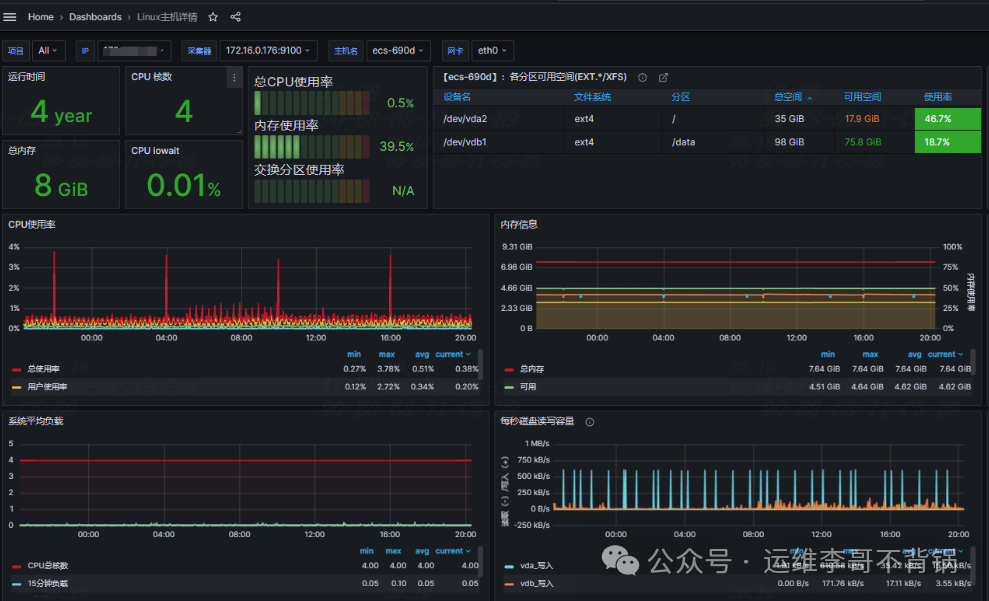
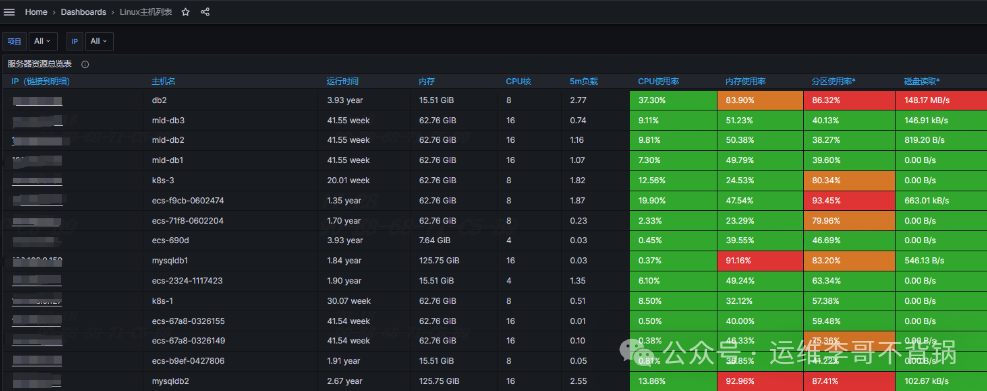
生产环境示例:Linux主机详情和Linux主机列表”
Linux主机详情的dashboard ID:12633
Linux主机列表的dashboard ID:12632
往期精彩文章:
