


为了达到达梦数据库的良好运行状态,我们需要进行巡检,发现和解决潜在的问题,以保证数据库的稳定性。本文将介绍如何使用shell脚本编写达梦数据库的巡检脚本,并将巡检结果生成可视化文档。
巡检内容:
数据库连接状态
磁盘空间使用率
堆内存和物理内存使用情况
日志文件大小
数据库表和索引状态
脚本实现:
以下是我们可以使用的脚本,它将检查达梦数据库的连接状态,检查磁盘空间,检查堆内存和物理内存使用情况,检查日志文件的大小以及数据库表和索引状态。
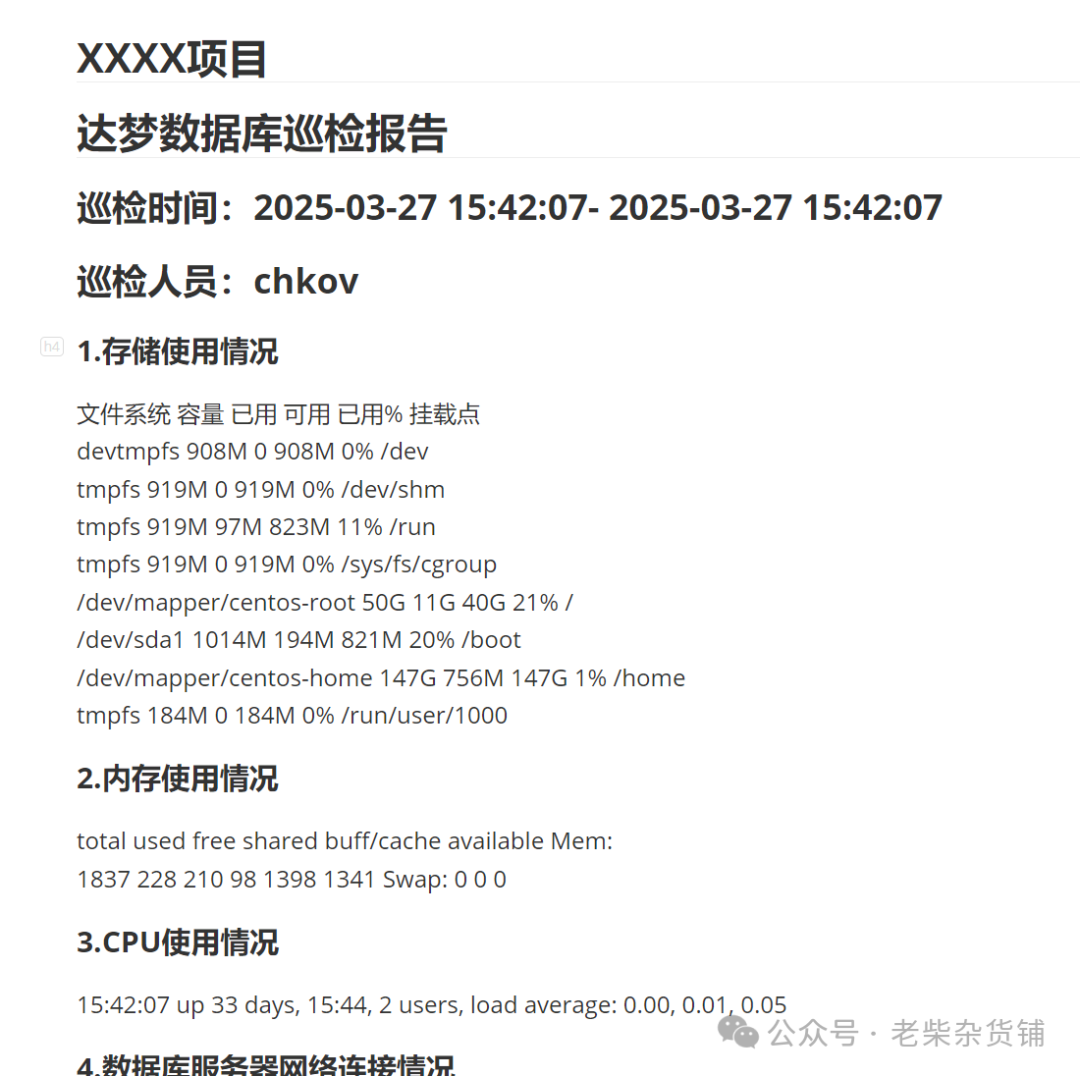
#!/bin/bash# 达梦数据库巡检函数#定义变量DB_USER="username"DB_PASSWORD="password"DB_SID="sid"#检查数据库连接状态function check_dm() {# 存储使用情况&内存使用情况&CPU使用情况storage=$(df -h)memory=$(free -m)cpu=$(uptime)network=$(ss -autnp | grep ESTA | grep dmserver | tail -n 100)ports=$(ss -tnlp | egrep "dmserver|asm|css|:22")processes=$(ps -ef | grep dm)error_logs=$(for i in `find var/log/ -mtime -1 -type f`;do tail -200 $i | grep `date +%F`| grep ERROR && echo $i || echo "$ORACLE_SID 无报错信息";done)#检查日志文件大小log_file_size=$(ls -lh /path/to/log/file)#检查表和索引状态table_index_status=$(disql sysdba/'"SYSDBA"'@localhost:$PORT -e "select table_name, index_name, status from user_indexes;"|grep -v table_name | tail -n+5#检查数据库连接状态#is_db_connected=$(disql sysdba/'"SYSDBA"'@localhost:$PORT -e "select 1 from dual;"|grep -v data_arrive_process | tail -n+5export PORT=`ss -tnlp |grep dmserver |grep S2 |awk '{print $4}' |cut -d ':' -f4`database_info=$(disql sysdba/'"SYSDBA"'@localhost:$PORT -e "select status$ as 实例状态 from v\$instance; select count(1) as 活跃连接数,vs.user_name from v\$sessions vs where vs.state='ACTIVE' group by user_name order by 1 desc limit 10;select count(*) as 过去24小时内归档文件数 from v\$archived_log where first_time > sysdate()-1;"|grep -v data_arrive_process | tail -n+5)database_info+=$(disql sysdba/'"SYSDBA"'@localhost:$PORT -e "select summary.*,round(USED_MB/TOTAL_MB,4)*100||'%' as 表空间使用率 from (select tablespace_name,sum(maxbytes/1024/1024) as TOTAL_MB,sum(bytes/1024/1024) as USED_MB from dba_data_files group by tablespace_name) summary order by 4 desc limit 5;select username,account_status as 用户状态 from dba_users where account_status!= 'OPEN';"|grep -v data_arrive_process | tail -n+5)database_info+=$(disql sysdba/'"SYSDBA"'@localhost:$PORT -e "select path as 备份 from v\$backup_history order by start_time desc limit 2;select case when count(*) = 0 then '无' else '有事务等待信息' end as 事务等待情况 from v\$trxwait;"|grep -v data_arrive_process | tail -n+5)}# 获取当前时间作为开始时间start_time=$(date +'%Y-%m-%d %H:%M:%S')# 执行巡检check_dm# 获取当前时间作为结束时间end_time=$(date +'%Y-%m-%d %H:%M:%S')# 生成 MARKDOWN 报告report=$(cat <<EOF## XXXX项目## 达梦数据库巡检报告### 巡检时间:$start_time - $end_time### 巡检人员:chkov#### 1.存储使用情况$storage#### 2.内存使用情况$memory#### 3.CPU使用情况$cpu#### 4.数据库服务器网络连接情况$network#### 5.数据库监听端口情况$ports#### 6.数据库进程状态$processes#### 7.数据库日志大小$log_file_size#### 8.数据库异常日志$error_logs#### 9.数据库层面相关情况$database_info#### 10.数据库表和索引状态$table_index_statusEOF)# 将 HTML 报告输出到文件或在浏览器中显示echo $report >dm_inspection_report.md
这个脚本执行以下操作:
检查数据库连接状态。
检查磁盘空间使用率。
检查堆内存和物理内存使用情况。
检查日志文件大小。
检查数据库表和索引状态。
将巡检结果写入文档。
总结:
本文介绍了如何使用shell脚本编写达梦数据库的巡检脚本,并将巡检结果生成为可视化文档。这个脚本可以检查数据库连接状态,磁盘空间使用率,堆内存和物理内存使用情况,日志文件大小以及数据库表和索引状态。该脚本具有可扩展性,可以根据需要添加其他巡检项。
文章转载自老柴杂货铺,如果涉嫌侵权,请发送邮件至:contact@modb.pro进行举报,并提供相关证据,一经查实,墨天轮将立刻删除相关内容。
