


硬件对比
-
32核 64GB 5Mbps,增强型SSD云盘2块 300G
-
2核8G 5Mbps,系统盘100G
sysbench对比
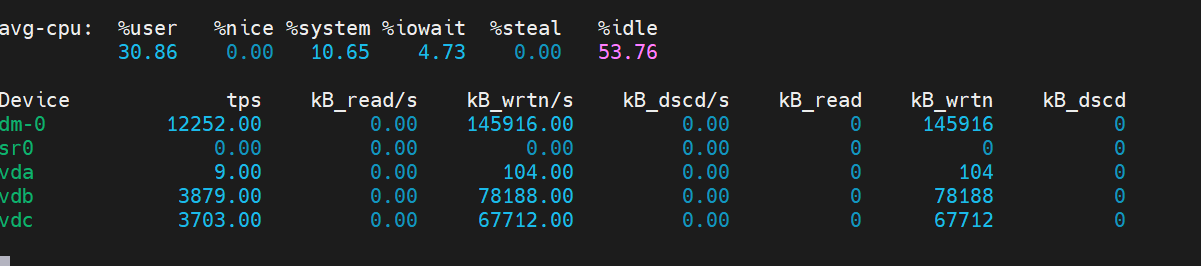
硬件1情况sysbench测试tps:8318,磁盘tps:12252
[ 54s ] thds: 64 tps: 8144.68 qps: 162367.65 (r/w/o: 113643.56/32434.74/16289.36) lat (ms,95%): 9.73 err/s: 0.00 reconn/s: 0.00
[ 55s ] thds: 64 tps: 8214.33 qps: 164550.70 (r/w/o: 115200.69/32921.34/16428.67) lat (ms,95%): 10.27 err/s: 0.00 reconn/s: 0.00
[ 56s ] thds: 64 tps: 7997.06 qps: 159788.19 (r/w/o: 111923.84/31871.24/15993.12) lat (ms,95%): 10.65 err/s: 0.00 reconn/s: 0.00
[ 57s ] thds: 64 tps: 7979.75 qps: 160037.02 (r/w/o: 111949.51/32127.02/15960.50) lat (ms,95%): 10.27 err/s: 0.00 reconn/s: 0.00
[ 58s ] thds: 64 tps: 7952.52 qps: 158843.51 (r/w/o: 111301.35/31637.11/15905.05) lat (ms,95%): 10.65 err/s: 0.00 reconn/s: 0.00
[ 59s ] thds: 64 tps: 8202.77 qps: 164119.41 (r/w/o: 114816.79/32897.08/16405.54) lat (ms,95%): 10.27 err/s: 0.00 reconn/s: 0.00
[ 60s ] thds: 64 tps: 8347.68 qps: 167093.55 (r/w/o: 116920.48/33477.71/16695.35) lat (ms,95%): 9.73 err/s: 0.00 reconn/s: 0.00
SQL statistics:
    queries performed:
        read:                            6989038
        write:                           1996868
        other:                           998434
        total:                           9984340
    transactions:                        499217 (8318.15 per sec.)
    queries:                             9984340 (166363.09 per sec.)
    ignored errors:                      0      (0.00 per sec.)
    reconnects:                          0      (0.00 per sec.)

General statistics:
    total time:                          60.0146s
    total number of events:              499217

Latency (ms):
         min:                                    3.12
         avg:                                    7.69
         max:                                   36.83
         95th percentile:                        9.91
         sum:                              3839855.61

Threads fairness:
    events (avg/stddev):           7800.2656/228.46
    execution time (avg/stddev):   59.9977/0.00

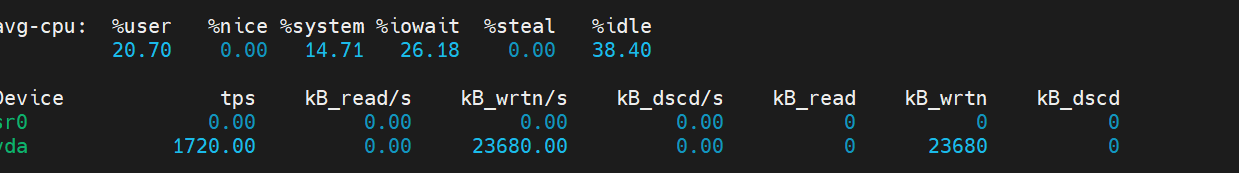
硬件2情况sysbench测试tps:221,磁盘tps 1720
[ 47s ] thds: 4 tps: 224.01 qps: 4480.27 (r/w/o: 3136.19/896.05/448.03) lat (ms,95%): 23.52 err/s: 0.00 reconn/s: 0.00
[ 48s ] thds: 4 tps: 232.99 qps: 4659.76 (r/w/o: 3261.84/931.95/465.98) lat (ms,95%): 22.69 err/s: 0.00 reconn/s: 0.00
[ 49s ] thds: 4 tps: 249.01 qps: 4966.23 (r/w/o: 3480.16/988.05/498.02) lat (ms,95%): 21.50 err/s: 0.00 reconn/s: 0.00
[ 50s ] thds: 4 tps: 232.99 qps: 4673.79 (r/w/o: 3267.86/939.96/465.98) lat (ms,95%): 22.69 err/s: 0.00 reconn/s: 0.00
[ 51s ] thds: 4 tps: 248.99 qps: 4964.80 (r/w/o: 3474.86/991.96/497.98) lat (ms,95%): 20.74 err/s: 0.00 reconn/s: 0.00
[ 52s ] thds: 4 tps: 228.01 qps: 4562.28 (r/w/o: 3194.20/912.06/456.03) lat (ms,95%): 23.95 err/s: 0.00 reconn/s: 0.00
[ 53s ] thds: 4 tps: 235.00 qps: 4713.05 (r/w/o: 3299.03/944.01/470.00) lat (ms,95%): 23.10 err/s: 0.00 reconn/s: 0.00
[ 54s ] thds: 4 tps: 232.99 qps: 4654.84 (r/w/o: 3260.89/927.97/465.98) lat (ms,95%): 23.10 err/s: 0.00 reconn/s: 0.00
[ 55s ] thds: 4 tps: 247.00 qps: 4930.03 (r/w/o: 3456.02/980.01/494.00) lat (ms,95%): 22.28 err/s: 0.00 reconn/s: 0.00
[ 56s ] thds: 4 tps: 240.00 qps: 4815.04 (r/w/o: 3363.03/972.01/480.00) lat (ms,95%): 20.74 err/s: 0.00 reconn/s: 0.00
[ 57s ] thds: 4 tps: 230.01 qps: 4600.13 (r/w/o: 3220.09/920.03/460.01) lat (ms,95%): 24.83 err/s: 0.00 reconn/s: 0.00
[ 58s ] thds: 4 tps: 241.00 qps: 4819.94 (r/w/o: 3373.95/963.99/481.99) lat (ms,95%): 23.52 err/s: 0.00 reconn/s: 0.00
[ 59s ] thds: 4 tps: 227.00 qps: 4535.03 (r/w/o: 3177.02/904.01/454.00) lat (ms,95%): 23.10 err/s: 0.00 reconn/s: 0.00
[ 60s ] thds: 4 tps: 238.99 qps: 4784.78 (r/w/o: 3346.85/959.96/477.98) lat (ms,95%): 22.69 err/s: 0.00 reconn/s: 0.00
SQL statistics:
    queries performed:
        read:                            185682
        write:                           53052
        other:                           26526
        total:                           265260
    transactions:                        13263  (221.02 per sec.)
    queries:                             265260 (4420.40 per sec.)
    ignored errors:                      0      (0.00 per sec.)
    reconnects:                          0      (0.00 per sec.)

General statistics:
    total time:                          60.0065s
    total number of events:              13263

Latency (ms):
         min:                                    9.13
         avg:                                   18.09
         max:                                  196.52
         95th percentile:                       25.28
         sum:                               239963.25

Threads fairness:
    events (avg/stddev):           3315.7500/3.11
    execution time (avg/stddev):   59.9908/0.00

云平台测试报告
| CPU(core) | 内存(MB) | 并发度 | 单表数据量 | 表总数 | SysBench TPS | SysBench QPS | avg_lat(ms) |
|---|---|---|---|---|---|---|---|
| 1 | 1000 | 8 | 800000 | 6 | 582.76 | 11655.1 | 13.73 |
| 1 | 2000 | 8 | 800000 | 12 | 588.92 | 11778.4 | 13.58 |
| 2 | 4000 | 16 | 800000 | 24 | 899.06 | 17981.2 | 17.8 |
| 4 | 8000 | 32 | 800000 | 48 | 1915.83 | 38316.6 | 16.7 |
| 4 | 16000 | 32 | 6000000 | 13 | 1884.2 | 37684 | 16.98 |
| 8 | 16000 | 64 | 6000000 | 13 | 3356.71 | 67134.2 | 19.06 |
| 8 | 32000 | 64 | 6000000 | 25 | 3266.73 | 65334.6 | 19.59 |
| 16 | 32000 | 128 | 6000000 | 25 | 5370.18 | 107404 | 23.83 |
| 16 | 64000 | 128 | 6000000 | 49 | 5910.85 | 118217 | 21.65 |
| 16 | 96000 | 128 | 6000000 | 74 | 5813.94 | 116279 | 22.01 |
| 16 | 128000 | 128 | 6000000 | 98 | 5700.06 | 114001 | 22.45 |
结论
tps与核数关系(1核支撑110tps~356tps)
tps与IOPS关系 (1.5~8 IOPS 1tps)
CPU:MEM 1核:2~8G
即支撑1000tps 硬件需求是6核 ,1500~8000 iops
即支撑2000tps 硬件需求是12核 ,3000~16000 iops
即支撑3000tps 硬件需求是18核 ,4500~24000 iops
即支撑4000tps 硬件需求是24核 ,6000~32000 iops
即支撑5000tps 硬件需求是32核 ,7500~40000 iops
「喜欢这篇文章,您的关注和赞赏是给作者最好的鼓励」
关注作者
【版权声明】本文为墨天轮用户原创内容,转载时必须标注文章的来源(墨天轮),文章链接,文章作者等基本信息,否则作者和墨天轮有权追究责任。如果您发现墨天轮中有涉嫌抄袭或者侵权的内容,欢迎发送邮件至:contact@modb.pro进行举报,并提供相关证据,一经查实,墨天轮将立刻删除相关内容。
