


一、全局性能调优配置
1. /etc/nginx/nginx.conf
核心调优参数
user nginx;
worker_processes auto;  # 自动匹配CPU核心数
worker_rlimit_nofile100000;  # 突破系统文件描述符限制

events {
worker_connections4096;  # 单个Worker最大连接数
multi_accepton;  # 一次性接受所有新连接
useepoll;  # Linux内核高效I/O模型
}

http {
# 基础性能优化
sendfileon;
tcp_nopushon;  # 减少数据包发送次数
tcp_nodelayon;  # 禁用Nagle算法
keepalive_timeout30;  # 长连接超时
keepalive_requests1000;  # 单个长连接最大请求数
reset_timedout_connectionon;  # 重置超时连接

# 缓冲区优化
client_body_buffer_size128k;
client_header_buffer_size16k;
large_client_header_buffers432k;
client_max_body_size100m;

# MIME类型缓存
types_hash_max_size2048;
server_names_hash_bucket_size128;

# Gzip压缩优化
gzipon;
gzip_min_length1k;
gzip_comp_level6;
gzip_types text/plain text/css application/json application/javascript text/xml;
gzip_proxied any;

# 核心日志配置(见下文)
include /etc/nginx/conf.d/logs.conf;
}
二、精细化JSON日志与慢请求标记
1. 创建独立日志配置文件 /etc/nginx/conf.d/logs.conf
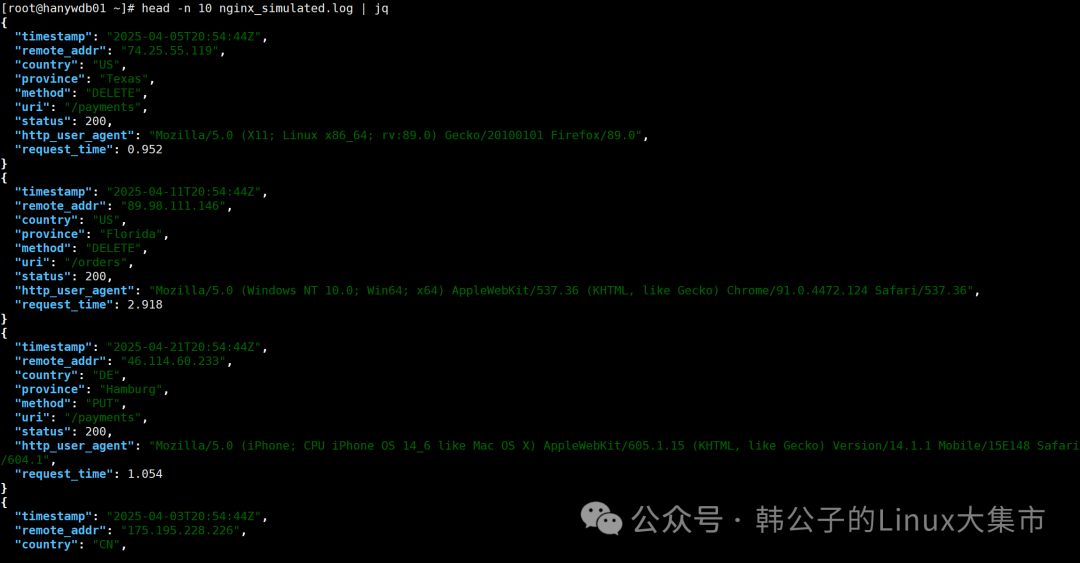
log_format json_analytics escape=json
'{'
'"timestamp": "$time_iso8601", '# ISO8601标准时间
'"remote_addr": "$remote_addr", '
'"request_id": "$request_id", '# 唯一请求标识符
'"server_name": "$server_name", '
'"host": "$host", '
'"method": "$request_method", '
'"uri": "$request_uri", '
'"query": "$query_string", '
'"protocol": "$server_protocol", '
'"status": "$status", '
'"body_bytes_sent": "$body_bytes_sent", '
'"bytes_sent": "$bytes_sent", '
'"request_time": "$request_time", '# 总请求时间(秒)
'"upstream_time": "$upstream_response_time", '
'"ssl_handshake_time": "$ssl_handshake_time", '# SSL握手耗时
'"ssl_protocol": "$ssl_protocol", '
'"ssl_cipher": "$ssl_cipher", '
'"http_referer": "$http_referer", '
'"http_user_agent": "$http_user_agent", '
'"http_x_forwarded_for": "$http_x_forwarded_for", '
'"request_length": "$request_length", '# 请求总字节数
'"content_type": "$content_type", '
'"connection": "$connection", '
'"connection_requests": "$connection_requests", '# 连接的累计请求数
'"slow_request": "$slow_request"'# 慢请求标记(自定义)
'}';

# 定义慢请求阈值(2秒)
map$request_time$slow_request {
default0;
    ~^[5-9]\. 1;    # 5秒以上
    ~^[1-4]\.\d+ 1; # 1秒以上可根据需要调整
}
2. 站点配置文件示例 (/etc/nginx/conf.d/example.com.conf
)
server {
listen443 ssl http2;
server_name example.com;

ssl_certificate /etc/nginx/ssl/example.com.crt;
ssl_certificate_key /etc/nginx/ssl/example.com.key;

# 访问日志(JSON格式 + 滚动切割)
access_log /var/log/nginx/example.com.access.log json_analytics buffer=32k flush=5m;

# 错误日志分离
error_log /var/log/nginx/example.com.error.log warn;

location / {
proxy_pass http://backend;
proxy_set_header Host $host;
proxy_set_header X-Real-IP $remote_addr;

# 记录上游服务器详细信息
log_subrequeston;
    }

# 静态文件优化
location~* \.(jpg|jpeg|png|gif|ico|css|js)$ {
expires30d;
access_logoff;  # 可选:静态文件不记录日志
    }
}
三、日志管理与分析增强策略
1. 日志切割配置 /etc/logrotate.d/nginx
/var/log/nginx/*.log {
    daily
    missingok
    rotate 365       # 保留一年日志
    compress
    delaycompress    # 延迟压缩前一日的日志
    dateext          # 添加日期后缀
    dateformat -%Y%m%d
    sharedscripts
    postrotate
        bin/kill -USR1 $(cat /var/run/nginx.pid 2>/dev/null) 2>/dev/null || true
    endscript
}
2. 日志字段解析表
request_time | ||
upstream_time | ||
ssl_handshake_time | ||
request_length | ||
connection_requests | ||
slow_request | ||
status | ||
http_user_agent | ||
ssl_cipher |
3. 慢请求分析命令示例
统计TOP10慢请求:
jq -r 'select(.slow_request == "1") | "\(.request_time) \(.method) \(.uri)"' access.log |
sort -nr | head -n10分析耗时分布:
jq -r '.request_time | tonumber | floor' access.log |
awk '{count[$1]++} END {for (t in count) print t"s ->", count[t]}' | sort -n定位后端瓶颈:
jq -r 'select(.upstream_time != "-") | "\(.upstream_time) \(.uri)"' access.log |
sort -nr | head -n20
四、进阶监控集成
1. ELK Stack 日志分析
- Filebeat 配置 (
/etc/filebeat/filebeat.yml
): filebeat.inputs:
-type:log
paths:/var/log/nginx/*.access.log
json.keys_under_root:true
json.add_error_key:true
output.elasticsearch:
hosts: ["elasticsearch:9200"]
indices:
-index:"nginx-%{+yyyy.MM.dd}"
2. Prometheus + Grafana 监控
- 使用
nginx-lua-prometheus
模块: lua_shared_dict prometheus_metrics 10M;
init_by_lua_block {
prometheus = require("prometheus").init("prometheus_metrics")
metric_requests = prometheus:counter(
"nginx_http_requests_total", "Total HTTP requests", {"host", "status"})
metric_latency = prometheus:histogram(
"nginx_http_request_duration_seconds", "HTTP request latency", {"host"})
}
log_by_lua_block {
metric_requests:inc(1, {ngx.var.host, ngx.var.status})
metric_latency:observe(tonumber(ngx.var.request_time), {ngx.var.host})
}
五、安全注意事项
敏感字段脱敏:
map$http_cookie$filtered_cookie {
default"";
    ~'(user_session|token)=([^;]+)' "$1=****";
}

log_format json_analytics (... '"cookie": "$filtered_cookie"')日志目录权限:
chown -R nginx:nginx var/log/nginx
chmod 755 var/log/nginx
通过这套配置可实现:
✅ 毫秒级耗时分析:精准定位网络、SSL、应用各阶段瓶颈 ✅ 智能慢请求标记:快速识别需要优化的请求 ✅ 开箱即用的分析数据:适配ELK/Prometheus等主流监控系统 ✅ 安全合规性:敏感信息自动脱敏处理
文章转载自韩公子的Linux大集市,如果涉嫌侵权,请发送邮件至:contact@modb.pro进行举报,并提供相关证据,一经查实,墨天轮将立刻删除相关内容。
