


在日常开发和数据库管理中,SQL 性能优化始终是一个绕不开的话题。一条 SQL 查询可能在测试环境中表现良好,但到了生产环境却可能因为数据量的增加而变得异常缓慢。面对这种情况,开发者和 DBA 通常会借助 MySQL 的 EXPLAIN
工具来分析执行计划,但输出的表格信息往往晦涩难懂,尤其是面对复杂 SQL 时,如何快速定位性能瓶颈成了一个不小的挑战。
火焰图:性能分析的可视化利器
火焰图(Flame Graph)是一种可视化性能分析数据的图表,常用于展示程序在运行过程中各个函数(或方法)调用所消耗的时间和调用关系。它最早由Brendan Gregg提出,广泛应用于CPU性能分析、内存分配分析等领域。
火焰图的特点:
• 横轴:表示某个函数被采样到的次数(即消耗的总时间),越宽表示该函数消耗的时间越多。 • 纵轴:表示调用栈的深度,从下往上依次是被调用的函数。 • 每个矩形块:代表一个函数,块的宽度表示该函数及其所有子函数消耗的总时间。 • 颜色:通常没有特殊含义,只是为了区分不同的函数块。
用途:
• 快速定位性能瓶颈,找出哪些函数最耗时。 • 了解程序的调用关系和热点路径。
受Tanel Poder启发,他用火焰图把oracle的执行计划可视化了Visualizing SQL Plan Execution Time With FlameGraphs[1],那是不是也能用火焰图可视化MySQL的执行计划呢?
火焰图可视化 MySQL 执行计划
在 MySQL 8.0 之前,EXPLAIN
工具主要输出预估的执行路径和行数,缺乏真实的耗时数据。表格形式的呈现,尤其对于多层嵌套查询,执行顺序也不容易识别。这种情况下,开发者往往只能根据经验对 SQL 进行优化,而无法准确判断每个步骤的性能表现。这样的输出形式自然也是无法用火焰图可视化的。
EXPLAIN SELECT
    p.category,
    p.name as product_name,
    p.price,
    (
        SELECT COUNT(DISTINCT o.customer_id)
        FROM orders o
        WHERE o.product_id = p.product_id
        AND o.status ='completed'
    ) as unique_buyers,
    EXISTS (
        SELECT1
        FROM orders o2
        WHERE o2.product_id = p.product_id
        AND o2.order_date >= DATE_SUB(NOW(), INTERVAL 30 DAY)
    ) as has_recent_orders
FROM products p
WHERE p.stock <100
AND p.price > (
    SELECT AVG(price) *1.5
    FROM products
    WHERE category = p.category
)
ORDERBY p.category, unique_buyers DESC;
+----+--------------------+----------+------------+------+------------------------+------------+---------+-------------------+------+----------+----------------------------------------------+
| id | select_type        |table     | partitions | type | possible_keys          | key        | key_len |ref                | rows | filtered | Extra                                        |
+----+--------------------+----------+------------+------+------------------------+------------+---------+-------------------+------+----------+----------------------------------------------+
|   1| PRIMARY            | p        |NULL        |ALL   | NULL                   | NULL       | NULL    | NULL              |  100 |    33.33 | Using where; Using temporary; Using filesort |
|   4| DEPENDENT SUBQUERY | products |NULL        |ALL   | NULL                   | NULL       | NULL    | NULL              |  100 |    10.00 | Using where                                  |
|   3| DEPENDENT SUBQUERY | o2       |NULL        |ref   | product_id             | product_id | 5       | test.p.product_id |   37 |    33.33 | Using where                                  |
|   2| DEPENDENT SUBQUERY | o        |NULL        |ref   | customer_id,product_id | product_id | 5       | test.p.product_id |   37 |    10.00 | Using where                                  |
+----+--------------------+----------+------------+------+------------------------+------------+---------+-------------------+------+----------+----------------------------------------------+
MySQL 8.0 引入了 EXPLAIN ANALYZE
功能,相比 EXPLAIN
,它不仅展示查询的执行路径,还提供了实际执行过程中的关键性能指标,包括每一步操作的真实耗时(actual time)、读取的行数(rows)、执行次数(loops)等信息。用火焰图可视化 MySQL 执行计划似乎变得可行。
***************************1.row***************************
EXPLAIN: -> Sort: p.category, unique_buyers DESC  (actual time=2.23..2.23rows=4 loops=1)
    -> Stream results  (cost=10.2rows=33.3) (actual time=1.07..1.93rows=4 loops=1)
        ->Filter: ((p.stock <100) and (p.price > (select #4)))  (cost=10.2rows=33.3) (actual time=0.832..1.39rows=4 loops=1)
            ->Table scan on p  (cost=10.2rows=100) (actual time=0.0718..0.11rows=100 loops=1)
            ->Select #4 (subquery incondition; dependent)
                -> Aggregate: avg(products.price)  (cost=2.25rows=1) (actual time=0.0823..0.0823rows=1 loops=15)
                    ->Filter: (products.category = p.category)  (cost=1.25rows=10) (actual time=0.0497..0.078rows=27.1 loops=15)
                        ->Table scan on products  (cost=1.25rows=100) (actual time=0.0484..0.0641rows=100 loops=15)
->Select #2 (subquery in projection; dependent)
    -> Aggregate: count(distinct o.customer_id)  (cost=9.75rows=1) (actual time=0.079..0.079rows=1 loops=4)
        ->Filter: (o.`status` ='completed')  (cost=9.39rows=3.61) (actual time=0.0568..0.0744rows=16.8 loops=4)
            -> Index lookup on o using product_id (product_id=p.product_id)  (cost=9.39rows=36.1) (actual time=0.0558..0.0639rows=37 loops=4)
->Select #3 (subquery in projection; dependent)
    -> Limit: 1row(s)  (cost=10.2rows=1) (actual time=0.0499..0.0499rows=0 loops=4)
        ->Filter: (o2.order_date >=<cache>((now() -interval30day)))  (cost=10.2rows=12) (actual time=0.0497..0.0497rows=0 loops=4)
            -> Index lookup on o2 using product_id (product_id=p.product_id)  (cost=10.2rows=36.1) (actual time=0.0367..0.0446rows=37 loops=4)
随后我便试试着用火焰图来可视化它:
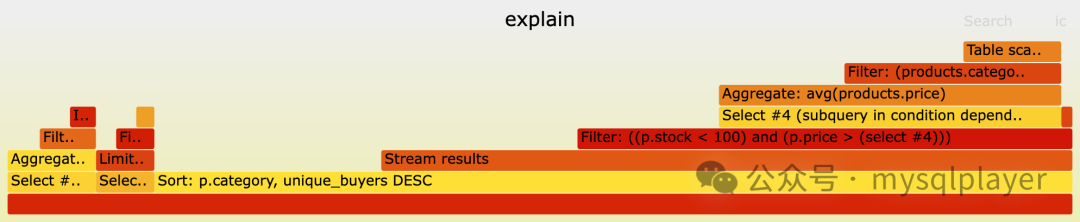
1. 清晰识别执行开销
火焰图通过宽度直观展示耗时,最宽的部分相对耗时最多的操作,无需逐行比对表格数据。2. 清晰展现嵌套结构
多层 join 或子查询关系通过火焰图的层级结构直观呈现,复杂 SQL 的逻辑关系一目了然。
MySQL Explain Flame Graph
我部署了在线服务:MySQL Explain Flame Graph[2]。开发者和DBA只需将 EXPLAIN ANALYZE
的输出粘贴到工具中,即可生成火焰图,也可以通过API一键生成。
命令行示例:
mysql -BNEe 'explain analyze sql_statement' | curl --data-binary @- http://sqlfg.dbcopilot.online/api/sqlflamegraph > explain.svg
总结
MySQL 8.0 的 EXPLAIN ANALYZE
功能为 SQL 性能分析提供了更多执行计划信息,利用火焰图方法让这些信息变得更加直观,开发者和 DBA 可以快速锁定性能瓶颈,让 SQL 调优更高效。
快去试试吧,如果对你用,请帮忙点赞❤️分享 😄
引用链接
[1]
Visualizing SQL Plan Execution Time With FlameGraphs: https://tanelpoder.com/posts/visualizing-sql-plan-execution-time-with-flamegraphs/[2]
MySQL Explain Flame Graph: http://sqlfg.dbcopilot.online/
