


ELK环境部署
【历史库存文档】
之前做的ELK的环境,只用了logstash作为收集日志的agent,而logstash消耗系统资源很大,在生产环境下将logstash作为agent和服务跑在一起并不理想,今天有空闲时间,在自己本地对原来的结构做了调整,收集日志的agent采用轻量的filebeat,并且中间使用redis进行数据写入的缓冲,整体架构如下图
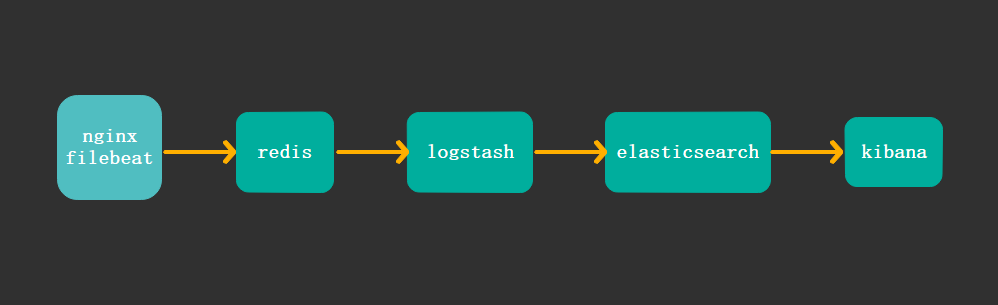
主机规划:
192.168.2.141 :部署应用 nginx, filebeat
192.168.2.142 :部署redis
192.168.2.143 :部署logstash
192.168.2.144 :部署elasticsearch
192.168.2.145 :部署kibana
部署nginx与filebeat
安装nginx
[root@nginx-filebeat ~]# yum install nginx -y
安装filebeat
[root@nginx-filebeat sowft]# yum install filebeat-5.6.10-x86_64.rpm -y
查看filebeat安装后的相关路径
[root@nginx-filebeat sowft]# rpm -ql filebeat
配置filebeat,将日志输出到redis
在
/etc/filebeat/filebeat.full.yml
文件中有对redis配置的内容,将里面的对应内容复制添加到/etc/filebeat/filebeat.yml
中,如下配置
#------------------------------- Redis output ----------------------------------
output.redis:
  # Boolean flag to enable or disable the output module.
  enabled: true

  # The list of Redis servers to connect to. If load balancing is enabled, the
  # events are distributed to the servers in the list. If one server becomes
  # unreachable, the events are distributed to the reachable servers only.
  hosts: ["192.168.2.142:6379"]

  # The Redis port to use if hosts does not contain a port number. The default
  # is 6379.
  port: 6379

  # The name of the Redis list or channel the events are published to. The
  # default is filebeat.
  key: filebeat

  # The password to authenticate with. The default is no authentication.
  #password:

  # The Redis database number where the events are published. The default is 0.
  db: 0

  # The Redis data type to use for publishing events. If the data type is list,
  # the Redis RPUSH command is used. If the data type is channel, the Redis
  # PUBLISH command is used. The default value is list.
  datatype: list
部署redis
[root@redis-server ~]# yum install reids -y
修改监听端口,其他设置可以暂不修改
bind 0.0.0.0
安装logstash
安装jdk
yum install java-1.8.0-openjdk-devel.x86_64 -y
安装logstash
[root@logstash logstash]# yum localinstall logstash-5.6.10.rpm -y
将logstash指令加入环境变量
[root@logstash ~]# vim /etc/profile.d/logstash.sh


export PATH=/usr/share/logstash/bin:$PATH
[root@logstash ~]# source /etc/profile.d/logstash.sh
修改vim /etc/logstash/jvm.options文件
-Xms1g
-Xmx1g
#两个值保持一样,如果不一样logstash无法传输文档到ESserver
测试logstash正确性
[root@logstash ~]# cd /etc/logstash/conf.d
[root@logstash conf.d]# vim test.conf

input {
        stdin{}

}

output {
        stdout{}
}
执行测试指令
[root@logstash conf.d]# logstash -f ./test.conf -t

Configuration OK
logstash上的配置文件暂时可以不配置,等部署完elasticsearch后在配置logstash的过滤规则,这里只做正确性测试即可
部署elasticsearch
安装jdk
[root@elastic ~]# yum install java-1.8.0-openjdk-devel.x86_64 -y
安装elasticsearch
[root@elastic opt]# yum install elasticsearch-5.6.10.rpm -y
修改配置
[root@elastic ~]# vim /etc/elasticsearch/elasticsearch.yml

cluster.name: my-application
node.name: node-1
path.data: /elk/data
path.logs: /elk/logs
network.host: 192.168.2.144
http.port: 9200
创建日志和数据目录
[root@elastic ~]# mkdir -p /elk/{data,logs}
将目录属主改为elasticsearch用户
[root@elastic ~]# chown -R elasticsearch.elasticsearch /elk/
启动服务
[root@elastic ~]# systemctl start elasticsearch
在nginx应创建测试数据访问
创建测试页面
[root@nginx-filebeat html]# for i in {1..150};do echo test$i > test$i.html;done
模拟不同地址访问生成日志
[root@nginx-filebeat ~]# while true; do ip=$[$RANDOM%223+1]; curl --header "X-Forwarded-For: $ip.33.22.100" http://192.168.2.141/test$ip.html; sleep 2;done
以上的配置可以自动测试访问nginx,并生成不同的ip地址段
配置logstash过滤规则
input {

#       file {
#
#               start_position => "end"
#               path => ["/var/log/nginx/access.log"]
#
#       }
# 以上file段配置是针对logstash作为agent端收集日志的场景使用,从本地文件输入

        redis {
         host => "192.168.2.142"
         port => "6379"
         key => "filebeat"    #这里的key要与filebeat.yml中定义的key相同
         data_type => "list"
#         threads => "5"
         db => "0"
    }

}

filter {
        grok {
         match => { "message" => "%{HTTPD_COMBINEDLOG}  \"%{DATA:realclient}\"" }
         remove_field => "message"

        }
#   \"%{DATA:realclient}\"  可以记录nginx的真实客户端地址

        date {
        match => [ "timestamp","dd/MMM/YYYY:H:m:s Z" ]
        remove_field => "timestamp"
        }


}

 output {
#                elasticsearch {       #输出到elasticsearch服务器,先输出到本地终端查看,没有问题后输出到elasticsearch
#                    hosts => "192.168.2.144:9200"
#                    index => "logstash-%{+YYYY.MM.dd}"
#                    document_type => "nginx_logs"
#                }

               stdout {            #输出到屏幕测试
                    codec => rubydebug
                }
            }
以上的logstash的日志输出格式如下:
{
        "request" => "/test1.html",
          "agent" => "\"curl/7.29.0\"",
         "offset" => 11699,
           "auth" => "-",
          "ident" => "-",
     "input_type" => "log",
           "verb" => "GET",
         "source" => "/var/log/nginx/access.log",
           "type" => "log",
       "referrer" => "\"-\"",
     "@timestamp" => 2018-09-27T08:35:35.000Z,
     "realclient" => "1.33.22.100",
       "response" => "200",
          "bytes" => "6",
       "clientip" => "192.168.2.141",
           "beat" => {
            "name" => "nginx-filebeat",
        "hostname" => "nginx-filebeat",
         "version" => "5.6.10"
    },
       "@version" => "1",
    "httpversion" => "1.1"
}
把配置文件中的配置output输出对象改为输出到elasticsearch
 output {
                elasticsearch {
                    hosts => "192.168.2.144:9200"
                    index => "logstash-%{+YYYY.MM.dd}"
                     document_type => "nginx_logs"
                }

#               stdout {   #输出到屏幕测试
#                    codec => rubydebug
#                }
            }
注意:/etc/logstash/conf.d/ 目录下的所有文件都会被加载,不仅仅是以.conf结尾的文件,所以正常情况下该目录只存在一个确定使用的配置文件,其他文件都不要放在这
启动logstash服务
systemctl start logstash
查看elasticsearch服务生成的数据文件,实时访问服务,看看数据文件大小是否变化
[root@logstash ~]# curl -XGET 192.168.2.144:9200/_cat/indices
yellow open logstash-2018.09.27 vOhS-Hq7RG-oAYTUJng91Q 5 1 93 0 560.7kb 560.7kb

[root@logstash ~]# curl -XGET 192.168.2.144:9200/_cat/indices
yellow open logstash-2018.09.27 vOhS-Hq7RG-oAYTUJng91Q 5 1 106 0 651.2kb 651.2kb

#最开头以yellow开头说明配置项有点小问题。
#这个地方以红黄蓝颜色标记数据传输状态。
#黄色是缺失索引文件副本,ESserver是以集群的方式工作的,但这里是单节点
部署配置kibana
[root@kibana opt]# yum localinstall kibana-5.6.1-x86_64.rpm -y
配置
server.port: 5601
server.host: "0.0.0.0"
server.name: "kibana"
elasticsearch.url: "http://192.168.2.144:9200"
启动
[root@kibana ~]# systemctl start kibana
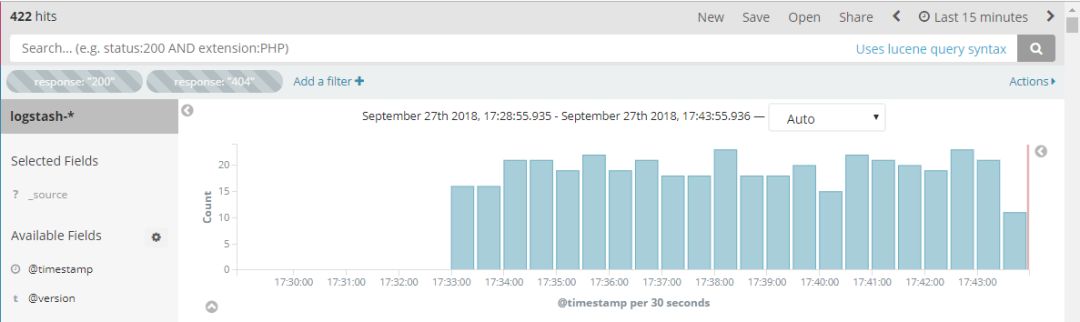
登录Kibana只需在浏览器数据kibana服务器地址+5601端口即可,经过访问测试,以上配置登录kibana调取日志访问成功
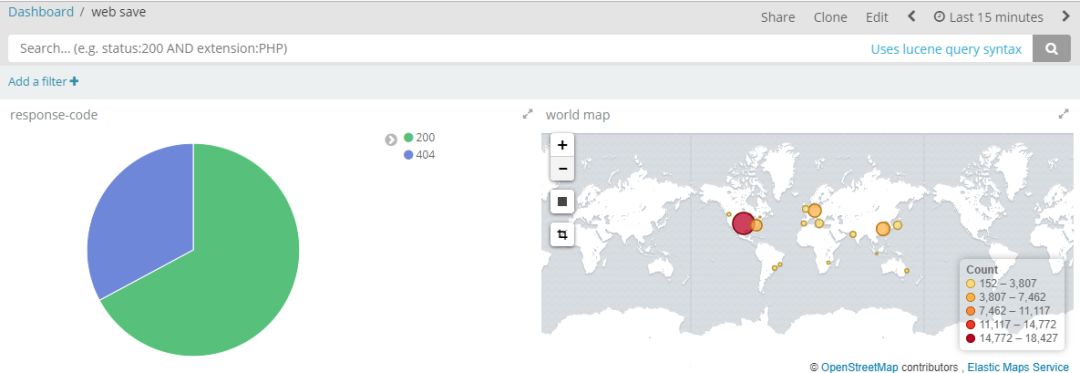
配置用户的ip归属地
ip地址的归属地查询需要使用互联网上的地图的解析库,地图的解析库会定期地更新,下载到服务器本地,解压,在logstash的配置文件中指定解压后的
.mmdb
后缀的文件路径
地图解析库下载地址:https://dev.maxmind.com/geoip/geoip2/geolite2/
logstash的配置文件添加 geoip段,最终配置段如下:
  redis {
         host => "192.168.2.142"
         port => "6379"
         key => "filebeat"
         data_type => "list"
#         threads => "5"
         db => "0"
    }

}

filter {
        grok {
         match => {
                "message" => "%{HTTPD_COMBINEDLOG} \"%{DATA:realclient}\""

                }

                 remove_field => "message"

        }

        date {
        match => [ "timestamp","dd/MMM/YYYY:H:m:s Z" ]
        remove_field => "timestamp"
        }


        geoip {            #ip地址归属配置段

                source => "realclient"
                target => "geoip"
                database => "/home/city/GeoLite2-City_20180925/GeoLite2-City.mmdb"
        }

}

 output {
                elasticsearch {
                    hosts => "192.168.2.144:9200"
                    index => "logstash-%{+YYYY.MM.dd}"
                     document_type => "nginx_logs"
                }

#  注意:
#   1、输出的日志文件名必须以“logstash-”开头,方可将geoip.location的type自动设定为"geo_point";
#    2、target => "geoip"

#               stdout {   #输出到屏幕调试
#                    codec => rubydebug
#                }
            }
至此,基于filebeat+redis+logstash+elasticsearch+kibana的日志收集系统部署完成
