


一、介绍
1.1 图像融合算法有哪些?
1.2 图像金字塔是什么?
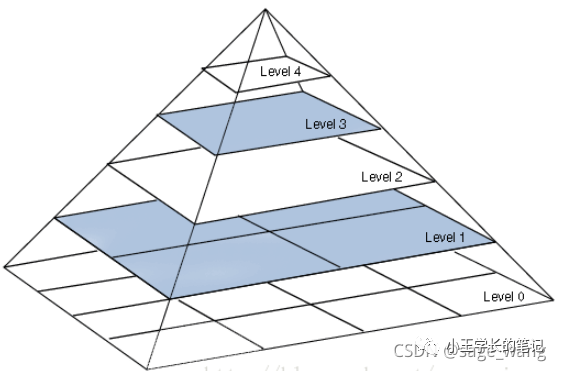
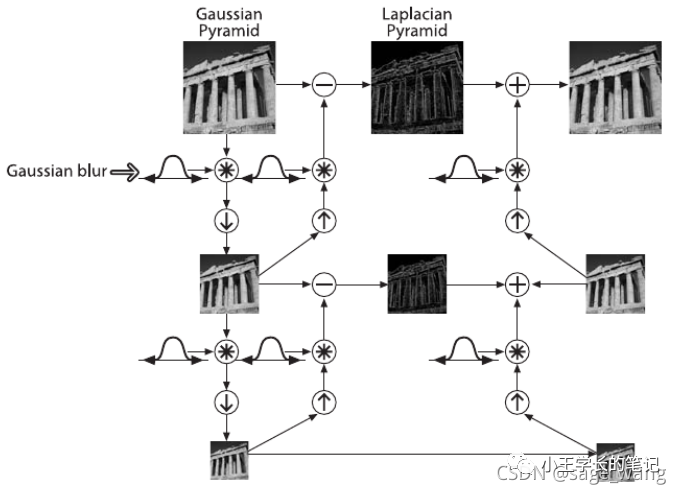
1.2 高斯金字塔是什么?
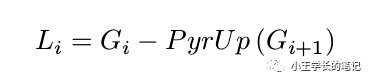
1.3 拉普拉斯金字塔
1.4 图像金字塔的应用场景是什么?
二、经典案例
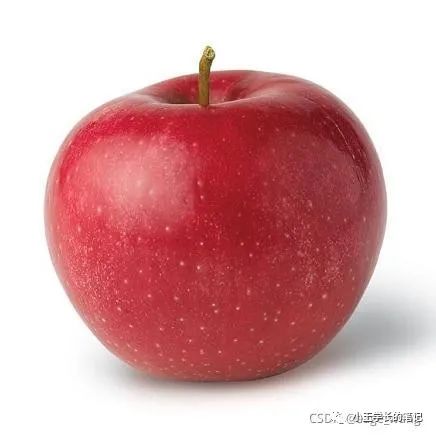
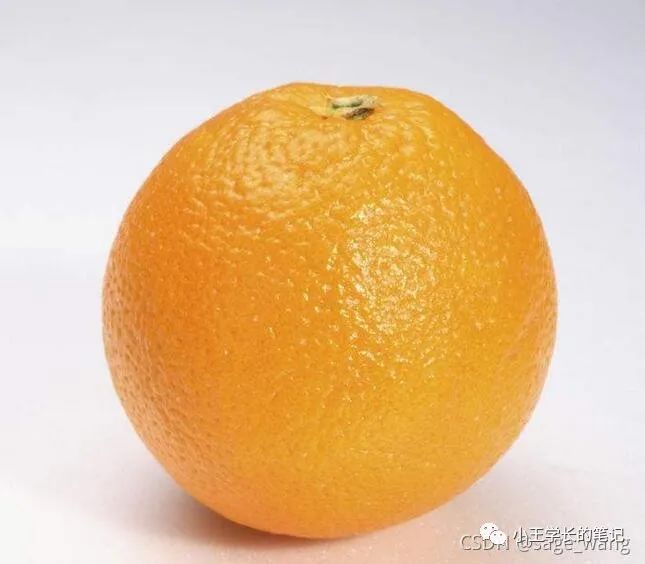
2.1 任务
2.2 步骤分解
2.3 代码展示
# -*- coding: utf-8 -*-
"""
Created on Sun Aug 29 15:54:08 2014
@author: sagewang
"""
import cv2
import numpy as np,sys
from matplotlib import pyplot as plt
A = cv2.imread('apple.jpg')
B = cv2.imread('orange.jpg')
dim = (512, 512)
A = cv2.resize(A, dim, interpolation = cv2.INTER_AREA)
B = cv2.resize(B, dim, interpolation = cv2.INTER_AREA)
# generate Gaussian pyramid for A
G = A.copy()
gpA = [G]
for i in np.arange(6):
G = cv2.pyrDown(G)
gpA.append(G)
# generate Gaussian pyramid for B
G = B.copy()
gpB = [G]
for i in np.arange(6):
G = cv2.pyrDown(G)
gpB.append(G)
# generate Laplacian Pyramid for A
lpA = [gpA[5]]
for i in np.arange(5,0,-1):
GE = cv2.pyrUp(gpA[i])
L = cv2.subtract(gpA[i-1],GE)
lpA.append(L)
# generate Laplacian Pyramid for B
lpB = [gpB[5]]
for i in np.arange(5,0,-1):
GE = cv2.pyrUp(gpB[i])
L = cv2.subtract(gpB[i-1],GE)
lpB.append(L)
# Now add left and right halves of images in each level
#numpy.hstack(tup)
#Take a sequence of arrays and stack them horizontally
#to make a single array.
LS = []
for la,lb in zip(lpA,lpB):
rows,cols,dpt = la.shape
# print(la.shape)
ls = np.hstack((la[:,0:cols//2], lb[:,cols//2:]))
LS.append(ls)
# now reconstruct
ls_ = LS[0]
for i in np.arange(1,6):
ls_ = cv2.pyrUp(ls_)
ls_ = cv2.add(ls_, LS[i])
rows,cols,dpt = A.shape
# 512, 512, 3
# print(A.shape)
# image with direct connecting each half
# real = np.hstack((A[:,:cols/2],B[:,cols/2:]))
real = np.hstack((A[:,:256],B[:,256:]))
cv2.imwrite('Pyramid_blending.jpg',ls_)
cv2.imwrite('Direct_blending.jpg',real)
# 解决彩色图像出现色差问题
# 1 彩色图像出现色差原因
# 使用cv2.imread()读取图像时,默认彩色图像的三通道顺序为B、G、R,这与我们所熟知的RGB中的R通道和B通道正好互换位置了。
# 而使用plt.imshow()函数却默认显示图像的通道顺序为R、G、B,导致图像出现色差发蓝。
# 2 灰度图像出现色差原因
# 那么为什么plt.imshow()显示灰度图(只有一个通道)还会出现色差呢?
# 上一段讲过,这是因为plt.imshow()函数默认显示三通道图像,把灰度图当作彩色图显示出来了,所以出现了发蓝的现象。
def bgr2rgb(img):
b,g,r = cv2.split(img) #分别提取B、G、R通道
img_new = cv2.merge([r,g,b]) #重新组合为R、G、B
return img_new
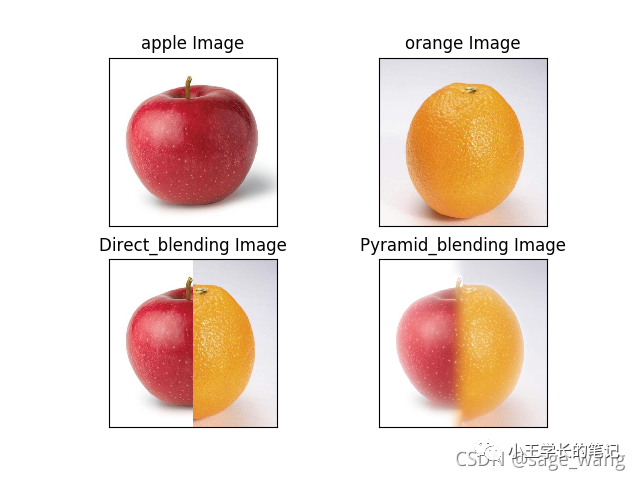
plt.subplot(221)
plt.imshow(bgr2rgb(A))
plt.title('apple Image'), plt.xticks([]), plt.yticks([])
plt.subplot(222)
plt.imshow(bgr2rgb(B))
plt.title('orange Image'), plt.xticks([]), plt.yticks([])
plt.subplot(223)
plt.imshow(bgr2rgb(real))
plt.title('Direct_blending Image'), plt.xticks([]), plt.yticks([])
plt.subplot(224)
plt.imshow(bgr2rgb(ls_))
plt.title('Pyramid_blending Image'), plt.xticks([]), plt.yticks([])
plt.show()
参考资料


文章转载自小王学长的笔记,如果涉嫌侵权,请发送邮件至:contact@modb.pro进行举报,并提供相关证据,一经查实,墨天轮将立刻删除相关内容。
