


1 matplotlib概述
matplotlib 是 Python 的绘图库。使用matplot可以方便地画出折线图、散点图、热力图、饼图等等
2 matplotlib安装
#pip
pip install matplotlib

#conda
conda install matplotlib
3 matplotlib使用
3.1 查看信息
import matplotlib as mpl

#打印版本信息
print(mpl.__version__)

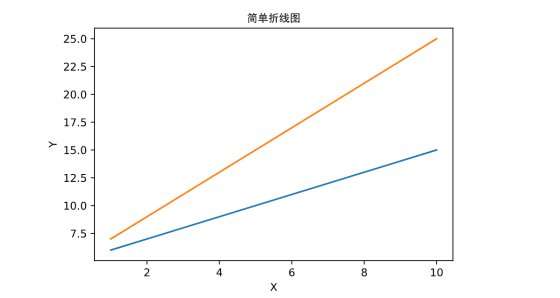
3.2 简单折线图绘制
import matplotlib.pyplot as plt
import numpy as np
# 以下两行代码解决jupyter notebook显示图片模糊问题
%matplotlib inline
%config InlineBackend.figure_format = 'svg'

x = np.linspace(1,10)
# y1=5+x
y1=5+x
plt.plot(x,y1)
# y2=5+2*x
y2=5+2*x
plt.plot(x,y2)
# 标题,支持中文
plt.title(u"简单折线图",fontproperties="SimHei")
plt.xlabel("X")
plt.ylabel("Y")
plt.show()
3.3 多图
import matplotlib.pyplot as plt
import numpy as np
# 以下两行代码解决jupyter notebook显示图片模糊问题
%matplotlib inline
%config InlineBackend.figure_format = 'svg'

# 多图,即创建多个画布
fig1 = plt.figure()
fig2 = plt.figure()
fig3 = plt.figure()

# 由于画布上没有图,所以会显示空白
plt.show()

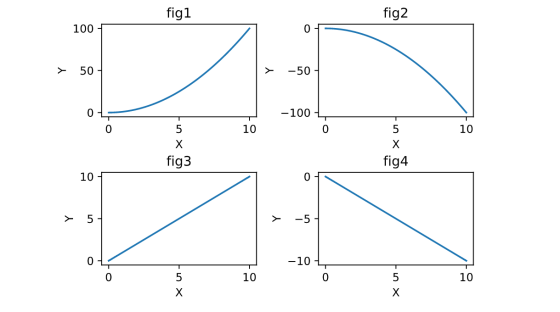
3.4子图
import matplotlib.pyplot as plt
import numpy as np
# 以下两行代码解决jupyter notebook显示图片模糊问题
%matplotlib inline
%config InlineBackend.figure_format = 'svg'

# 子图,即一个画布上画多个图
fig1 = plt.figure()
sf1 = fig1.add_subplot(221)
sf2 = fig1.add_subplot(222)
sf3 = fig1.add_subplot(223)
sf4 = fig1.add_subplot(224)

x = np.linspace(0,10,100)
y1 = x**2
y2 = -x**2
y3 = x
y4 = -x

# 绘图
sf1.plot(x,y1)
sf1.set_xlabel('X')
sf1.set_ylabel('Y')
sf1.set_title('fig1')

sf2.plot(x,y2)
sf2.set_xlabel('X')
sf2.set_ylabel('Y')
sf2.set_title('fig2')

sf3.plot(x,y3)
sf3.set_xlabel('X')
sf3.set_ylabel('Y')
sf3.set_title('fig3')

sf4.plot(x,y4)
sf4.set_xlabel('X')
sf4.set_ylabel('Y')
sf4.set_title('fig4')

plt.subplots_adjust(wspace =0.4, hspace =0.6)#调整子图间距

plt.show()
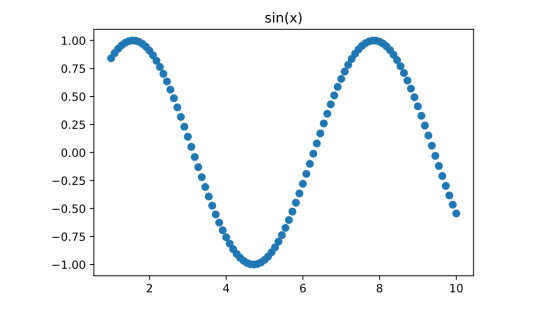
3.5 散点图
x = np.linspace(1, 10, 100)
y = np.sin(x)
# 散点图 scatter
plt.scatter(x, y)
plt.title('sin(x)')
plt.show()
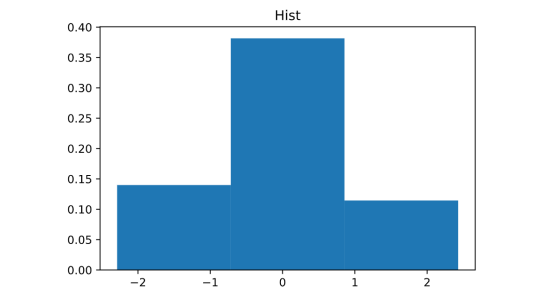
3.6 直方图
#直方图
x = np.random.randn(100)
# density = True 纵坐标归一化 bins=3表示三条柱子
plt.hist(x,density=True,bins=3)
plt.title("Hist")
plt.show()
3.7饼状图
# 饼状图
x=[0.4,0.1,0.1,0.4]
labels=["A","B","C","D"]
# shadow=True:阴影  explode:突出显示的权重
plt.pie(x,labels=labels,shadow=True,explode=[0.1,0,0,0.2])
plt.show()

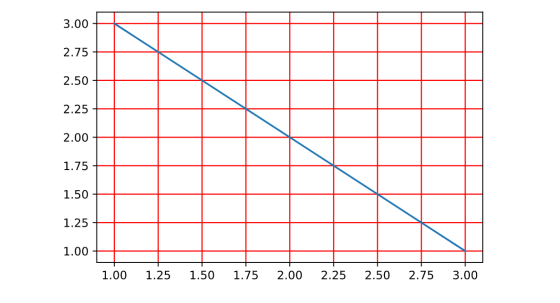
3.8 网格
import matplotlib.pyplot as plt
plt.plot([1,2,3],[3,2,1])
plt.grid(color="red",linewidth=1)
plt.show()
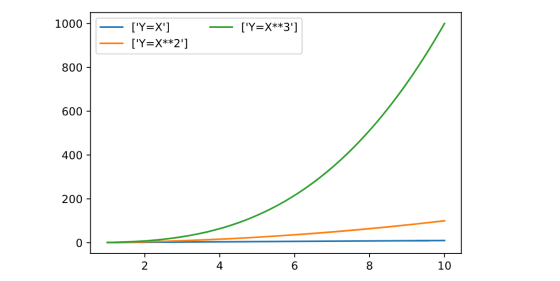
3.9 图例
import  matplotlib.pyplot as plt
import  numpy as np

x = np.linspace(1,10,1000)
y1=x
y2=x**2
y3=x**3

plt.plot(x,y1,label=["Y=X"])
plt.plot(x,y2,label=["Y=X**2"])
plt.plot(x,y3,label=["Y=X**3"])
# loc指定位置 0 1 2 3对应四个角
# ncol 指定图例分成几列
plt.legend(loc=0,ncol=2)
plt.show()
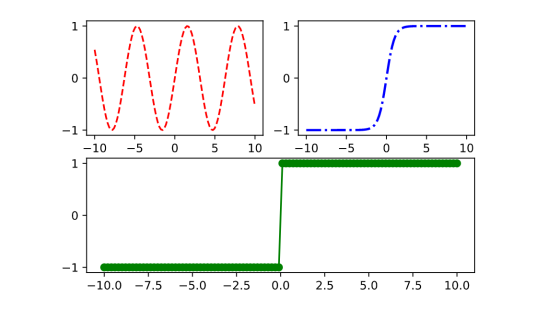
4 案例
import matplotlib.pyplot as plt
import numpy as np

fig = plt.figure()
ax1 = fig.add_subplot(221)
ax2 = fig.add_subplot(222)
ax3 = fig.add_subplot(212)

X = np.linspace(-10,10,100)
Y1=np.sin(X)
Y2=np.tanh(X)
Y3=np.sign(X)

ax1.plot(X,Y1,"r--")
ax2.plot(X,Y2,color="b",linestyle="-.",linewidth=2)
ax3.plot(X,Y3,"g-",marker="o")

plt.show()
文章转载自山人彤,如果涉嫌侵权,请发送邮件至:contact@modb.pro进行举报,并提供相关证据,一经查实,墨天轮将立刻删除相关内容。
