


简介
这个系列的第一篇中分享了使用nginx-lua-module监控Nginx的请求以便进行分析,监控请求主要是在应用层面,除了请求之外我们一般还需要监控经过nginx的流量、连接数等偏底层的数据,这些数据对分析nginx的性能比较重要下面我们看下如何对nginx流量进行监控
添加nginx-module-vts模块
1. 下载
git clone git://github.com/vozlt/nginx-module-vts.git
2.编译nginx 并添加该模块
下载nginx源码,并编译。
编译前先查看当前的nginx已经安装的模块,避免重新编译时漏掉了
nginx -v
带着原来的模块,再添加nginx-module-vts模块,进行编译。
./configure --add-module=/usr/local/src/nginx-module-vts
编辑nginx.conf
编辑nginx.conf,在http和server中加入配置信息。
http {
    vhost_traffic_status_zone;
    vhost_traffic_status_filter_by_host on; # 根据host分别进行流量统计
    ...
    server {
        ...
        location /status {
            vhost_traffic_status_display;
            vhost_traffic_status_display_format html;
        }
    }
}
注意:在不想监控的server中,可以单独关闭监控
server {
    vhost_traffic_status off;
}
访问ip:port/status即可查看到实时监控

prometheus + grafana
上图中,可以看到一个简易的面板,但想要查看详细的趋势图,还是要借助prometheus和grafana这两个神器。
首先,将ip:port/status/format/prometheus配置到prometheus的监控。
注:/format/可以转换出想要的各种数据格式,默认是html,还有json prometheus等等。

打开grafana,配置数据源。
下载图表模板,官网上针对nginx-module-vts有N种模板可用。
下载地址 https://grafana.com/grafana/dashboards?orderBy=name&direction=asc
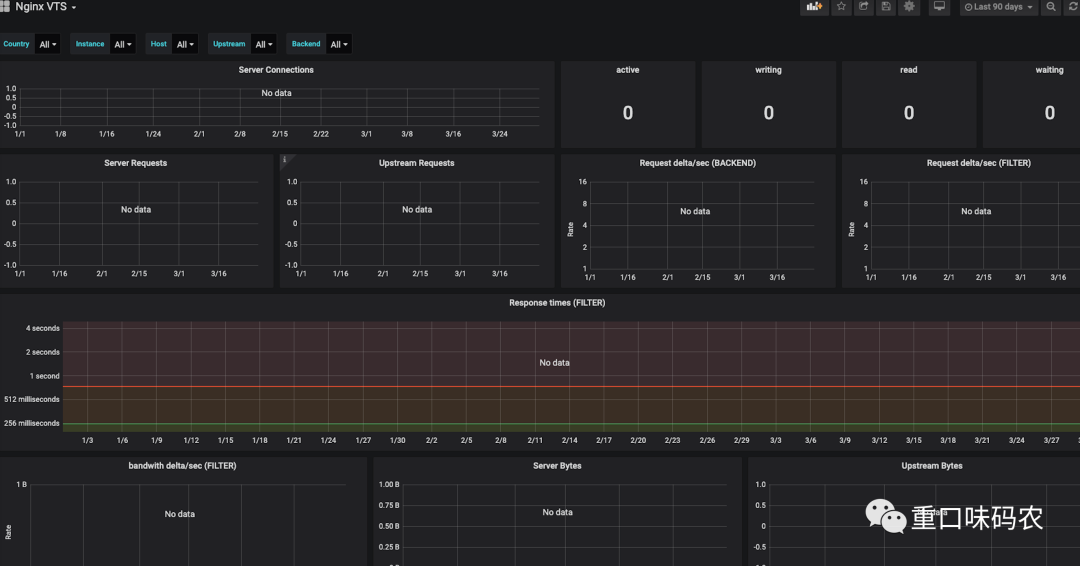
导入模板,选择数据源后,nginx的相关数据就会展示出来了。
各个监控项的含义
Nginx-module-vts提供了多种监控项,我们了解了监控项含义有助于帮助自己生成需要的图表。
# HELP nginx_vts_info Nginx info
# TYPE nginx_vts_info gauge
nginx_vts_info{hostname="hbhly_21_205",version="1.16.1"} 1
# HELP nginx_vts_start_time_seconds Nginx start time
# TYPE nginx_vts_start_time_seconds gauge
nginx_vts_start_time_seconds 1584268136.439
# HELP nginx_vts_main_connections Nginx connections
# TYPE nginx_vts_main_connections gauge

# 区分状态的nginx连接数
nginx_vts_main_connections{status="accepted"} 9271
nginx_vts_main_connections{status="active"} 7
nginx_vts_main_connections{status="handled"} 9271
nginx_vts_main_connections{status="reading"} 0
nginx_vts_main_connections{status="requests"} 438850
nginx_vts_main_connections{status="waiting"} 6
nginx_vts_main_connections{status="writing"} 1
# HELP nginx_vts_main_shm_usage_bytes Shared memory [ngx_http_vhost_traffic_status] info
# TYPE nginx_vts_main_shm_usage_bytes gauge

# 内存使用量
nginx_vts_main_shm_usage_bytes{shared="max_size"} 1048575
nginx_vts_main_shm_usage_bytes{shared="used_size"} 24689
nginx_vts_main_shm_usage_bytes{shared="used_node"} 7
# HELP nginx_vts_server_bytes_total The request/response bytes
# TYPE nginx_vts_server_bytes_total counter
# HELP nginx_vts_server_requests_total The requests counter
# TYPE nginx_vts_server_requests_total counter
# HELP nginx_vts_server_request_seconds_total The request processing time in seconds
# TYPE nginx_vts_server_request_seconds_total counter
# HELP nginx_vts_server_request_seconds The average of request processing times in seconds
# TYPE nginx_vts_server_request_seconds gauge
# HELP nginx_vts_server_request_duration_seconds The histogram of request processing time
# TYPE nginx_vts_server_request_duration_seconds histogram
# HELP nginx_vts_server_cache_total The requests cache counter
# TYPE nginx_vts_server_cache_total counter

# 分Host的进出流量
nginx_vts_server_bytes_total{host="10.160.21.205",direction="in"} 22921464
nginx_vts_server_bytes_total{host="10.160.21.205",direction="out"} 1098196005

# 分状态码的请求数量统计 1** 2** 3** 4** 5**
nginx_vts_server_requests_total{host="10.160.21.205",code="1xx"} 0
nginx_vts_server_requests_total{host="10.160.21.205",code="2xx"} 86809
nginx_vts_server_requests_total{host="10.160.21.205",code="3xx"} 0
nginx_vts_server_requests_total{host="10.160.21.205",code="4xx"} 2
nginx_vts_server_requests_total{host="10.160.21.205",code="5xx"} 0
nginx_vts_server_requests_total{host="10.160.21.205",code="total"} 86811

# 响应时间
nginx_vts_server_request_seconds_total{host="10.160.21.205"} 0.000
nginx_vts_server_request_seconds{host="10.160.21.205"} 0.000

# 分状态的缓存的统计
nginx_vts_server_cache_total{host="10.160.21.205",status="miss"} 0
nginx_vts_server_cache_total{host="10.160.21.205",status="bypass"} 0
nginx_vts_server_cache_total{host="10.160.21.205",status="expired"} 0
nginx_vts_server_cache_total{host="10.160.21.205",status="stale"} 0
nginx_vts_server_cache_total{host="10.160.21.205",status="updating"} 0
nginx_vts_server_cache_total{host="10.160.21.205",status="revalidated"} 0
nginx_vts_server_cache_total{host="10.160.21.205",status="hit"} 0
nginx_vts_server_cache_total{host="10.160.21.205",status="scarce"} 0
nginx_vts_server_bytes_total{host="devapi.feedback.test",direction="in"} 3044526
nginx_vts_server_bytes_total{host="devapi.feedback.test",direction="out"} 41257028

# 分状态的连接数的统计
nginx_vts_server_requests_total{host="devapi.feedback.test",code="1xx"} 0
nginx_vts_server_requests_total{host="devapi.feedback.test",code="2xx"} 3983
nginx_vts_server_requests_total{host="devapi.feedback.test",code="3xx"} 0
nginx_vts_server_requests_total{host="devapi.feedback.test",code="4xx"} 24
nginx_vts_server_requests_total{host="devapi.feedback.test",code="5xx"} 11
nginx_vts_server_requests_total{host="devapi.feedback.test",code="total"} 4018
nginx_vts_server_request_seconds_total{host="devapi.feedback.test"} 327.173
nginx_vts_server_request_seconds{host="devapi.feedback.test"} 0.000

# nginx缓存计算器,精确到状态和type
nginx_vts_server_cache_total{host="devapi.feedback.test",status="miss"} 0
nginx_vts_server_cache_total{host="devapi.feedback.test",status="bypass"} 0
nginx_vts_server_cache_total{host="devapi.feedback.test",status="expired"} 0
nginx_vts_server_cache_total{host="devapi.feedback.test",status="stale"} 0
nginx_vts_server_cache_total{host="devapi.feedback.test",status="updating"} 0
nginx_vts_server_cache_total{host="devapi.feedback.test",status="revalidated"} 0
nginx_vts_server_cache_total{host="devapi.feedback.test",status="hit"} 0
nginx_vts_server_cache_total{host="devapi.feedback.test",status="scarce"} 0
nginx_vts_server_bytes_total{host="testapi.feedback.test",direction="in"} 55553573
nginx_vts_server_bytes_total{host="testapi.feedback.test",direction="out"} 9667561188
nginx_vts_server_requests_total{host="testapi.feedback.test",code="1xx"} 0
nginx_vts_server_requests_total{host="testapi.feedback.test",code="2xx"} 347949
nginx_vts_server_requests_total{host="testapi.feedback.test",code="3xx"} 31
nginx_vts_server_requests_total{host="testapi.feedback.test",code="4xx"} 7
nginx_vts_server_requests_total{host="testapi.feedback.test",code="5xx"} 33
nginx_vts_server_requests_total{host="testapi.feedback.test",code="total"} 348020
nginx_vts_server_request_seconds_total{host="testapi.feedback.test"} 2185.177
nginx_vts_server_request_seconds{host="testapi.feedback.test"} 0.001
nginx_vts_server_cache_total{host="testapi.feedback.test",status="miss"} 0
nginx_vts_server_cache_total{host="testapi.feedback.test",status="bypass"} 0
nginx_vts_server_cache_total{host="testapi.feedback.test",status="expired"} 0
nginx_vts_server_cache_total{host="testapi.feedback.test",status="stale"} 0
nginx_vts_server_cache_total{host="testapi.feedback.test",status="updating"} 0
nginx_vts_server_cache_total{host="testapi.feedback.test",status="revalidated"} 0
nginx_vts_server_cache_total{host="testapi.feedback.test",status="hit"} 0
nginx_vts_server_cache_total{host="testapi.feedback.test",status="scarce"} 0
nginx_vts_server_bytes_total{host="*",direction="in"} 81519563
nginx_vts_server_bytes_total{host="*",direction="out"} 10807014221

# 分host请求数量统计
nginx_vts_server_requests_total{host="*",code="1xx"} 0
nginx_vts_server_requests_total{host="*",code="2xx"} 438741
nginx_vts_server_requests_total{host="*",code="3xx"} 31
nginx_vts_server_requests_total{host="*",code="4xx"} 33
nginx_vts_server_requests_total{host="*",code="5xx"} 44
nginx_vts_server_requests_total{host="*",code="total"} 438849
nginx_vts_server_request_seconds_total{host="*"} 2512.350
nginx_vts_server_request_seconds{host="*"} 0.007

# 分host缓存统计
nginx_vts_server_cache_total{host="*",status="miss"} 0
nginx_vts_server_cache_total{host="*",status="bypass"} 0
nginx_vts_server_cache_total{host="*",status="expired"} 0
nginx_vts_server_cache_total{host="*",status="stale"} 0
nginx_vts_server_cache_total{host="*",status="updating"} 0
nginx_vts_server_cache_total{host="*",status="revalidated"} 0
nginx_vts_server_cache_total{host="*",status="hit"} 0
nginx_vts_server_cache_total{host="*",status="scarce"} 0
# HELP nginx_vts_upstream_bytes_total The request/response bytes
# TYPE nginx_vts_upstream_bytes_total counter
# HELP nginx_vts_upstream_requests_total The upstream requests counter
# TYPE nginx_vts_upstream_requests_total counter
# HELP nginx_vts_upstream_request_seconds_total The request Processing time including upstream in seconds
# TYPE nginx_vts_upstream_request_seconds_total counter
# HELP nginx_vts_upstream_request_seconds The average of request processing times including upstream in seconds
# TYPE nginx_vts_upstream_request_seconds gauge
# HELP nginx_vts_upstream_response_seconds_total The only upstream response processing time in seconds
# TYPE nginx_vts_upstream_response_seconds_total counter
# HELP nginx_vts_upstream_response_seconds The average of only upstream response processing times in seconds
# TYPE nginx_vts_upstream_response_seconds gauge
# HELP nginx_vts_upstream_request_duration_seconds The histogram of request processing time including upstream
# TYPE nginx_vts_upstream_request_duration_seconds histogram
# HELP nginx_vts_upstream_response_duration_seconds The histogram of only upstream response processing time
# TYPE nginx_vts_upstream_response_duration_seconds histogram

# 分upstream流量统计
nginx_vts_upstream_bytes_total{upstream="::nogroups",backend="10.144.227.162:80",direction="in"} 12296
nginx_vts_upstream_bytes_total{upstream="::nogroups",backend="10.144.227.162:80",direction="out"} 13582924
nginx_vts_upstream_requests_total{upstream="::nogroups",backend="10.144.227.162:80",code="1xx"} 0
nginx_vts_upstream_requests_total{upstream="::nogroups",backend="10.144.227.162:80",code="2xx"} 25
nginx_vts_upstream_requests_total{upstream="::nogroups",backend="10.144.227.162:80",code="3xx"} 0
nginx_vts_upstream_requests_total{upstream="::nogroups",backend="10.144.227.162:80",code="4xx"} 0
nginx_vts_upstream_requests_total{upstream="::nogroups",backend="10.144.227.162:80",code="5xx"} 0
nginx_vts_upstream_requests_total{upstream="::nogroups",backend="10.144.227.162:80",code="total"} 25
nginx_vts_upstream_request_seconds_total{upstream="::nogroups",backend="10.144.227.162:80"} 1.483
nginx_vts_upstream_request_seconds{upstream="::nogroups",backend="10.144.227.162:80"} 0.000
nginx_vts_upstream_response_seconds_total{upstream="::nogroups",backend="10.144.227.162:80"} 1.484
nginx_vts_upstream_response_seconds{upstream="::nogroups",backend="10.144.227.162:80"} 0.000
nginx_vts_upstream_bytes_total{upstream="::nogroups",backend="10.152.218.149:80",direction="in"} 12471
nginx_vts_upstream_bytes_total{upstream="::nogroups",backend="10.152.218.149:80",direction="out"} 11790508
nginx_vts_upstream_requests_total{upstream="::nogroups",backend="10.152.218.149:80",code="1xx"} 0
nginx_vts_upstream_requests_total{upstream="::nogroups",backend="10.152.218.149:80",code="2xx"} 24
nginx_vts_upstream_requests_total{upstream="::nogroups",backend="10.152.218.149:80",code="3xx"} 0
nginx_vts_upstream_requests_total{upstream="::nogroups",backend="10.152.218.149:80",code="4xx"} 0
nginx_vts_upstream_requests_total{upstream="::nogroups",backend="10.152.218.149:80",code="5xx"} 0
nginx_vts_upstream_requests_total{upstream="::nogroups",backend="10.152.218.149:80",code="total"} 24
nginx_vts_upstream_request_seconds_total{upstream="::nogroups",backend="10.152.218.149:80"} 1.169
nginx_vts_upstream_request_seconds{upstream="::nogroups",backend="10.152.218.149:80"} 0.000
nginx_vts_upstream_response_seconds_total{upstream="::nogroups",backend="10.152.218.149:80"} 1.168
nginx_vts_upstream_response_seconds{upstream="::nogroups",backend="10.152.218.149:80"} 0.000
nginx_vts_upstream_bytes_total{upstream="::nogroups",backend="10.160.21.205:8081",direction="in"} 3036924
nginx_vts_upstream_bytes_total{upstream="::nogroups",backend="10.160.21.205:8081",direction="out"} 33355357
nginx_vts_upstream_requests_total{upstream="::nogroups",backend="10.160.21.205:8081",code="1xx"} 0
nginx_vts_upstream_requests_total{upstream="::nogroups",backend="10.160.21.205:8081",code="2xx"} 3971
nginx_vts_upstream_requests_total{upstream="::nogroups",backend="10.160.21.205:8081",code="3xx"} 0
nginx_vts_upstream_requests_total{upstream="::nogroups",backend="10.160.21.205:8081",code="4xx"} 24
nginx_vts_upstream_requests_total{upstream="::nogroups",backend="10.160.21.205:8081",code="5xx"} 11
nginx_vts_upstream_requests_total{upstream="::nogroups",backend="10.160.21.205:8081",code="total"} 4006
nginx_vts_upstream_request_seconds_total{upstream="::nogroups",backend="10.160.21.205:8081"} 326.427
nginx_vts_upstream_request_seconds{upstream="::nogroups",backend="10.160.21.205:8081"} 0.000
nginx_vts_upstream_response_seconds_total{upstream="::nogroups",backend="10.160.21.205:8081"} 300.722
nginx_vts_upstream_response_seconds{upstream="::nogroups",backend="10.160.21.205:8081"} 0.000
nginx_vts_upstream_bytes_total{upstream="::nogroups",backend="10.160.21.205:8082",direction="in"} 55536408
nginx_vts_upstream_bytes_total{upstream="::nogroups",backend="10.160.21.205:8082",direction="out"} 9650089427
nginx_vts_upstream_requests_total{upstream="::nogroups",backend="10.160.21.205:8082",code="1xx"} 0
nginx_vts_upstream_requests_total{upstream="::nogroups",backend="10.160.21.205:8082",code="2xx"} 347912
nginx_vts_upstream_requests_total{upstream="::nogroups",backend="10.160.21.205:8082",code="3xx"} 31
nginx_vts_upstream_requests_total{upstream="::nogroups",backend="10.160.21.205:8082",code="4xx"} 7
nginx_vts_upstream_requests_total{upstream="::nogroups",backend="10.160.21.205:8082",code="5xx"} 33
nginx_vts_upstream_requests_total{upstream="::nogroups",backend="10.160.21.205:8082",code="total"} 347983
nginx_vts_upstream_request_seconds_total{upstream="::nogroups",backend="10.160.21.205:8082"} 2183.271
nginx_vts_upstream_request_seconds{upstream="::nogroups",backend="10.160.21.205:8082"} 0.001
nginx_vts_upstream_response_seconds_total{upstream="::nogroups",backend="10.160.21.205:8082"} 2180.893
nginx_vts_upstream_response_seconds{upstream="::nogroups",backend="10.160.21.205:8082"} 0.001
通过这些指标,可以精确地统计到经过nginx的流量,进而对nginx的性能进行监控。
本文首发于重口味博客(http://www.gscoder.cn)
