


一、Nginx监控的重要性
在服务端性能监控领域中,Nginx是其中非常重要的一部分,不仅仅是因为它是所有请求的入口、必经之处。还因为它的日志包含了请求的关键信息,像每次请求的返回状态码、处理时间、由哪一台后端机器处理,从这些信息里面,能分析出请求的处理情况,从中定位到有问题的请求,为我们的性能优化提供很重要的参考。
网络上常见的Nginx监控,一般是通过nginx-module-vts模块,使用这个模块,能获取到某个模块的分域名请求数量、1xx 2xx的请求占比,和nginx的进出流量,因为只能获取到统计数据,对监控nginx正常运行能启动一定作用,但对实际请求分析作用不大。
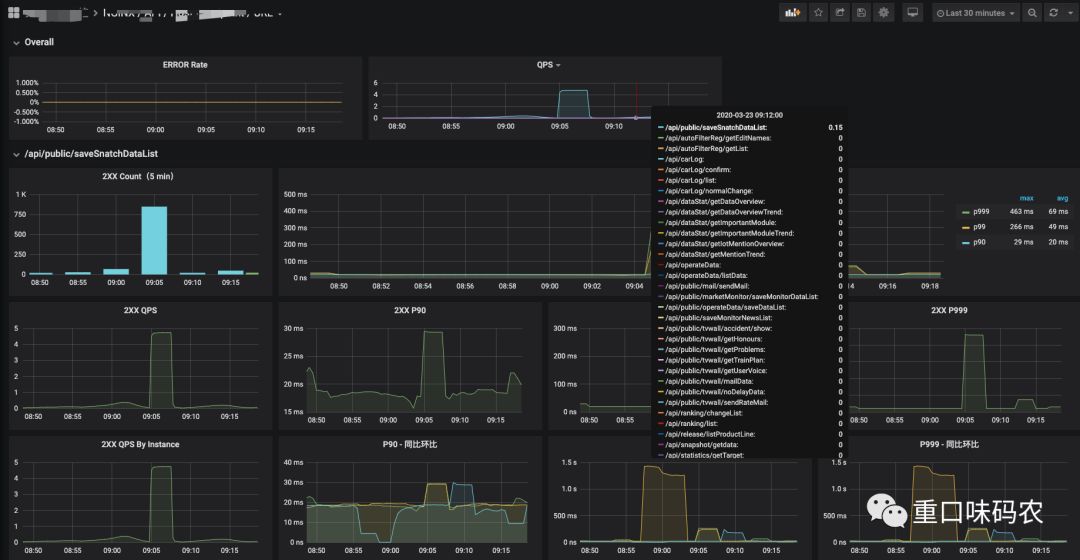
今天我们要采用的是借助lua脚本的形式,对Nginx的请求进行具体到url的监控,通过grafana提供多维度的数据分析。先上图,最终能对每个Url进行非常详细的请求监控
二、配置Nginx
1、Nginx支持lua
首先nginx当然要支持lua脚本,这个可以进行验证,当然一般nginx默认是不会安装支持这个模块的,需要进行重新编译,这里提供两种方式。如下
①直接使用openresty
openresty是基于 Nginx 与 Lua 的高性能 Web 平台,其内部集成了大量精良的 Lua 库、第三方模块以及大多数的依赖项。用于方便地搭建能够处理超高并发、扩展性极高的动态 Web 应用、Web 服务和动态网关。
建议懒得动手的同学可以直接安装openresty,使用起来和只用nginx并没有区别,相反包含了很多第三方模块,省了很多麻烦。
②安装nginx-lua-module
nginx-lua-module是nginx的一个模块,可以支持nginx运行lua脚本,需要重新编译nginx,这个步骤晚上的教程有很多,可以参考https://blog.csdn.net/qq_25551295/article/details/51744815。
2、配置nginx.conf
需要在conf文件夹进行配置lua脚本。
① conf.d
创建conf.d文件夹,新建文件counter.conf,写入内容
# Please copy to nginx's conf.d directory
# Set search paths for pure Lua external libraries (';;' is the default path):
lua_package_path "/usr/local/openresty/nginx/conf/conf.d/?.lua;;/usr/local/openresty/nginx/conf/lua/?.lua;;";

# Set Prometheus global dict
lua_shared_dict prometheus_metrics 10M; #init 10M memory
lua_shared_dict uri_by_host 10M;
lua_shared_dict global_set 1M;
# Development option, if deploy production, pls cache on!
lua_code_cache off;

init_by_lua_block {
    counter = require 'counter'
    counter.init()
}

log_by_lua_block {
    counter.log()
}

# Expose prometheus's metrics scrape port
server {
    listen 9145;
    allow all;
    deny all;
    access_log off;
    location /metrics {
        content_by_lua 'prometheus:collect()';
    }
}
②lua文件夹
创建lua文件夹,创建两个文件 counter.lua prometheus.lua 内容如下:
counter.lua
end
local function split(inputstr, sep)
    if sep == nil then
        sep = "%s"
    end
    local t={} ; i=1
    for str in string.gmatch(inputstr, "([^"..sep.."]+)") do
        t[i] = str
        i = i + 1
    end
    return t
end
local function parse_fullurl(request_uri)
    result_table = {}
    if string.find(request_uri, "%.") ~= nil then
       return nil
    end
    parts = split(request_uri, "/")
    if table.getn(parts) == 1 then
       return nil
    end
    for j=1, #parts do
       if(j == 1) then
           endpoint = "/"..parts[j]
           fullurl = "/"..parts[j]
       elseif(j <= 5) then
           if tonumber(parts[j]) ~= nil then
               break
           end
           fullurl = fullurl.."/"..parts[j]
       else
           break
       end
    end
    result_table["endpoint"] = endpoint
    result_table["fullurl"] = fullurl
    return result_table
end
function _M.log()
    local request_host = ngx.var.host
    local request_uri = ngx.unescape_uri(ngx.var.uri)
    local request_status = ngx.var.status
    local request_scheme = ngx.var.scheme
    local request_method = ngx.var.request_method
    local remote_ip = ngx.var.remote_addr
    local ngx_sent = ngx.var.body_bytes_sent
    local latency = ngx.var.upstream_response_time or 0


    result_table = parse_fullurl(request_uri)
    if result_table == nil then
        return
    end
    ngx_log(ngx_err,"latency=", tonumber(latency), ",status=", request_status, ",endpoint=", result_table["endpoint"], ",fullurl=", result_table["fullurl"])
    metric_latency:observe(tonumber(latency), {request_host, request_status, request_scheme, request_method, result_table["endpoint"], result_table["fullurl"]})
end
return _M
prometheus.lua
-- vim: ts=2:sw=2:sts=2:expandtab
--
-- This module uses a single dictionary shared between Nginx workers to keep
-- all metrics. Each counter is stored as a separate entry in that dictionary,
-- which allows us to increment them using built-in `incr` method.
--
-- Prometheus requires that (a) all samples for a given metric are presented
-- as one uninterrupted group, and (b) buckets of a histogram appear in
-- increasing numerical order. We satisfy that by carefully constructing full
-- metric names (i.e. metric name along with all labels) so that they meet
-- those requirements while being sorted alphabetically. In particular:
--
--  * all labels for a given metric are presented in reproducible order (the one
--    used when labels were declared). "le" label for histogram metrics always
--    goes last;
--  * bucket boundaries (which are exposed as values of the "le" label) are
--    presented as floating point numbers with leading and trailing zeroes.
--    Number of of zeroes is determined for each bucketer automatically based on
--    bucket boundaries;
--  * internally "+Inf" bucket is stored as "Inf" (to make it appear after
--    all numeric buckets), and gets replaced by "+Inf" just before we
--    expose the metrics.
--
-- For example, if you define your bucket boundaries as {0.00005, 10, 1000}
-- then we will keep the following samples for a metric `m1` with label
-- `site` set to `site1`:
--
--   m1_bucket{site="site1",le="0000.00005"}
--   m1_bucket{site="site1",le="0010.00000"}
--   m1_bucket{site="site1",le="1000.00000"}
--   m1_bucket{site="site1",le="Inf"}
--   m1_count{site="site1"}
--   m1_sum{site="site1"}
--
-- "Inf" will be replaced by "+Inf" while publishing metrics.
--
-- You can find the latest version and documentation at
-- https://github.com/knyar/nginx-lua-prometheus
-- Released under MIT license.


-- Default set of latency buckets, 5ms to 10s:
local DEFAULT_BUCKETS = {0.005, 0.01, 0.02, 0.03, 0.05, 0.075, 0.1, 0.2, 0.3,
                         0.4, 0.5, 0.75, 1, 1.5, 2, 3, 4, 5, 10}

-- Metric is a "parent class" for all metrics.
local Metric = {}
function Metric:new(o)
  o = o or {}
  setmetatable(o, self)
  self.__index = self
  return o
end

-- Checks that the right number of labels values have been passed.
--
-- Args:
--   label_values: an array of label values.
--
-- Returns:
--   an error message or nil
function Metric:check_label_values(label_values)
  if self.label_names == nil and label_values == nil then
    return
  elseif self.label_names == nil and label_values ~= nil then
    return "Expected no labels for " .. self.name .. ", got " ..  #label_values
  elseif label_values == nil and self.label_names ~= nil then
    return "Expected " .. #self.label_names .. " labels for " ..
           self.name .. ", got none"
  elseif #self.label_names ~= #label_values then
    return "Wrong number of labels for " .. self.name .. ". Expected " ..
           #self.label_names .. ", got " .. #label_values
  else
    for i, k in ipairs(self.label_names) do
      if label_values[i] == nil then
        return "Unexpected nil value for label " .. k ..  " of " .. self.name
      end
    end
  end
end

local Counter = Metric:new()
-- Increase a given counter by `value`
--
-- Args:
--   value: (number) a value to add to the counter. Defaults to 1 if skipped.
--   label_values: an array of label values. Can be nil (i.e. not defined) for
--     metrics that have no labels.
function Counter:inc(value, label_values)
  local err = self:check_label_values(label_values)
  if err ~= nil then
    self.prometheus:log_error(err)
    return
  end
  if value ~= nil and value < 0 then
    self.prometheus:log_error_kv(self.name, value, "Value should not be negative")
    return
  end

  self.prometheus:inc(self.name, self.label_names, label_values, value or 1)
end

local Gauge = Metric:new()
-- Set a given gauge to `value`
--
-- Args:
--   value: (number) a value to set the gauge to. Should be defined.
--   label_values: an array of label values. Can be nil (i.e. not defined) for
--     metrics that have no labels.
function Gauge:set(value, label_values)
  if value == nil then
    self.prometheus:log_error("No value passed for " .. self.name)
    return
  end
  local err = self:check_label_values(label_values)
  if err ~= nil then
    self.prometheus:log_error(err)
    return
  end
  self.prometheus:set(self.name, self.label_names, label_values, value)
end


-- Increase a given gauge by `value`
--
-- Args:
--   value: (number) a value to add to the gauge (a negative value when you
--     need to decrease the value of the gauge). Defaults to 1 if skipped.
--   label_values: an array of label values. Can be nil (i.e. not defined) for
--     metrics that have no labels.
function Gauge:inc(value, label_values)
  local err = self:check_label_values(label_values)
  if err ~= nil then
    self.prometheus:log_error(err)
    return
  end
  self.prometheus:inc(self.name, self.label_names, label_values, value or 1)
end

local Histogram = Metric:new()
-- Record a given value in a histogram.
--
-- Args:
--   value: (number) a value to record. Should be defined.
--   label_values: an array of label values. Can be nil (i.e. not defined) for
--     metrics that have no labels.
function Histogram:observe(value, label_values)
  if value == nil then
    self.prometheus:log_error("No value passed for " .. self.name)
    return
  end
  local err = self:check_label_values(label_values)
  if err ~= nil then
    self.prometheus:log_error(err)
    return
  end
  self.prometheus:histogram_observe(self.name, self.label_names, label_values, value)
end

local Prometheus = {}
Prometheus.__index = Prometheus
Prometheus.initialized = false

-- Generate full metric name that includes all labels.
--
-- Args:
--   name: string
--   label_names: (array) a list of label keys.
--   label_values: (array) a list of label values.
-- Returns:
--   (string) full metric name.
local function full_metric_name(name, label_names, label_values)
  if not label_names then
    return name
  end
  local label_parts = {}
  for idx, key in ipairs(label_names) do
    local label_value = (string.format("%s", label_values[idx])
      :gsub("[^\032-\126]", "")  -- strip non-printable characters
      :gsub("\\", "\\\\")
      :gsub('"', '\\"'))
    table.insert(label_parts, key .. '="' .. label_value .. '"')
  end
  return name .. "{" .. table.concat(label_parts, ",") .. "}"
end

-- Construct bucket format for a list of buckets.
--
-- This receives a list of buckets and returns a sprintf template that should
-- be used for bucket boundaries to make them come in increasing order when
-- sorted alphabetically.
--
-- To re-phrase, this is where we detect how many leading and trailing zeros we
-- need.
--
-- Args:
--   buckets: a list of buckets
--
-- Returns:
--   (string) a sprintf template.
local function construct_bucket_format(buckets)
  local max_order = 1
  local max_precision = 1
  for _, bucket in ipairs(buckets) do
    assert(type(bucket) == "number", "bucket boundaries should be numeric")
    -- floating point number with all trailing zeros removed
    local as_string = string.format("%f", bucket):gsub("0*$", "")
    local dot_idx = as_string:find(".", 1, true)
    max_order = math.max(max_order, dot_idx - 1)
    max_precision = math.max(max_precision, as_string:len() - dot_idx)
  end
  return "%0" .. (max_order + max_precision + 1) .. "." .. max_precision .. "f"
end

-- Extract short metric name from the full one.
--
-- Args:
--   full_name: (string) full metric name that can include labels.
--
-- Returns:
--   (string) short metric name with no labels. For a `*_bucket` metric of
--     histogram the _bucket suffix will be removed.
local function short_metric_name(full_name)
  local labels_start, _ = full_name:find("{")
  if not labels_start then
    -- no labels
    return full_name
  end
  local suffix_idx, _ = full_name:find("_bucket{")
  if suffix_idx and full_name:find("le=") then
    -- this is a histogram metric
    return full_name:sub(1, suffix_idx - 1)
  end
  -- this is not a histogram metric
  return full_name:sub(1, labels_start - 1)
end

-- Makes a shallow copy of a table
local function copy_table(table)
  local new = {}
  if table ~= nil then
    for k, v in ipairs(table) do
      new[k] = v
    end
  end
  return new
end

-- Check metric name and label names for correctness.
--
-- Regular expressions to validate metric and label names are
-- documented in https://prometheus.io/docs/concepts/data_model/
--
-- Args:
--   metric_name: (string) metric name.
--   label_names: label names (array of strings).
--
-- Returns:
--   Either an error string, or nil of no errors were found.
local function check_metric_and_label_names(metric_name, label_names)
  if not metric_name:match("^[a-zA-Z_:][a-zA-Z0-9_:]*$") then
    return "Metric name '" .. metric_name .. "' is invalid"
  end
  for _, label_name in ipairs(label_names or {}) do
    if label_name == "le" then
      return "Invalid label name 'le' in " .. metric_name
    end
    if not label_name:match("^[a-zA-Z_][a-zA-Z0-9_]*$") then
      return "Metric '" .. metric_name .. "' label name '" .. label_name ..
             "' is invalid"
    end
  end
end

-- Initialize the module.
--
-- This should be called once from the `init_by_lua` section in nginx
-- configuration.
--
-- Args:
--   dict_name: (string) name of the nginx shared dictionary which will be
--     used to store all metrics
--   prefix: (optional string) if supplied, prefix is added to all
--   metric names on output
--
-- Returns:
--   an object that should be used to register metrics.
function Prometheus.init(dict_name, prefix)
  local self = setmetatable({}, Prometheus)
  dict_name = dict_name or "prometheus_metrics"
  self.dict = ngx.shared[dict_name]
  if self.dict == nil then
    ngx.log(ngx.ERR,
      "Dictionary '", dict_name, "' does not seem to exist. ",
      "Please define the dictionary using `lua_shared_dict`.")
    return self
  end
  self.help = {}
  if prefix then
    self.prefix = prefix
  else
    self.prefix = ''
  end
  self.type = {}
  self.registered = {}
  self.buckets = {}
  self.bucket_format = {}
  self.initialized = true

  self:counter("nginx_metric_errors_total",
    "Number of nginx-lua-prometheus errors")
  self.dict:set("nginx_metric_errors_total", 0)
  return self
end

function Prometheus:log_error(...)
  ngx.log(ngx.ERR, ...)
  self.dict:incr("nginx_metric_errors_total", 1)
end

function Prometheus:log_error_kv(key, value, err)
  self:log_error(
    "Error while setting '", key, "' to '", value, "': '", err, "'")
end

-- Register a counter.
--
-- Args:
--   name: (string) name of the metric. Required.
--   description: (string) description of the metric. Will be used for the HELP
--     comment on the metrics page. Optional.
--   label_names: array of strings, defining a list of metrics. Optional.
--
-- Returns:
--   a Counter object.
function Prometheus:counter(name, description, label_names)
  if not self.initialized then
    ngx.log(ngx.ERR, "Prometheus module has not been initialized")
    return
  end

  local err = check_metric_and_label_names(name, label_names)
  if err ~= nil then
    self:log_error(err)
    return
  end

  if self.registered[name] then
    self:log_error("Duplicate metric " .. name)
    return
  end
  self.registered[name] = true
  self.help[name] = description
  self.type[name] = "counter"

  return Counter:new{name=name, label_names=label_names, prometheus=self}
end

-- Register a gauge.
--
-- Args:
--   name: (string) name of the metric. Required.
--   description: (string) description of the metric. Will be used for the HELP
--     comment on the metrics page. Optional.
--   label_names: array of strings, defining a list of metrics. Optional.
--
-- Returns:
--   a Gauge object.
function Prometheus:gauge(name, description, label_names)
  if not self.initialized then
    ngx.log(ngx.ERR, "Prometheus module has not been initialized")
    return
  end

  local err = check_metric_and_label_names(name, label_names)
  if err ~= nil then
    self:log_error(err)
    return
  end

  if self.registered[name] then
    self:log_error("Duplicate metric " .. name)
    return
  end
  self.registered[name] = true
  self.help[name] = description
  self.type[name] = "gauge"

  return Gauge:new{name=name, label_names=label_names, prometheus=self}
end


-- Register a histogram.
--
-- Args:
--   name: (string) name of the metric. Required.
--   description: (string) description of the metric. Will be used for the HELP
--     comment on the metrics page. Optional.
--   label_names: array of strings, defining a list of metrics. Optional.
--   buckets: array if numbers, defining bucket boundaries. Optional.
--
-- Returns:
--   a Histogram object.
function Prometheus:histogram(name, description, label_names, buckets)
  if not self.initialized then
    ngx.log(ngx.ERR, "Prometheus module has not been initialized")
    return
  end

  local err = check_metric_and_label_names(name, label_names)
  if err ~= nil then
    self:log_error(err)
    return
  end

  for _, suffix in ipairs({"", "_bucket", "_count", "_sum"}) do
    if self.registered[name .. suffix] then
      self:log_error("Duplicate metric " .. name .. suffix)
      return
    end
    self.registered[name .. suffix] = true
  end
  self.help[name] = description
  self.type[name] = "histogram"

  self.buckets[name] = buckets or DEFAULT_BUCKETS
  self.bucket_format[name] = construct_bucket_format(self.buckets[name])

  return Histogram:new{name=name, label_names=label_names, prometheus=self}
end

-- Set a given dictionary key.
-- This overwrites existing values, so it should only be used when initializing
-- metrics or when explicitely overwriting the previous value of a metric.
function Prometheus:set_key(key, value)
  local ok, err = self.dict:safe_set(key, value)
  if not ok then
    self:log_error_kv(key, value, err)
  end
end

-- Increment a given metric by `value`.
--
-- Args:
--   name: (string) short metric name without any labels.
--   label_names: (array) a list of label keys.
--   label_values: (array) a list of label values.
--   value: (number) value to add (a negative value when you need to decrease
--     the value of the gauge). Optional, defaults to 1.
function Prometheus:inc(name, label_names, label_values, value)
  local key = full_metric_name(name, label_names, label_values)
  if value == nil then value = 1 end

  local newval, err = self.dict:incr(key, value)
  if newval then
    return
  end
  -- Yes, this looks like a race, so I guess we might under-report some values
  -- when multiple workers simultaneously try to create the same metric.
  -- Hopefully this does not happen too often (shared dictionary does not get
  -- reset during configuation reload).
  if err == "not found" then
    self:set_key(key, value)
    return
  end
  -- Unexpected error
  self:log_error_kv(key, value, err)
end

-- Set the current value of a gauge to `value`
--
-- Args:
--   name: (string) short metric name without any labels.
--   label_names: (array) a list of label keys.
--   label_values: (array) a list of label values.
--   value: (number) the new value for the gauge.
function Prometheus:set(name, label_names, label_values, value)
  local key = full_metric_name(name, label_names, label_values)
  self:set_key(key, value)
end

-- Record a given value into a histogram metric.
--
-- Args:
--   name: (string) short metric name without any labels.
--   label_names: (array) a list of label keys.
--   label_values: (array) a list of label values.
--   value: (number) value to observe.
function Prometheus:histogram_observe(name, label_names, label_values, value)
  self:inc(name .. "_count", label_names, label_values, 1)
  self:inc(name .. "_sum", label_names, label_values, value)

  -- we are going to mutate arrays of label names and values, so create a copy.
  local l_names = copy_table(label_names)
  local l_values = copy_table(label_values)

  -- Last bucket. Note, that the label value is "Inf" rather than "+Inf"
  -- required by Prometheus. This is necessary for this bucket to be the last
  -- one when all metrics are lexicographically sorted. "Inf" will get replaced
  -- by "+Inf" in Prometheus:collect().
  table.insert(l_names, "le")
  table.insert(l_values, "Inf")
  self:inc(name .. "_bucket", l_names, l_values, 1)

  local label_count = #l_names
  for _, bucket in ipairs(self.buckets[name]) do
    if value <= bucket then
      -- last label is now "le"
      l_values[label_count] = self.bucket_format[name]:format(bucket)
      self:inc(name .. "_bucket", l_names, l_values, 1)
    end
  end
end

-- Prometheus compatible metric data as an array of strings.
--
-- Returns:
--   Array of strings with all metrics in a text format compatible with
--   Prometheus.
function Prometheus:metric_data()
  if not self.initialized then
    ngx.log(ngx.ERR, "Prometheus module has not been initialized")
    return
  end

  local keys = self.dict:get_keys(0)
  -- Prometheus server expects buckets of a histogram to appear in increasing
  -- numerical order of their label values.
  table.sort(keys)

  local seen_metrics = {}
  local output = {}
  for _, key in ipairs(keys) do
    local value, err = self.dict:get(key)
    if value then
      local short_name = short_metric_name(key)
      if not seen_metrics[short_name] then
        if self.help[short_name] then
          table.insert(output, string.format("# HELP %s%s %s\n",
            self.prefix, short_name, self.help[short_name]))
        end
        if self.type[short_name] then
          table.insert(output, string.format("# TYPE %s%s %s\n",
            self.prefix, short_name, self.type[short_name]))
        end
        seen_metrics[short_name] = true
      end
      -- Replace "Inf" with "+Inf" in each metric's last bucket 'le' label.
      if key:find('le="Inf"', 1, true) then
        key = key:gsub('le="Inf"', 'le="+Inf"')
      end
      table.insert(output, string.format("%s%s %s\n", self.prefix, key, value))
    else
      self:log_error("Error getting '", key, "': ", err)
    end
  end
  return output
end

-- Present all metrics in a text format compatible with Prometheus.
--
-- This function should be used to expose the metrics on a separate HTTP page.
-- It will get the metrics from the dictionary, sort them, and expose them
-- aling with TYPE and HELP comments.
function Prometheus:collect()
  ngx.header.content_type = "text/plain"
  ngx.print(self:metric_data())
end

return Prometheus
③修改nginx.conf
在http最后引入conf.d即可
include conf.d/*.conf;
3、重启Nginx
注意不能通过./nginx -s命令重启,而是要kill掉原来的nginx,再重新启动。
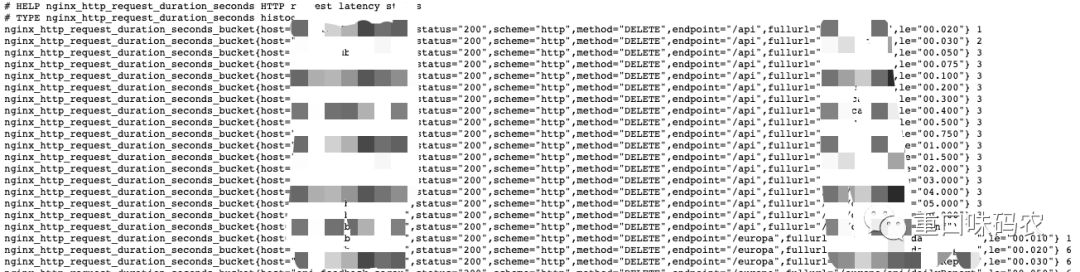
重启nginx后,访问ip:9145,就可以获取到监控所需的数据,如下:
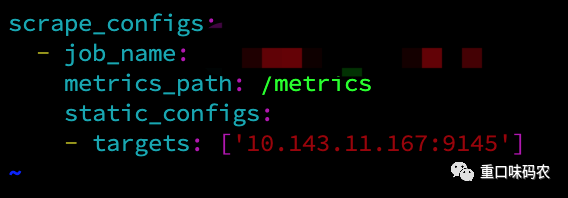
三、配置prometheus
将nginx的ip:9145配置到prometheus中,定时拉取数据。
四、配置grafana
数据存储到prometheus后,就可以在grafana中配置进行展示了。
1、配置prometheus数据源
在datasource中添加自己的prometheus数据源。
2、导入模板,展示数据
没错,在grafana官网已经提供了非常完善、精美的模板,我们下载下来,导入到自己的grafana中就能直接展示,而不需要自己进行配置了。
下载地址:
https://grafana.com/dashboards/10442
https://grafana.com/dashboards/10443
https://grafana.com/dashboards/10444
https://grafana.com/dashboards/10445
四个模板,下载后导入到自己的grafana就可以了。
五、查看grafana
这个模板有4个维度,指标非常详细,如下:
1、Nginx整体
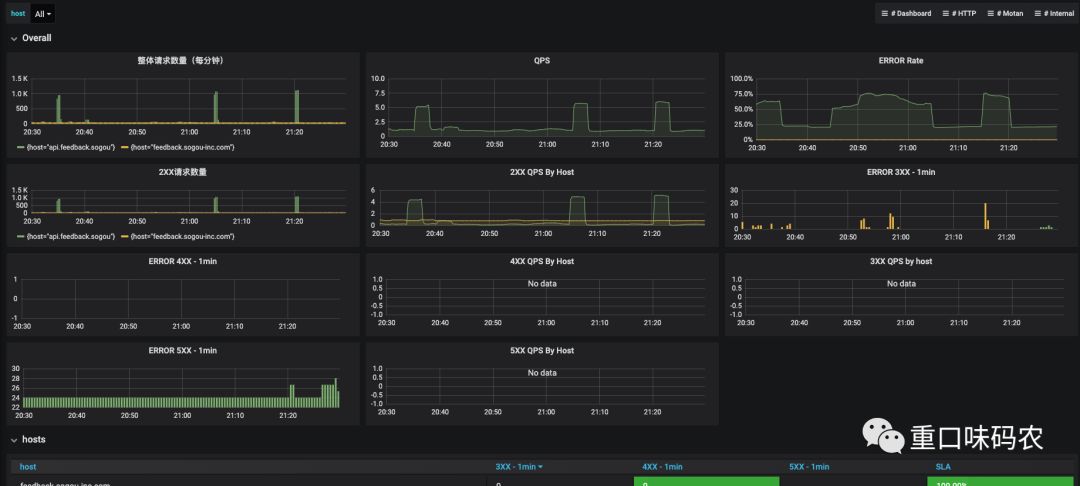
2、单个host
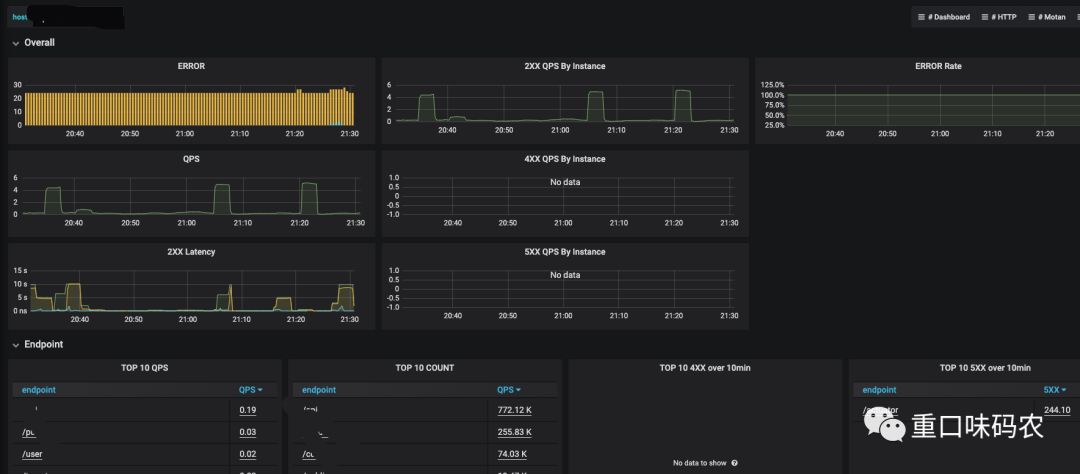
3、endpoint
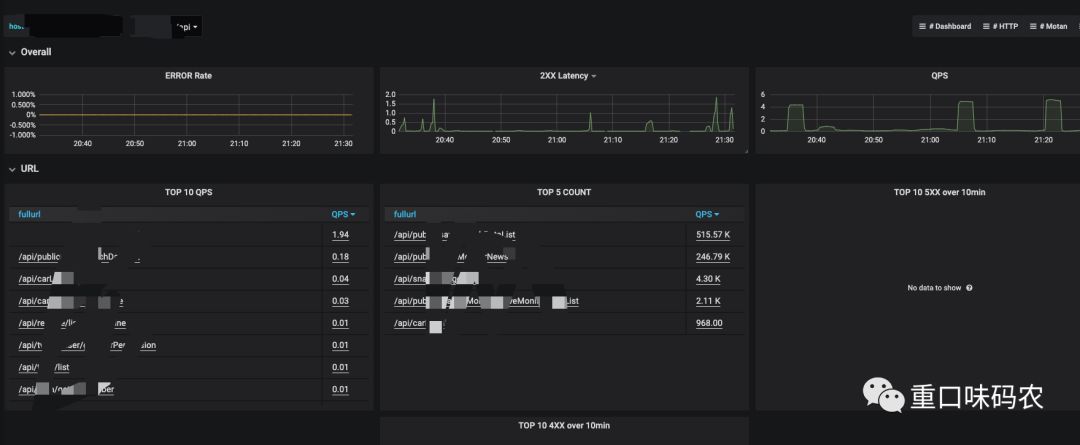
4、url
结语
这份文档是基于github上的一个开源项目https://github.com/zrbcool/prometheus-lua-nginx 修改而成,原项目是一个集成demo。我简化了部分配置,给grafana增加了几个维度的数据。
这种方式比普通的nginx-vts-exporter提供了更多更详细的数据,但相应的也会给nginx带来一定的负担,我自己测试过会有稍微的影响,大家可以实际评估后使用。
文章首发于重口味博客(https://blog.csdn.net/acingdreamer)
