


曾经,我想和你分享我的所有秘密,但现在,你成了我心底的秘密了。---- 李先森
Hystrix服务监控Dashboard仪表盘
Hystrix提供了 准实时的服务调用监控项目Dashboard,能够实时记录通过Hystrix发起的请求执行情况,可以通过图表的形式展现给用户看。
一、新建项目springcloud-hystrix-dashboard-1并添加pom.xml依赖:
<dependency>
    <groupId>org.springframework.cloud</groupId>
    <artifactId>spring-cloud-starter-hystrix</artifactId>
</dependency>
<dependency>
    <groupId>org.springframework.cloud</groupId>
    <artifactId>spring-cloud-starter-hystrix-dashboard</artifactId>
</dependency>
<dependency>
    <groupId>org.springframework.boot</groupId>
    <artifactId>spring-boot-starter-actuator</artifactId>
</dependency>
application.yml配置:
server:
  port: 9090
  context-path: /
二、新建启动类HystrixDashboardApplication
加注解:@EnableHystrixDashboard
package com.li.spingcloud.hystrix.dashboard;
import org.springframework.boot.SpringApplication;
import org.springframework.boot.autoconfigure.SpringBootApplication;
import org.springframework.boot.autoconfigure.jdbc.DataSourceAutoConfiguration;
import org.springframework.boot.autoconfigure.orm.jpa.HibernateJpaAutoConfiguration;
import org.springframework.cloud.netflix.hystrix.dashboard.EnableHystrixDashboard;
@EnableHystrixDashboard
@SpringBootApplication(exclude = { DataSourceAutoConfiguration.class,
        HibernateJpaAutoConfiguration.class })
public class HystrixDashboardApplication {
    public static void main(String[] args) {
        SpringApplication.run(HystrixDashboardApplication.class, args);
    }
}
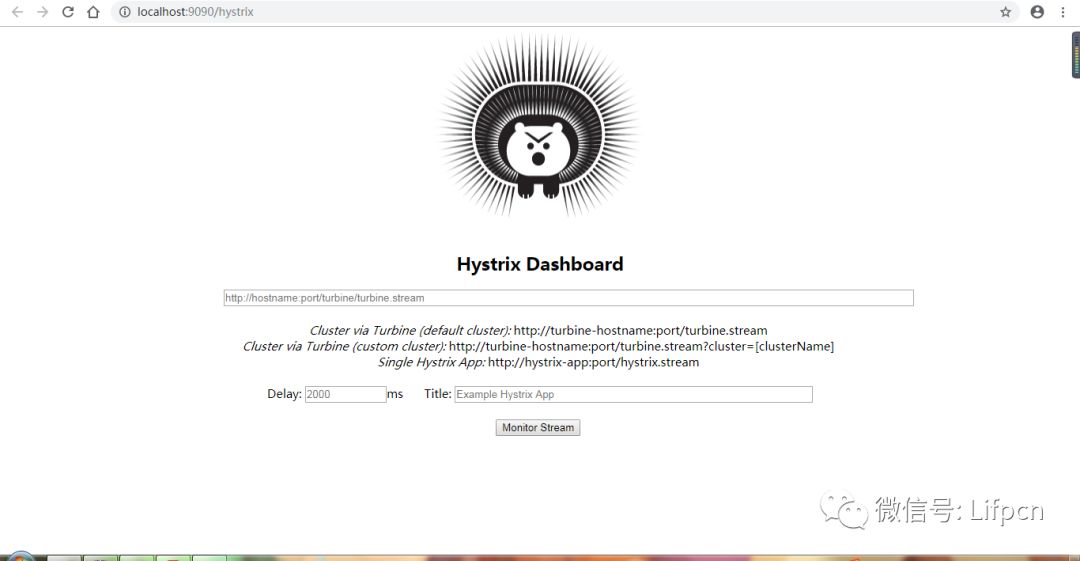
启动这个项目;
然后浏览器输入:
http://localhost:9090/hystrix/
三、测试
先启动eureka单机或者集群(集群记得修改配置);
在启动服务生产者单机或者集群;
然后启动服务消费者;
请求http://localhost:8080/consumer/list
返回正常业务;启动springcloud-hystrix-dashboard-1监控;在浏览器直接输入地址http://localhost:1001/hystrix.stream这个路径即可;(localhost:1001这个是需要监控的服务地址和端口)一直是ping,然后data返回数据;
用图形化:
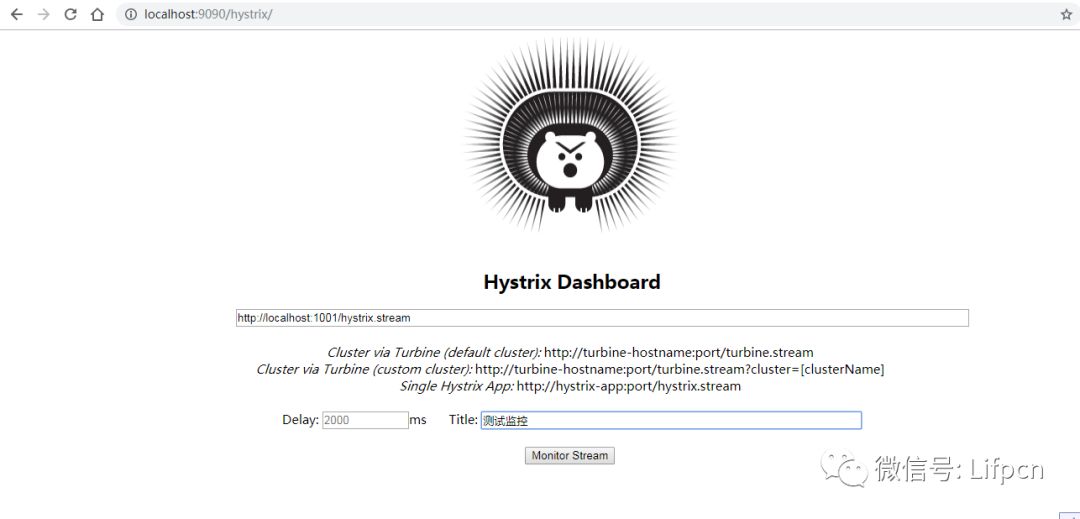
输入 ,然后点击按钮即可;Delay=监控时数据刷新时间毫秒单位,Title=是监控的名称
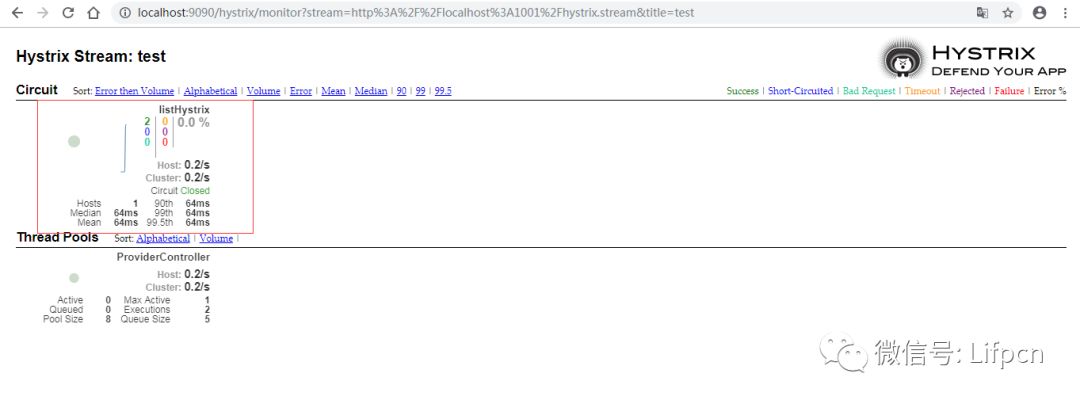
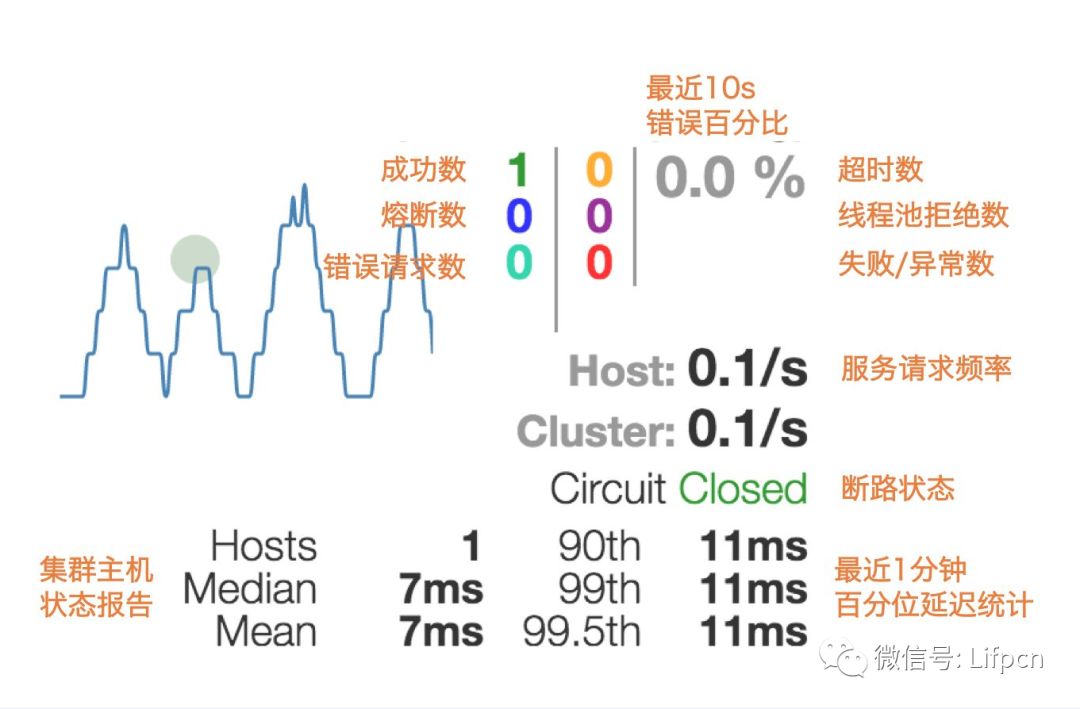
指标含义:
源码链接: https://pan.baidu.com/s/1TaxcDK6EHNiYO9mI1D2z4g
提取码: 63yk
文章转载自秃头架构,如果涉嫌侵权,请发送邮件至:contact@modb.pro进行举报,并提供相关证据,一经查实,墨天轮将立刻删除相关内容。
