


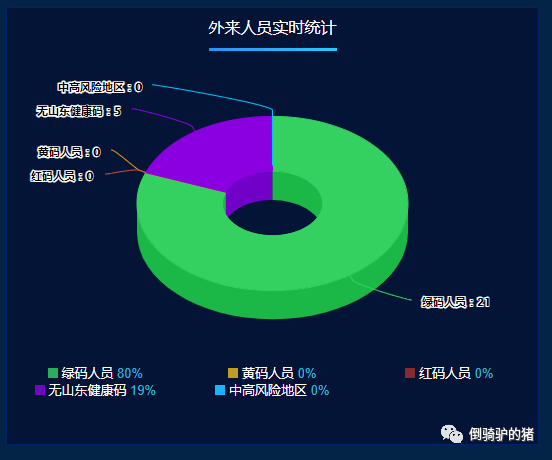
在大屏展示的其中一个模块以立体环形图展示数据所占的百分比。之前打算用echarts实现,但是限于echarts无法展示立体感,于是使用了highcharts
使用npm执行安装:
npm install highchartsnpm install vue-highchartsnpm install highcharts-3d
安装完成后,在main.js中引用 :
import highcharts from 'highcharts'import VueHighCharts from 'vue-highcharts'import highcharts3d from 'highcharts/highcharts-3d'highcharts3d(highcharts)
布局:
<template><div class="main"><header><span>外来人员实时统计</span></header><section class="container"><div class="container-chart" :id="id"></div><!-- 图例 --><el-row class="mark-container"><el-row><el-col :span="8" class="mark-item" v-for="(item) in dataList" :key="item.id"><span :class="markItemPoint(item.id)"></span><span>{{ item.name }}</span><!-- <span class="mark-item-count">{{ item.y }}</span> --><span class="mark-item-count">{{ item.percentage }}</span></el-col></el-row></el-row></section></div></template>
样式:
<style scoped lang="scss">%base-style {width: 10px;height: 10px;display: inline-block;}@mixin background-color($color) {@if $color==1 {background-color: #2bae5c;}@else if $color==4 {background-color: #bd9e21;}@else if $color==5 {background-color: #882b2c;}@else if $color==2 {background-color: #7006c1;}@else if $color==3 {background-color: #1ab3fe;}@extend %base-style;}.main {width: 100%;height: 100%;background-color: #041436;overflow: hidden;header {height: 40px;span {border-image: -webkit-linear-gradient(to right, #2D78F3, #21E7FF) 30 30;border-image: -moz-linear-gradient(to right, #2D78F3, #21E7FF) 30 30;border-image: linear-gradient(to right, #2D78F3, #21E7FF) 30 30;border-bottom: 3px solid;color: #ffffff;display: inline-block;// padding: 8px 0;line-height: 40px;margin: 0 auto}}.container {height: calc(100% - 40px);.container-chart {width: 100%;height: 80%;}.mark-container {height: 20%;.mark-item {display: inline-block;color: #ffffff;font-size: 13px;@for $i from 1 through 5 {.mark-item-point-#{$i} {@include background-color($i);}}.mark-item-count {color: #30b3cb;}}}}}</style>
数据处理:
<script>import HighCharts from 'highcharts'export default {data() {return {name: "WdataCharts",id: 'datacharts',dataList: []}},methods: {markItemPoint(id) {let obj = {};obj[`mark-item-point-${id}`] = true;return obj;},/* 查询数据 */getList() {let $this = this;this.$post('test').then(res => {let {msg,code,data} = res;var list = [{id: 1,status: '1',y: 0,name: '绿码人员',},{id: 4,status: '4',y: 0,name: '黄码人员',},{id: 5,status: '5',y: 0,name: '红码人员',},{id: 2,status: '2',y: 0,name: '无山东健康码',},{id: 3,status: '3',y: 0,name: '中高风险地区',sliced: true,},]if (code == "0") {var obj = {}for (var y = 0; y < data.length; y++) {obj[data[y].status] = data[y].nums}for (var i = 0; i < list.length; i++) {var item = list[i]if (obj.hasOwnProperty(item.status)) {list[i].y = obj[item.status]}}$this.getChart(list)$this.makeData(list)}});},/* 生成环形图 */getChart(list) {var option = {}var chart = {backgroundColor: 'none',type: 'pie',options3d: {enabled: true, //显示图表是否设置为3D, 我们将其设置为 truealpha: 50 //图表视图旋转角度}}var title = {text: '' //图表的标题文字}var subtitle = {text: ''}var plotOptions = {// pie: {// innerSize: 100,// depth: 45// },pie: {allowPointSelect: true,cursor: 'pointer',innerSize: 100,depth: 50,dataLabels: {enabled: true,format: '{point.name} : {point.y}'}}}var colors = ['#34d160', '#f19610', '#d14c3e', '#8a00e1','#00c6ff'] //红,黄,绿,无,中高风险var series = [{type: 'pie',name: '总数', //统一的前置词,非必须data: list}]option.colors = colorsoption.chart = chart;option.title = title;option.subtitle = subtitle;option.plotOptions = plotOptions;option.series = series;HighCharts.chart(this.id, option)},/* 计算百分比 */makeData(list) {var count = 0for (var item of list) {count += item.y}for (var i = 0; i < list.length; i++) {list[i].percentage = parseInt((list[i].y / count) * 100) + '%'}this.dataList = list}},mounted() {this.getList();}}</script>


文章转载自倒骑驴的猪,如果涉嫌侵权,请发送邮件至:contact@modb.pro进行举报,并提供相关证据,一经查实,墨天轮将立刻删除相关内容。
