


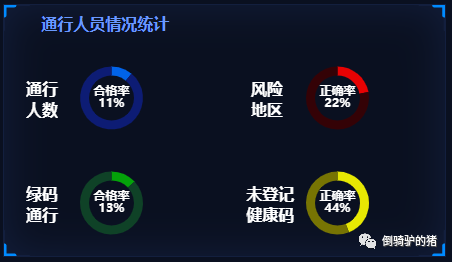
用户需求:在echarts饼状图的基础上,实现双层圆环图,最终的效果图如下:

实现part1:
<template><dv-border-box-7 style="height: calc(100% - 20px)" :color="['#131F3E', '#008BFF']"><header><el-col :span="11" class="header-title">通行人员情况统计</el-col></header><el-row :gutter="10" class="container"><el-row class="container-part"><el-col class="part" :span="12"><div class="part-title">通行人数</div><el-col id="map1" :span="24"></el-col></el-col><el-col class="part" :span="12"><div class="part-title" :span="12">风险地区</div><el-col id="map2" :span="24"></el-col></el-col></el-row><el-row class="container-part"><el-col class="part" :span="12"><div class="part-title" :span="12">绿码通行</div><el-col id="map3" :span="24"></el-col></el-col><el-col class="part" :span="12"><div class="part-title-no" :span="12">未登记健康码</div><el-col id="map4" :span="24"></el-col></el-col></el-row></el-row></dv-border-box-7></template>
实现part2:
<script>export default {data() {return {type: "day", //day/week/monthshowList: false,count: 0,percentage: 0};},methods: {pie(pieData, pieName, box, colors){const that = this;var myChart = this.$echarts.init(document.getElementById(box));const data = pieData;const name = pieName;const option = {grid: {top: 5,bottom: 5,},color: colors,series: [{name: 'valueOfMarket',type: 'pie',center: ['50%', '50%'], // 饼图的圆心坐标radius: ['50%', '70%'],avoidLabelOverlap: false,hoverAnimation: false,label: { // 饼图图形上的文本标签normal: { // normal 是图形在默认状态下的样式show: true,position: 'center',color: '#000000',fontSize: 14,fontWeight: 'bold',formatter: '{b}\n{c}%' // {b}:数据名;{c}:数据值;{d}:百分比}},data: [{value: data,name: name,label: {normal: {show: true,color:'#ffffff',fontSize:12},}},{value: 100 - data,name: '',label: {normal: {show: false}}}]}]}myChart.setOption(option);},getMap() {this.pie(11, '合格率', 'map1', ['#0163E9', '#0D1C74']);this.pie(22, '正确率', 'map2', ['#E70203', '#340206']);this.pie(13, '合格率','map3', ['#04A20A', '#0F4227']);this.pie(44, '正确率', 'map4', ['#E7E803', '#777403']);},},mounted() {this.$nextTick(function() {// this.getData()this.getMap()var chart1 = this.$echarts.init(document.getElementById('map1'));var chart2 = this.$echarts.init(document.getElementById('map2'));var chart3 = this.$echarts.init(document.getElementById('map3'));var chart4 = this.$echarts.init(document.getElementById('map4'));window.addEventListener("resize", () => {chart1.resize();chart2.resize();chart3.resize();chart4.resize();});})}};</script>
实现part3:
<style scoped>.main {width: 100%;height: auto;padding-bottom: 15px;color: #ffffff;font-size: 14px;}header {width: 100%;height: 40px;line-height: 40px;}.header-title {font-weight: 700;font-style: normal;: 17px;color: #6A99FD;text-align: center;}.container {height: calc(100% - 40px);color: #FFFFFF;font-weight: bold;display: flex;flex-direction: column;}.container-part {flex: 1;justify-content: center;align-items: center;display: flex;}#map1,#map2,#map3,#map4 {width: 100%;height: 90px;}.part {position: relative;display: flex;justify-content: center;align-items: center;font-size: 16px;}.part-title,.part-title-no {position: absolute;width: 40px;height: 40px;left: 10%;top: 50%;margin-top: -20px;z-index: 999;}.part-title-no {width: 60px;left: 7%;}</style>


文章转载自倒骑驴的猪,如果涉嫌侵权,请发送邮件至:contact@modb.pro进行举报,并提供相关证据,一经查实,墨天轮将立刻删除相关内容。
