



一、安装部署
1、安装elasticsearch
#yum install java -y
#yum install perl-Digest-SHA
#shasum -a 512 -c elasticsearch-7.8.0-x86_64.rpm.sha512
#rpm -ivh elasticsearch-7.8.0-x86_64.rpm
#systemctl daemon-reload
#adduser es
#passwd es
#chown -R es.elasticsearch /var/log/elasticsearch/
#chown -R es.elasticsearch /var/lib/elasticsearch/
#chown -R es.elasticsearch /etc/elasticsearch/
#chown -R es.elasticsearch /usr/share/elasticsearch/
#su es
$cd /usr/share/elasticsearch/bin
$./elasticsearch -d
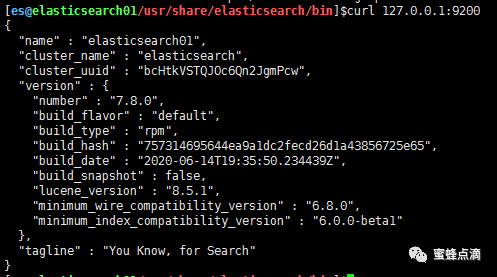
2、安装分析器elasticsearch-analysis-ik
下载地址:版本一定要与elasticsearch版本一样
https://github.com/medcl/elasticsearch-analysis-ik/releases/download/v7.8.0/elasticsearch-analysis-ik-7.8.0.zip
$cd /usr/share/elasticsearch/plugins
$unzip elasticsearch-analysis-ik-7.8.0.zip
$mv elasticsearch-analysis-ik-7.8.0 ik
重启:
$pkill pid
$./elasticsearch -d
3、安装elasticsearch-head
(1)npm cnpm安装
#yum install nodejs npm openssl screen -y
nodejs npm安装不上。
#cd /application
#tar xvf node-v12.18.0-linux-x64.tar.gz
#ln -s node-v12.18.0-linux-x64/ node
配置环境变量:
#vim /etc/profile
export PATH=/application/node/bin:$PATH
#source /etc/profile
测试是否安装成功:
#node -v
#npm -v
#npm install -g cnpm --registry=https://registry.npm.taobao.org
(2)安装elasticsearch-head
#cd /application
#tar xvf elasticsearch-head.tar
#cd elasticsearch-head
#cnpm run start
修改 ES 配置文件支持跨域:
#vim /etc/elasticsearch/elasticsearch.yml
http.cors.enabled: true
http.cors.allow-origin: "*"
4、安装配置 kibana
#rpm -ivh kibana-7.8.0-x86_64.rpm
#vim /etc/kibana/kibana.yml
server.port: 5601
server.host: "192.168.198.149"
elasticsearch.hosts: ["http://192.168.198.149:9200"]
kibana.index: ".kibana"
# systemctl start kibana
5、安装 filebeat 和 logstash
#rpm -ivh filebeat-7.8.0-x86_64.rpm
#rpm -ivh logstash-7.8.0.rpm
两者简介:logstash 和filebeat都具有日志收集功能,filebeat更轻量,占用资源更少,但logstash 具有filter功能,能过滤分析日志。一般结构都是filebeat采集日志,然后发送到消息队列,redis,kafaka。然后logstash去获取,利用filter功能过滤分析,然后存储到elasticsearch中。
暂时没有启动服务。
6、安装 nginx
#yum install pcre pcre-devel -y
#yum install openssl openssl-devel -y
#cd /server/tools
#tar xf nginx-1.16.1.tar.gz
#useradd -s /sbin/nologin wwww -M
#cd nginx-1.16.1/
#./configure --user=wwww --group=wwww --prefix=/application/nginx-1.16.1/ --with-http_stub_status_module --with-http_ssl_module --with-pcre
#make
#make install
#ln -s /application/nginx-1.16.1/ /application/nginx
#echo 'export PATH="/application/nginx/sbin:$PATH"'>>/etc/profile
#source /etc/profile
#nginx -t
#nginx
二、配置文件
1、配置 filebeat 收集普通日志
https://www.elastic.co/guide/en/beats/filebeat/7.x/filebeat-input-log.html
https://www.elastic.co/guide/en/beats/filebeat/7.x/configuration-filebeat-options.html
#cd /etc/filebeat
#cp filebeat.yml filebeat.yml.bak
#cat >filebeat.yml<<EOF
filebeat.inputs:
- type: log
enabled: true
paths:
- /application/nginx/logs/access.log
setup.kibana:
host: "192.168.198.149:5601"
output.elasticsearch:
hosts: ["192.168.198.149:9200"]
index: "nginx-%{[beat.version]}-%{+yyyy.MM.dd}"
setup.template.name: "nginx"
setup.template.pattern: "nginx-*"
setup.template.enabled: false
setup.template.overwrite: true
EOF
以上发配置filebeat起不来,按照以下配置:
#vim filebeat.yml
filebeat.inputs:
- type: log
enabled: true
paths:
- /application/nginx/logs/access.log
filebeat.config.modules:
path: ${path.config}/modules.d/*.yml
reload.enabled: false
setup.template.settings:
index.number_of_shards: 1
setup.kibana:
output.elasticsearch:
hosts: ["192.168.198.149:9200"]
processors:
- add_host_metadata: ~
- add_cloud_metadata: ~
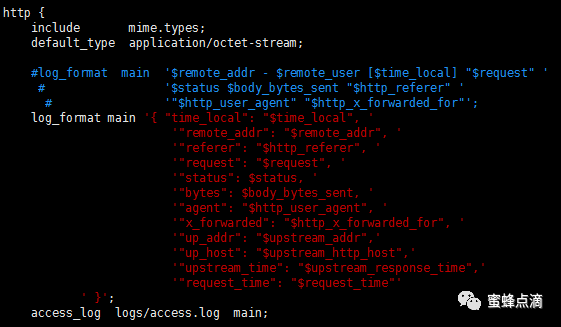
2、修改Nginx日志格式为json格式:
log_format main '{ "time_local": "$time_local", '
'"remote_addr": "$remote_addr", '
'"referer": "$http_referer", '
'"request": "$request", '
'"status": $status, '
'"bytes": $body_bytes_sent, '
'"agent": "$http_user_agent", '
'"x_forwarded": "$http_x_forwarded_for", '
'"up_addr": "$upstream_addr",'
'"up_host": "$upstream_http_host",'
'"upstream_time": "$upstream_response_time",'
'"request_time": "$request_time"'
' }';
access_log logs/access.log main;
重启Nginx服务,查看日志:
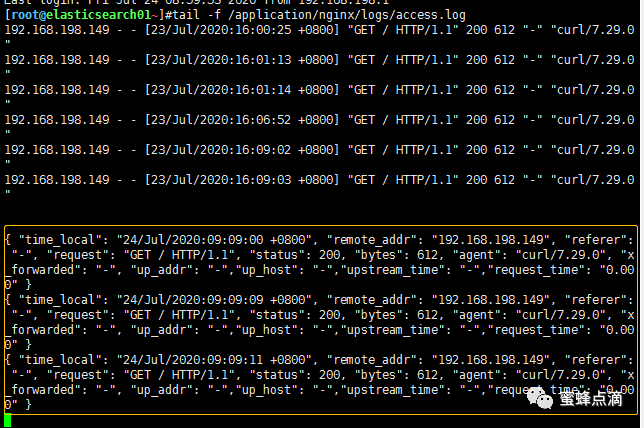
日志格式变为json格式。
三、开启服务
1、检查服务是否开启:
$ps -ef | grep elasticsearch
curl 192.168.198.149:9200
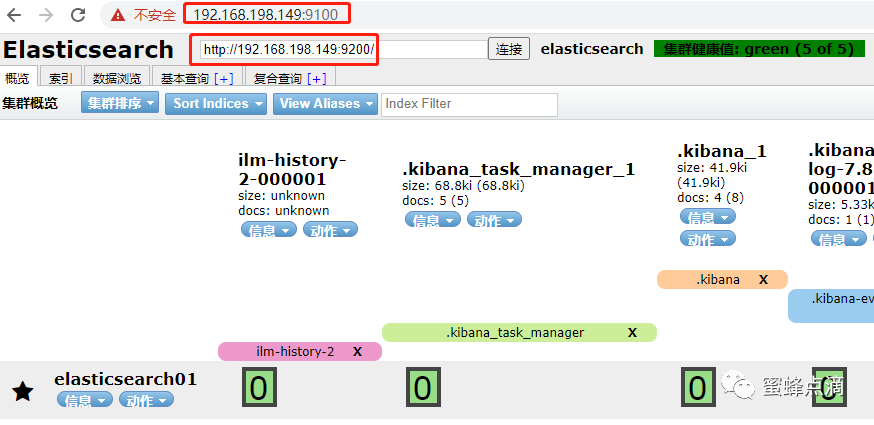
2、开启:elasticsearch-head
#cd /application/elasticsearch-head
#cnpm run start
浏览器输入:192.168.198.149:9100
3、开启:kibana
#systemctl start kibana
四、登录测试
浏览器输入:http://192.168.198.149:5601
第一步:进入开始界面选择Explorer on my own

第二步:create index pattern
第三步:add log data
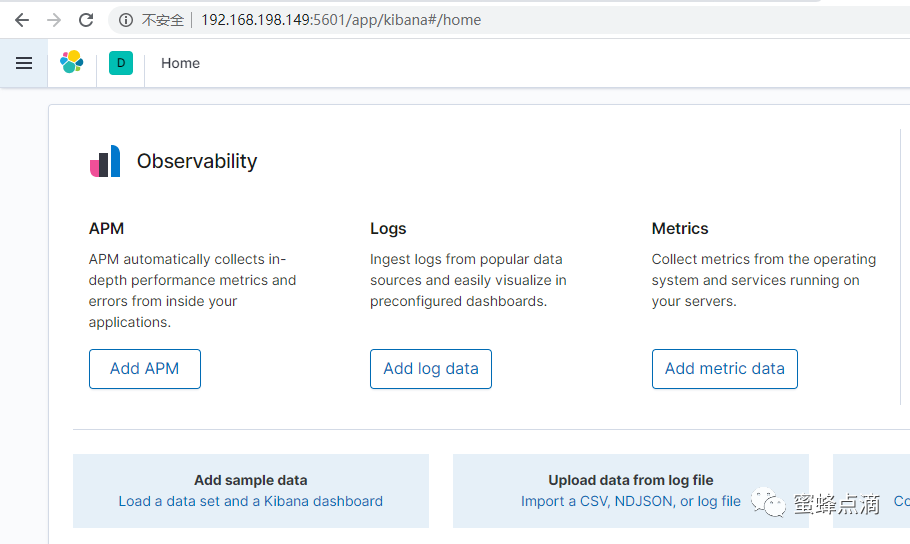
第四步:查看日志
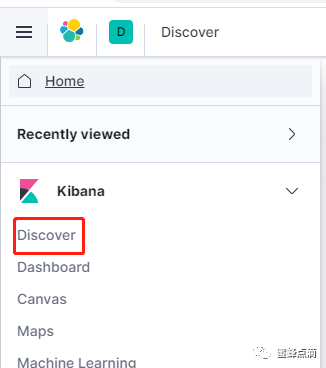
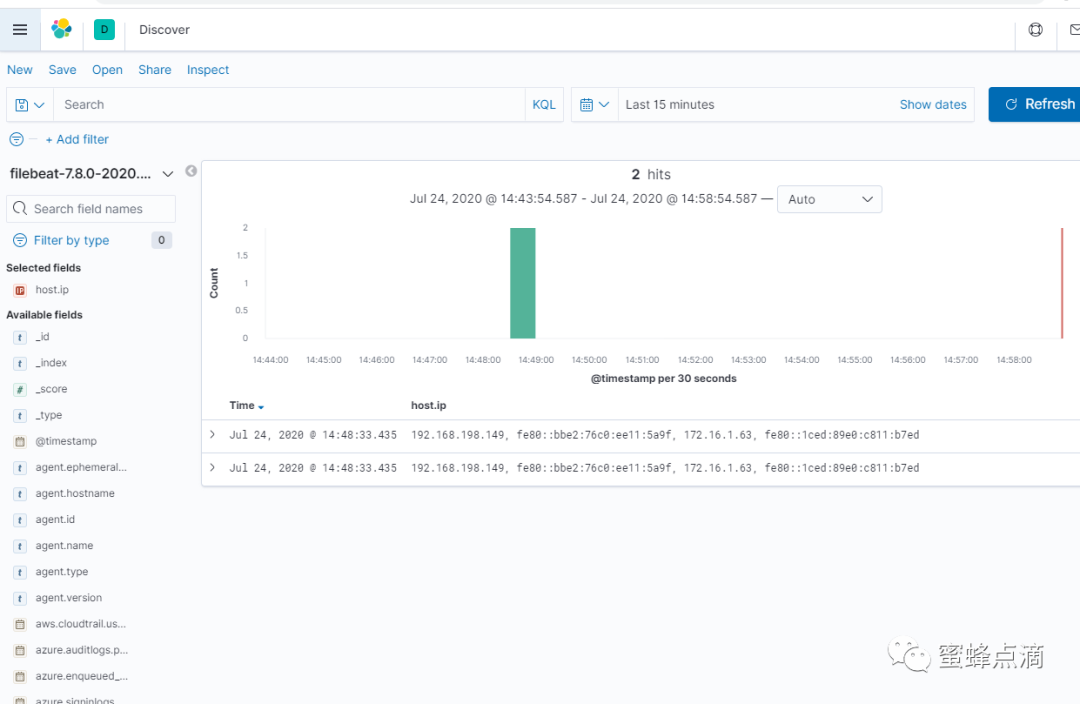
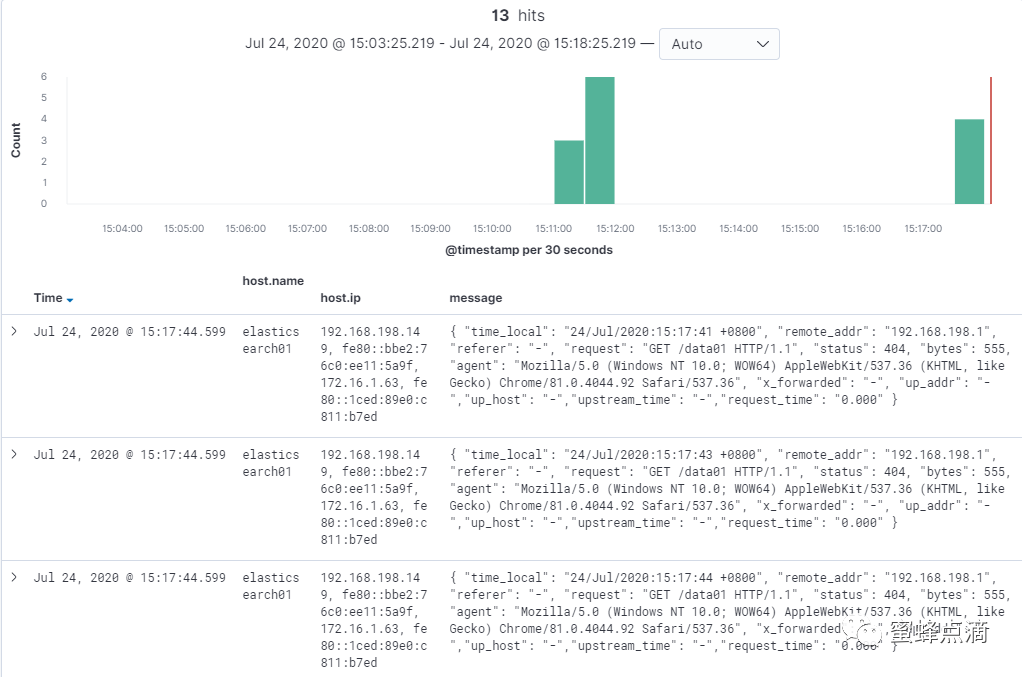
第五步:设置自己想看的内容 Add filter

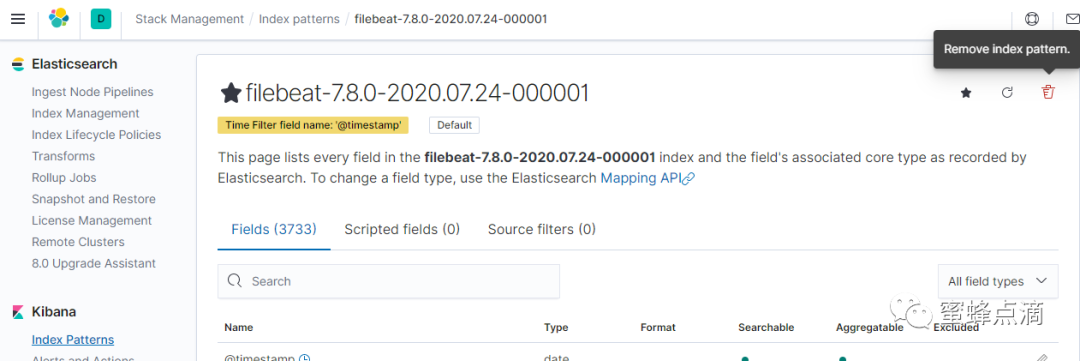
删除重新建日志管理:
Stack Management→Index patterns→filebeat-7.8.0-2020.07.24-000001
删除即可。
五、其他
认证:
https://docs.search-guard.com/latest/search-guard-installation
调优:
https://www.elastic.co/guide/en/elasticsearch/reference/current/system-config.html
下载界面:
安装方法参考:
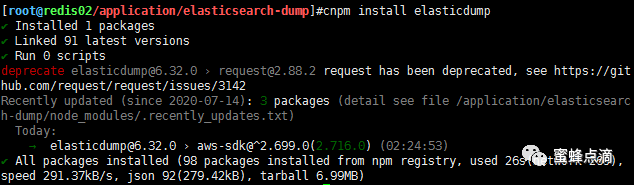
https://github.com/taskrabbit/elasticsearch-dump
#git clone https://github.com/elasticsearch-dump/elasticsearch-dump.git
#cd /application/elasticsearch-dump
#cnpm install elasticdump
Python Elasticsearch客户端:
https://elasticsearch-py.readthedocs.io/en/master/
