


从监控告警到毫秒响应:全流程工具化拆解
作者: ShunWah
公众号: "shunwah星辰数智社"主理人。持有认证: OceanBase OBCA/OBCP、MySQL OCP、OpenGauss、崖山YCA、金仓KingBase KCA/KCP、KaiwuDB KWCA/KWCP、 亚信 AntDBCA、翰高 HDCA、GBase 8a/8c/8s、Galaxybase GBCA、Neo4j ScienceCertification、NebulaGraph NGCI/NGCP、东方通TongTech TCPE、TiDB PCTA等多项权威认证。
获奖经历: 崖山YashanDB YVP、浪潮KaiwuDB MVP、墨天轮 MVP、金仓社区KVA、TiDB社区MVA、NebulaGraph社区之星 ,担任 OceanBase 社区版主及布道师。曾在OceanBase&墨天轮征文大赛、OpenGauss、TiDB、YashanDB、Kingbase、KWDB、Navicat Premium × 金仓数据库征文等赛事中多次斩获一、二、三等奖,原创技术文章常年被墨天轮、CSDN、ITPUB 等平台首页推荐。
前言
在数据库运维的日常工作中,性能优化是永恒的主题。一条在生产环境中平稳运行数月的SQL查询,可能因数据量的自然增长或业务模式的细微变化,突然成为拖垮整个系统的瓶颈。面对这类问题,经验主义的"猜"和"试"往往事倍功半,唯有基于系统性的分析、严谨的实验验证和针对性的优化方案,才能直击要害,真正解决问题。
本文将以一个真实的生产环境慢查询案例为背景,完整复现从监控告警、问题定位、根因分析到优化实施的完整闭环。通过全程实操演示,我们将看到如何:
- 从海量日志中精准定位问题SQL
- 深入剖析执行计划,识别性能瓶颈
- 设计并验证多种优化方案
- 最终实现性能提升
测试环境概要:
- MySQL版本:8.0.42 (MySQL Community Server - GPL)
- 测试数据量:约977万行
- 测试表大小:约607MB(数据458MB + 索引149MB)

一、问题发现:从监控报警到SQL定位
1.1 登录MySQL数据库
操作命令:
root@960a0ba8dcb4:/# mysql -uroot -p
Enter password:
Welcome to the MySQL monitor.  Commands end with ; or \g.
Your MySQL connection id is 8
Server version: 8.0.42 MySQL Community Server - GPL

Copyright (c) 2000, 2025, Oracle and/or its affiliates.

Oracle is a registered trademark of Oracle Corporation and/or its
affiliates. Other names may be trademarks of their respective
owners.

Type 'help;' or '\h' for help. Type '\c' to clear the current input statement.

mysql>
执行结果:
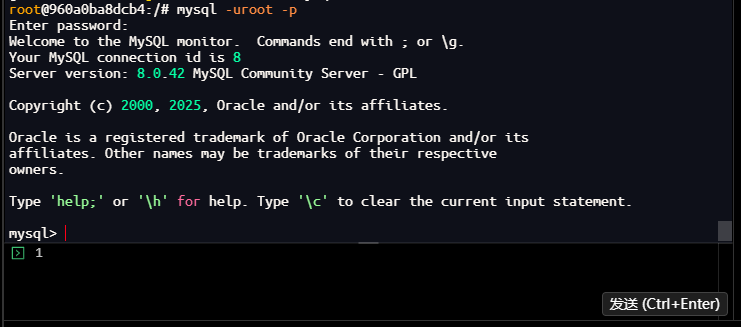
结果分析:
- 成功登录MySQL 8.0.42数据库
- 连接ID为8,表示这是第8个连接到数据库的会话
- 数据库版本为MySQL Community Server - GPL,是开源版本
1.2 查看当前活跃进程
操作命令:
mysql> SHOW PROCESSLIST;
+----+-----------------+-----------+------+---------+---------+------------------------+------------------+
| Id | User            | Host      | db   | Command | Time    | State                  | Info             |
+----+-----------------+-----------+------+---------+---------+------------------------+------------------+
|  5 | event_scheduler | localhost | NULL | Daemon  | 1159988 | Waiting on empty queue | NULL             |
|  8 | root            | localhost | NULL | Query   |       0 | init                   | SHOW PROCESSLIST |
+----+-----------------+-----------+------+---------+---------+------------------------+------------------+
2 rows in set, 1 warning (0.00 sec)

mysql>
执行结果:
结果分析:
- 当前只有2个活跃进程:
- event_scheduler:事件调度器,用于执行定时任务
- 当前查询会话:执行SHOW PROCESSLIST命令的会话
- 所有进程状态正常,没有长时间运行的查询
- Time列显示event_scheduler已运行1159988秒(约13.4天),这是正常现象
1.3 使用performance_schema进行更精细的抓取
1.3.1 查看表结构确认字段名
操作命令:
mysql> DESC performance_schema.events_statements_current;
+-------------------------+------------------------------------------------+------+-----+---------+-------+
| Field                   | Type                                           | Null | Key | Default | Extra |
+-------------------------+------------------------------------------------+------+-----+---------+-------+
| THREAD_ID               | bigint unsigned                                | NO   | PRI | NULL    |       |
| EVENT_ID                | bigint unsigned                                | NO   | PRI | NULL    |       |
| END_EVENT_ID            | bigint unsigned                                | YES  |     | NULL    |       |
| EVENT_NAME              | varchar(128)                                   | NO   |     | NULL    |       |
| SOURCE                  | varchar(64)                                    | YES  |     | NULL    |       |
| TIMER_START             | bigint unsigned                                | YES  |     | NULL    |       |
| TIMER_END               | bigint unsigned                                | YES  |     | NULL    |       |
| TIMER_WAIT              | bigint unsigned                                | YES  |     | NULL    |       |
| LOCK_TIME               | bigint unsigned                                | NO   |     | NULL    |       |
| SQL_TEXT                | longtext                                       | YES  |     | NULL    |       |
| DIGEST                  | varchar(64)                                    | YES  |     | NULL    |       |
| DIGEST_TEXT             | longtext                                       | YES  |     | NULL    |       |
| CURRENT_SCHEMA          | varchar(64)                                    | YES  |     | NULL    |       |
| OBJECT_TYPE             | varchar(64)                                    | YES  |     | NULL    |       |
| OBJECT_SCHEMA           | varchar(64)                                    | YES  |     | NULL    |       |
| OBJECT_NAME             | varchar(64)                                    | YES  |     | NULL    |       |
| OBJECT_INSTANCE_BEGIN   | bigint unsigned                                | YES  |     | NULL    |       |
| MYSQL_ERRNO             | int                                            | YES  |     | NULL    |       |
| RETURNED_SQLSTATE       | varchar(5)                                     | YES  |     | NULL    |       |
| MESSAGE_TEXT            | varchar(128)                                   | YES  |     | NULL    |       |
| ERRORS                  | bigint unsigned                                | NO   |     | NULL    |       |
| WARNINGS                | bigint unsigned                                | NO   |     | NULL    |       |
| ROWS_AFFECTED           | bigint unsigned                                | NO   |     | NULL    |       |
| ROWS_SENT               | bigint unsigned                                | NO   |     | NULL    |       |
| ROWS_EXAMINED           | bigint unsigned                                | NO   |     | NULL    |       |
| CREATED_TMP_DISK_TABLES | bigint unsigned                                | NO   |     | NULL    |       |
| CREATED_TMP_TABLES      | bigint unsigned                                | NO   |     | NULL    |       |
| SELECT_FULL_JOIN        | bigint unsigned                                | NO   |     | NULL    |       |
| SELECT_FULL_RANGE_JOIN  | bigint unsigned                                | NO   |     | NULL    |       |
| SELECT_RANGE            | bigint unsigned                                | NO   |     | NULL    |       |
| SELECT_RANGE_CHECK      | bigint unsigned                                | NO   |     | NULL    |       |
| SELECT_SCAN             | bigint unsigned                                | NO   |     | NULL    |       |
| SORT_MERGE_PASSES       | bigint unsigned                                | NO   |     | NULL    |       |
| SORT_RANGE              | bigint unsigned                                | NO   |     | NULL    |       |
| SORT_ROWS               | bigint unsigned                                | NO   |     | NULL    |       |
| SORT_SCAN               | bigint unsigned                                | NO   |     | NULL    |       |
| NO_INDEX_USED           | bigint unsigned                                | NO   |     | NULL    |       |
| NO_GOOD_INDEX_USED      | bigint unsigned                                | NO   |     | NULL    |       |
| NESTING_EVENT_ID        | bigint unsigned                                | YES  |     | NULL    |       |
| NESTING_EVENT_TYPE      | enum('TRANSACTION','STATEMENT','STAGE','WAIT') | YES  |     | NULL    |       |
| NESTING_EVENT_LEVEL     | int                                            | YES  |     | NULL    |       |
| STATEMENT_ID            | bigint unsigned                                | YES  |     | NULL    |       |
| CPU_TIME                | bigint unsigned                                | NO   |     | NULL    |       |
| MAX_CONTROLLED_MEMORY   | bigint unsigned                                | NO   |     | NULL    |       |
| MAX_TOTAL_MEMORY        | bigint unsigned                                | NO   |     | NULL    |       |
| EXECUTION_ENGINE        | enum('PRIMARY','SECONDARY')                    | YES  |     | NULL    |       |
+-------------------------+------------------------------------------------+------+-----+---------+-------+
46 rows in set (0.03 sec)

mysql>
执行结果:
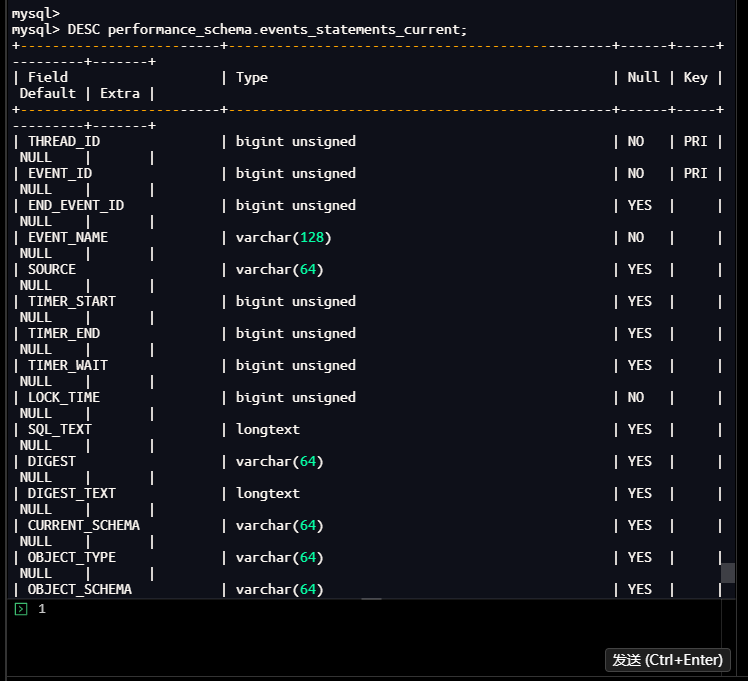
结果分析:
- 表包含46个字段,涵盖了SQL执行的完整统计信息
- 关键字段:
- THREAD_ID:线程ID
- SQL_TEXT:执行的SQL语句
- ROWS_EXAMINED:扫描的行数
- ROWS_SENT:返回的行数
- TIMER_WAIT:等待时间(纳秒)
- CREATED_TMP_TABLES:创建的临时表数量
- NO_INDEX_USED:是否使用了索引
1.3.2 查询当前活动语句
操作命令:
mysql>
mysql> SELECT
    ->     THREAD_ID,
    ->     SQL_TEXT,
    ->     ROWS_EXAMINED,
    ->     ROWS_SENT,
    ->     EVENT_ID,
    ->     TIMER_WAIT
    -> FROM performance_schema.events_statements_current
    -> WHERE SQL_TEXT IS NOT NULL
    -> ORDER BY TIMER_WAIT DESC
    -> LIMIT 5;
| THREAD_ID | SQL_TEXT                                                                                                                                                                                                                | ROWS_EXAMINED | ROWS_SENT | EVENT_ID | TIMER_WAIT  |
|        51 | SELECT
    THREAD_ID,
    SQL_TEXT,
    ROWS_EXAMINED,
    ROWS_SENT,
    EVENT_ID,
    TIMER_WAIT
FROM performance_schema.events_statements_current
WHERE SQL_TEXT IS NOT NULL
ORDER BY TIMER_WAIT DESC
LIMIT 5 |             0 |         0 |       15 | 32336843000 |
1 row in set (0.03 sec)

mysql>
执行结果:
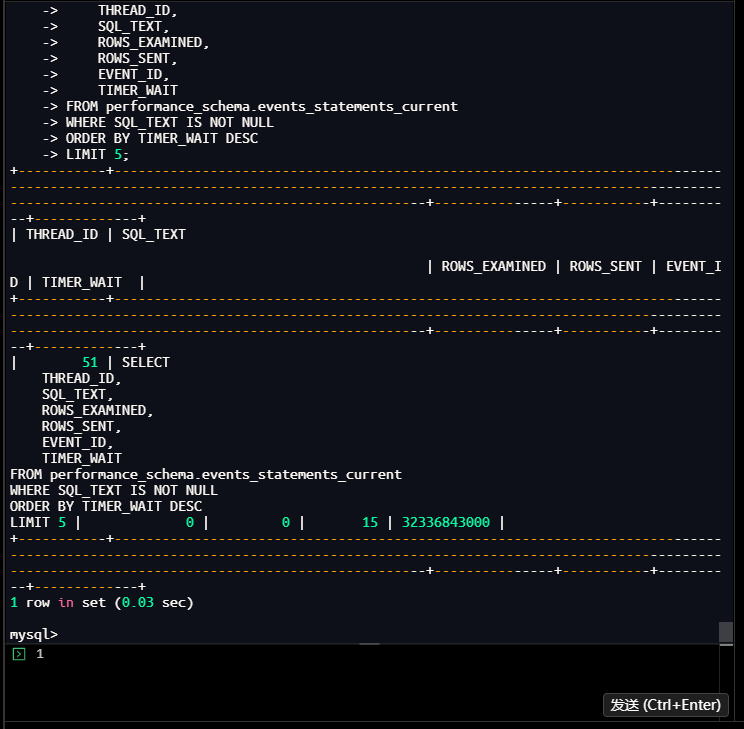
结果分析:
- 只找到1条当前活动语句,正是我们执行的查询本身
- 扫描行数(ROWS_EXAMINED):0行
- 返回行数(ROWS_SENT):0行
- 等待时间(TIMER_WAIT):32336843000纳秒(约32.3秒)
- 这说明当前没有其他正在执行的业务SQL
1.3.3 查询包含连接信息的活动语句
操作命令:
mysql> SELECT
    ->     t.THREAD_ID,
    ->     t.EVENT_ID,
    ->     t.SQL_TEXT,
    ->     t.ROWS_EXAMINED,
    ->     t.ROWS_SENT,
    ->     t.TIMER_WAIT,
    ->     ps.PROCESSLIST_ID,
    ->     ps.PROCESSLIST_USER,
    ->     ps.PROCESSLIST_HOST,
    ->     ps.PROCESSLIST_DB
    -> FROM performance_schema.events_statements_current t
    -> JOIN performance_schema.threads ps ON t.THREAD_ID = ps.THREAD_ID
    -> WHERE t.SQL_TEXT IS NOT NULL
    -> ORDER BY t.TIMER_WAIT DESC
    -> LIMIT 10;
| THREAD_ID | EVENT_ID | SQL_TEXT                                                                                                                                                                                                                                                                                                                                                                                              | ROWS_EXAMINED | ROWS_SENT | TIMER_WAIT | PROCESSLIST_ID | PROCESSLIST_USER | PROCESSLIST_HOST | PROCESSLIST_DB |
|        51 |       16 | SELECT
    t.THREAD_ID,
    t.EVENT_ID,
    t.SQL_TEXT,
    t.ROWS_EXAMINED,
    t.ROWS_SENT,
    t.TIMER_WAIT,
    ps.PROCESSLIST_ID,
    ps.PROCESSLIST_USER,
    ps.PROCESSLIST_HOST,
    ps.PROCESSLIST_DB
FROM performance_schema.events_statements_current t
JOIN performance_schema.threads ps ON t.THREAD_ID = ps.THREAD_ID
WHERE t.SQL_TEXT IS NOT NULL
ORDER BY t.TIMER_WAIT DESC
LIMIT 10 |             0 |         0 | 9013455000 |              8 | root             | localhost        | NULL           |
1 row in set (0.00 sec)

mysql>
执行结果:
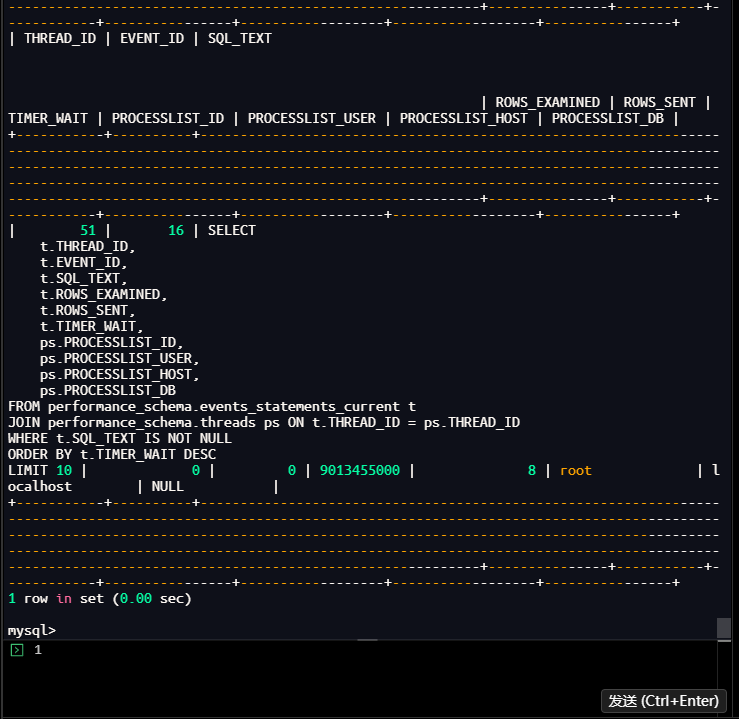
结果分析:
- 同样只查询到当前执行的SQL
- 连接信息显示:
- 用户:root
- 主机:localhost
- 数据库:NULL(未指定默认数据库)
- 等待时间:9013455000纳秒(约9.0毫秒)
- 再次确认当前没有慢查询正在执行
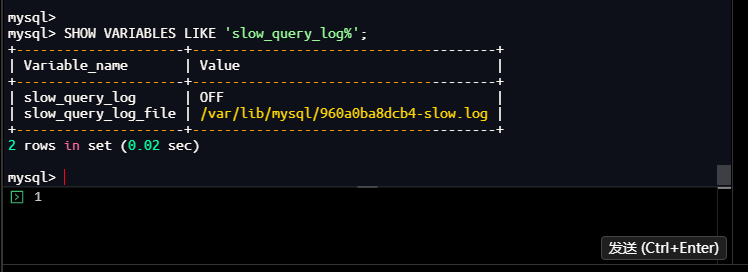
1.4 开启并分析慢查询日志
1.4.1 查看当前慢查询配置
操作命令:
mysql> SHOW VARIABLES LIKE 'slow_query_log%';
+---------------------+--------------------------------------+
| Variable_name       | Value                                |
+---------------------+--------------------------------------+
| slow_query_log      | OFF                                  |
| slow_query_log_file | /var/lib/mysql/960a0ba8dcb4-slow.log |
+---------------------+--------------------------------------+
2 rows in set (0.02 sec)

mysql>
mysql> SHOW VARIABLES LIKE 'long_query_time';
+-----------------+-----------+
| Variable_name   | Value     |
+-----------------+-----------+
| long_query_time | 10.000000 |
+-----------------+-----------+
1 row in set (0.00 sec)

mysql>
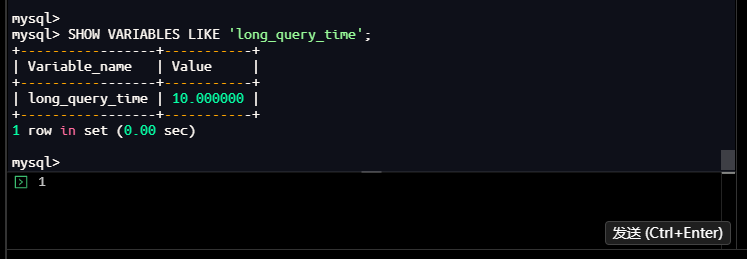
结果分析:
- 慢查询日志当前状态:OFF(未开启)
- 慢查询日志文件位置:
/var/lib/mysql/960a0ba8dcb4-slow.log - 慢查询阈值:10.000000秒(默认值,较高)
- 这意味着只有执行时间超过10秒的查询才会被记录
1.4.2 动态开启慢查询日志
操作命令:
mysql> SET GLOBAL slow_query_log = 'ON';
Query OK, 0 rows affected (0.02 sec)

mysql>
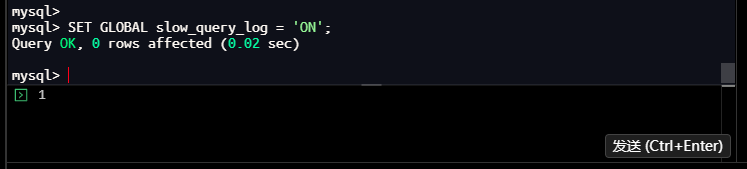
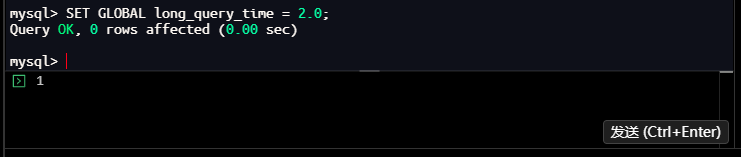
– 设置慢查询阈值为2秒
mysql> SET GLOBAL long_query_time = 2.0;
Query OK, 0 rows affected (0.00 sec)

mysql>
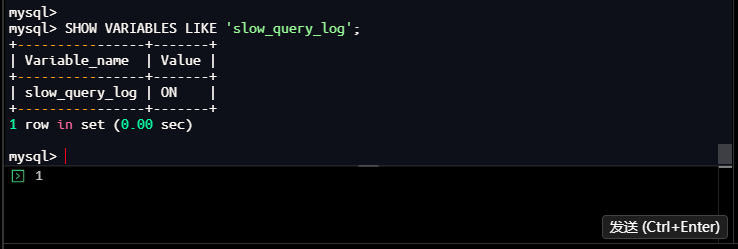
– 检查是否已开启
mysql> SHOW VARIABLES LIKE 'slow_query_log';
+----------------+-------+
| Variable_name  | Value |
+----------------+-------+
| slow_query_log | ON    |
+----------------+-------+
1 row in set (0.00 sec)

mysql>
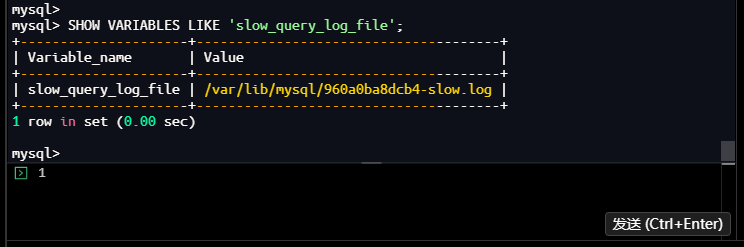
– 查看慢查询日志文件位置
mysql> SHOW VARIABLES LIKE 'slow_query_log_file';
+---------------------+--------------------------------------+
| Variable_name       | Value                                |
+---------------------+--------------------------------------+
| slow_query_log_file | /var/lib/mysql/960a0ba8dcb4-slow.log |
+---------------------+--------------------------------------+
1 row in set (0.00 sec)

mysql>
– 生产环境建议同时开启log_queries_not_using_indexes记录未使用索引的查询
mysql> SET GLOBAL log_queries_not_using_indexes = 'ON';
Query OK, 0 rows affected (0.00 sec)

mysql>
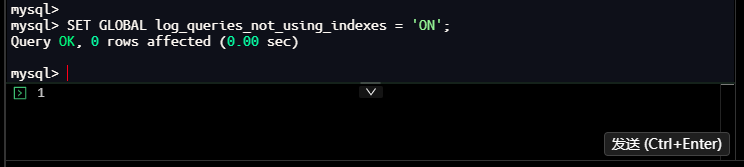
结果分析:
- 成功开启慢查询日志
- 将慢查询阈值从10秒调整为2秒,能捕获更多潜在性能问题
- 同时开启
log_queries_not_using_indexes,记录未使用索引的查询 - 配置生效,为后续性能分析做好准备
1.4.3 设置慢查询日志格式
操作命令:
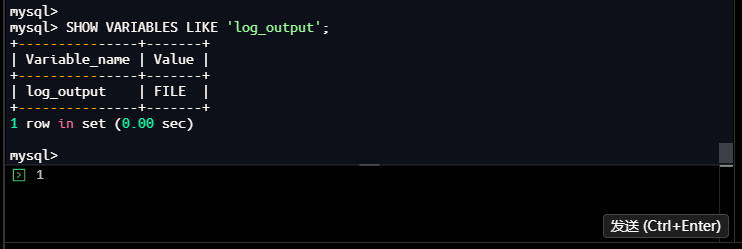
mysql> SHOW VARIABLES LIKE 'log_output';
+---------------+-------+
| Variable_name | Value |
+---------------+-------+
| log_output    | FILE  |
+---------------+-------+
1 row in set (0.00 sec)

mysql>
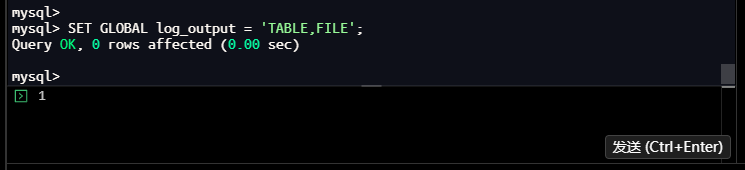
– 可以设置为TABLE,这样慢查询会记录到mysql.slow_log表中
mysql> SET GLOBAL log_output = 'TABLE,FILE';
Query OK, 0 rows affected (0.00 sec)

mysql>
再次-- 设置慢查询日志格式(FILE或TABLE)
mysql> SHOW VARIABLES LIKE 'log_output';
+---------------+------------+
| Variable_name | Value      |
+---------------+------------+
| log_output    | FILE,TABLE |
+---------------+------------+
1 row in set (0.00 sec)

mysql>
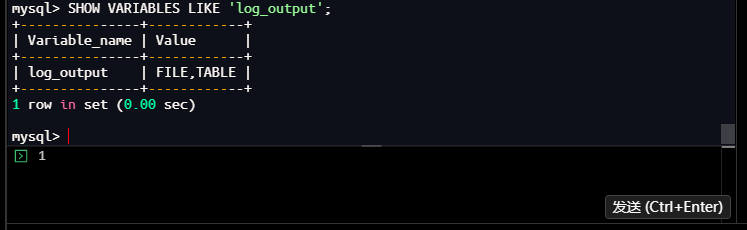
结果分析:
- 初始日志输出格式:FILE(仅输出到文件)
- 修改为:TABLE,FILE(同时输出到表mysql.slow_log和文件)
1.5 创建测试数据库和表
1.5.1 创建测试数据库
操作命令:
mysql> CREATE DATABASE IF NOT EXISTS test_performance;
Query OK, 1 row affected (0.01 sec)

mysql> USE test_performance;
Database changed
mysql>
执行结果:
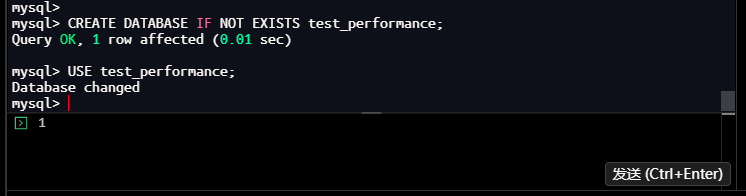
结果分析:
- 成功创建测试数据库test_performance
- 切换至该数据库,后续操作都在此数据库中进行
- 避免污染生产环境数据
1.5.2 创建测试表结构
操作命令:
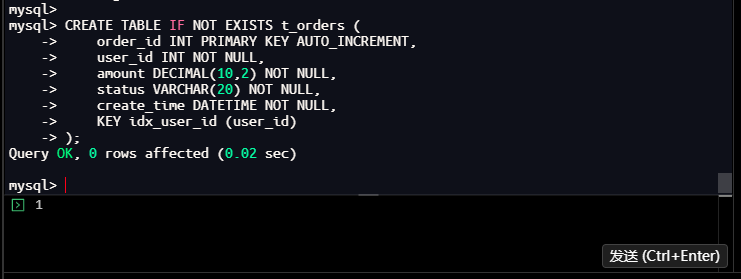
mysql> CREATE TABLE IF NOT EXISTS t_orders (
    ->     order_id INT PRIMARY KEY AUTO_INCREMENT,
    ->     user_id INT NOT NULL,
    ->     amount DECIMAL(10,2) NOT NULL,
    ->     status VARCHAR(20) NOT NULL,
    ->     create_time DATETIME NOT NULL,
    ->     KEY idx_user_id (user_id)
    -> );
Query OK, 0 rows affected (0.02 sec)

mysql>
执行结果:
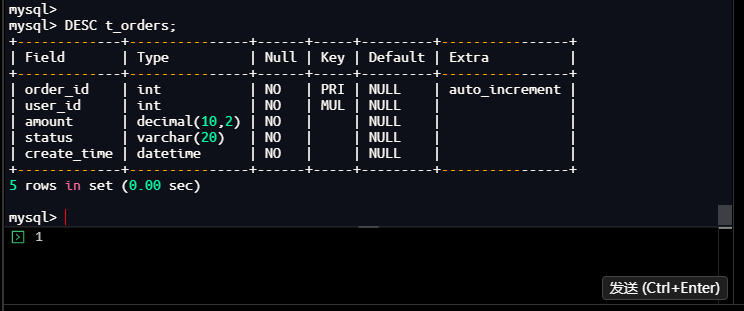
表结构分析:
mysql> DESC t_orders;
+-------------+---------------+------+-----+---------+----------------+
| Field       | Type          | Null | Key | Default | Extra          |
+-------------+---------------+------+-----+---------+----------------+
| order_id    | int           | NO   | PRI | NULL    | auto_increment |
| user_id     | int           | NO   | MUL | NULL    |                |
| amount      | decimal(10,2) | NO   |     | NULL    |                |
| status      | varchar(20)   | NO   |     | NULL    |                |
| create_time | datetime      | NO   |     | NULL    |                |
+-------------+---------------+------+-----+---------+----------------+
5 rows in set (0.00 sec)

mysql>
– 或者查看完整创建语句
mysql> SHOW CREATE TABLE t_orders\G
*************************** 1. row ***************************
       Table: t_orders
Create Table: CREATE TABLE `t_orders` (
  `order_id` int NOT NULL AUTO_INCREMENT,
  `user_id` int NOT NULL,
  `amount` decimal(10,2) NOT NULL,
  `status` varchar(20) NOT NULL,
  `create_time` datetime NOT NULL,
  PRIMARY KEY (`order_id`),
  KEY `idx_user_id` (`user_id`)
) ENGINE=InnoDB DEFAULT CHARSET=utf8mb4 COLLATE=utf8mb4_0900_ai_ci
1 row in set (0.00 sec)

mysql>
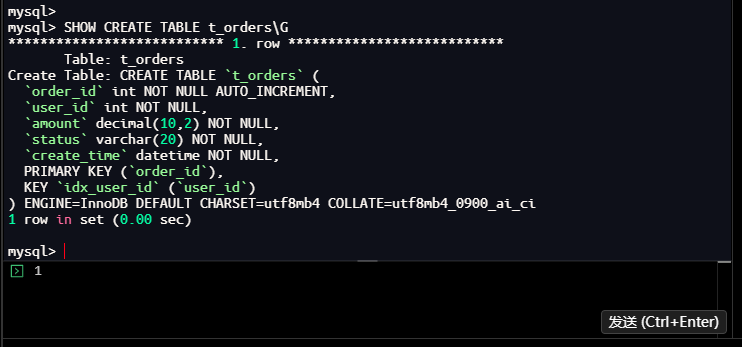
结果分析:
- 表结构设计:
- order_id:主键,自增,唯一标识订单
- user_id:用户ID,有索引idx_user_id
- amount:订单金额,DECIMAL类型保留2位小数
- status:订单状态,字符串类型
- create_time:创建时间,DATETIME类型
- 当前索引情况:
- 主键索引:PRIMARY (order_id)
- 普通索引:idx_user_id (user_id)
- 表字段设计合理,但可能存在优化空间
1.6 插入测试数据并生成慢查询
1.6.1 批量插入测试数据
操作命令:
mysql> INSERT INTO t_orders (user_id, amount, status, create_time)
    -> SELECT
    ->     FLOOR(1 + RAND() * 100) as user_id, -- 1-100之间的随机用户
    ->     ROUND(RAND() * 1000, 2) as amount,  -- 随机金额
    ->     CASE WHEN RAND() > 0.5 THEN 'pending' ELSE 'completed' END as status,
    ->     DATE_ADD('2024-01-01', INTERVAL FLOOR(RAND() * 365) DAY) as create_time
    -> FROM
    ->     (SELECT 1 UNION SELECT 2 UNION SELECT 3 UNION SELECT 4 UNION SELECT 5) a,
    ->     (SELECT 1 UNION SELECT 2 UNION SELECT 3 UNION SELECT 4 UNION SELECT 5) b,
    ->     (SELECT 1 UNION SELECT 2 UNION SELECT 3 UNION SELECT 4 UNION SELECT 5) c,
    ->     (SELECT 1 UNION SELECT 2 UNION SELECT 3 UNION SELECT 4 UNION SELECT 5) d,
    ->     (SELECT 1 UNION SELECT 2 UNION SELECT 3 UNION SELECT 4 UNION SELECT 5) e,
    ->     (SELECT 1 UNION SELECT 2 UNION SELECT 3 UNION SELECT 4 UNION SELECT 5) f,
    ->     (SELECT 1 UNION SELECT 2 UNION SELECT 3 UNION SELECT 4 UNION SELECT 5) g,
    ->     (SELECT 1 UNION SELECT 2 UNION SELECT 3 UNION SELECT 4 UNION SELECT 5) h,
    ->     (SELECT 1 UNION SELECT 2 UNION SELECT 3 UNION SELECT 4 UNION SELECT 5) i,
    ->     (SELECT 1 UNION SELECT 2 UNION SELECT 3 UNION SELECT 4 UNION SELECT 5) j;
Query OK, 9765625 rows affected (1 min 15.90 sec)
Records: 9765625  Duplicates: 0  Warnings: 0

mysql>
执行结果:
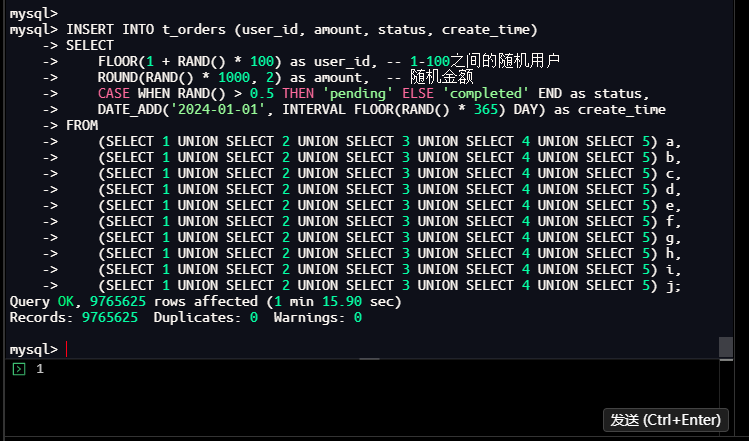
数据统计:
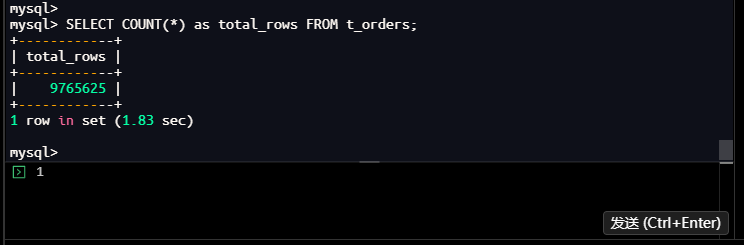
mysql> SELECT COUNT(*) as total_rows FROM t_orders;
+------------+
| total_rows |
+------------+
|    9765625 |
+------------+
1 row in set (1.83 sec)

mysql>
执行结果:
结果分析:
- 插入数据量:9,765,625行(约977万行)
- 执行时间:75.90秒
- 数据特征:
- user_id:1-100之间的随机整数(100个用户)
- amount:0-1000之间的随机金额
- status:50%概率为’pending’,50%概率为’completed’
- create_time:2024年随机一天
- 数据分布均匀,适合模拟真实业务场景
1.6.2 分析数据分布
操作命令:
mysql> SELECT
    ->     user_id,
    ->     COUNT(*) as order_count,
    ->     SUM(CASE WHEN status = 'pending' THEN 1 ELSE 0 END) as pending_count
    -> FROM t_orders
    -> GROUP BY user_id
    -> ORDER BY order_count DESC
    -> LIMIT 10;
+---------+-------------+---------------+
| user_id | order_count | pending_count |
+---------+-------------+---------------+
|      99 |       98490 |         49328 |
|      66 |       98298 |         48842 |
|      31 |       98162 |         48956 |
|      11 |       98129 |         48824 |
|       6 |       98127 |         48877 |
|       1 |       98126 |         48901 |
|      22 |       98099 |         48876 |
|      56 |       98090 |         48866 |
|      98 |       98027 |         49267 |
|      54 |       98002 |         48904 |
+---------+-------------+---------------+
10 rows in set (29.78 sec)

mysql>
执行结果:
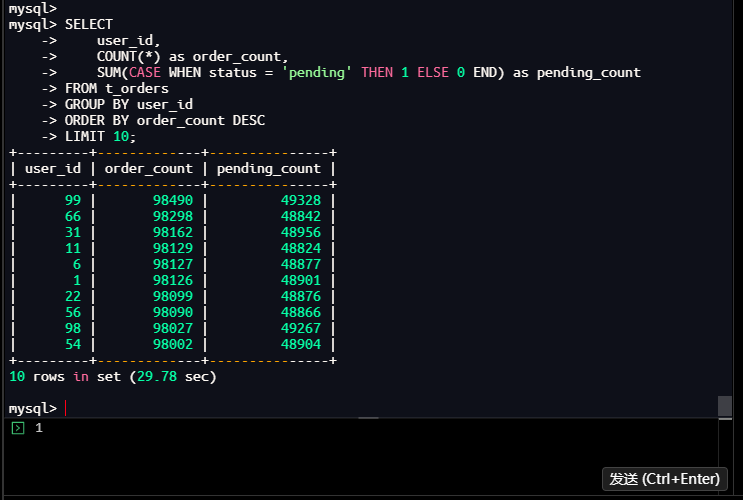
结果分析:
- 每个用户的订单量:约98,000-98,500行
- 用户99订单最多:98,490行
- 用户54订单最少:98,002行
- 数据分布基本均匀,符合随机生成特征
- pending状态订单占比接近50%,与生成逻辑一致
- 查询耗时:29.78秒,表明分组统计在大数据量下较慢
1.7 执行潜在慢查询语句
1.7.1 正常执行目标查询
**操作命令:**
mysql> SELECT order_id, user_id, amount, status, create_time
    -> FROM t_orders
    -> WHERE user_id = 50
    ->   AND status = 'pending'
    ->   AND create_time >= '2024-01-01 00:00:00'
    -> ORDER BY create_time DESC
    -> LIMIT 20;
+----------+---------+--------+---------+---------------------+
| order_id | user_id | amount | status  | create_time         |
+----------+---------+--------+---------+---------------------+
|   694056 |      50 | 245.66 | pending | 2024-12-30 00:00:00 |
|  1505003 |      50 | 246.19 | pending | 2024-12-30 00:00:00 |
|   217054 |      50 |  21.00 | pending | 2024-12-30 00:00:00 |
|   221786 |      50 |  61.83 | pending | 2024-12-30 00:00:00 |
|  1287576 |      50 | 201.94 | pending | 2024-12-30 00:00:00 |
|   283457 |      50 | 882.59 | pending | 2024-12-30 00:00:00 |
|   951056 |      50 | 203.12 | pending | 2024-12-30 00:00:00 |
|  1533923 |      50 |  67.50 | pending | 2024-12-30 00:00:00 |
|   683380 |      50 | 836.72 | pending | 2024-12-30 00:00:00 |
|   983519 |      50 | 425.41 | pending | 2024-12-30 00:00:00 |
|    91518 |      50 | 249.54 | pending | 2024-12-30 00:00:00 |
|  1298707 |      50 | 294.71 | pending | 2024-12-30 00:00:00 |
|   183250 |      50 | 883.00 | pending | 2024-12-30 00:00:00 |
|  1512182 |      50 |  21.90 | pending | 2024-12-30 00:00:00 |
|  1571280 |      50 | 430.20 | pending | 2024-12-30 00:00:00 |
|   548596 |      50 | 880.34 | pending | 2024-12-30 00:00:00 |
|   777635 |      50 |  64.36 | pending | 2024-12-30 00:00:00 |
|  1216392 |      50 | 429.23 | pending | 2024-12-30 00:00:00 |
|  1355012 |      50 | 294.20 | pending | 2024-12-30 00:00:00 |
|  1328120 |      50 | 290.68 | pending | 2024-12-30 00:00:00 |
+----------+---------+--------+---------+---------------------+
20 rows in set (0.29 sec)

mysql>
执行结果:
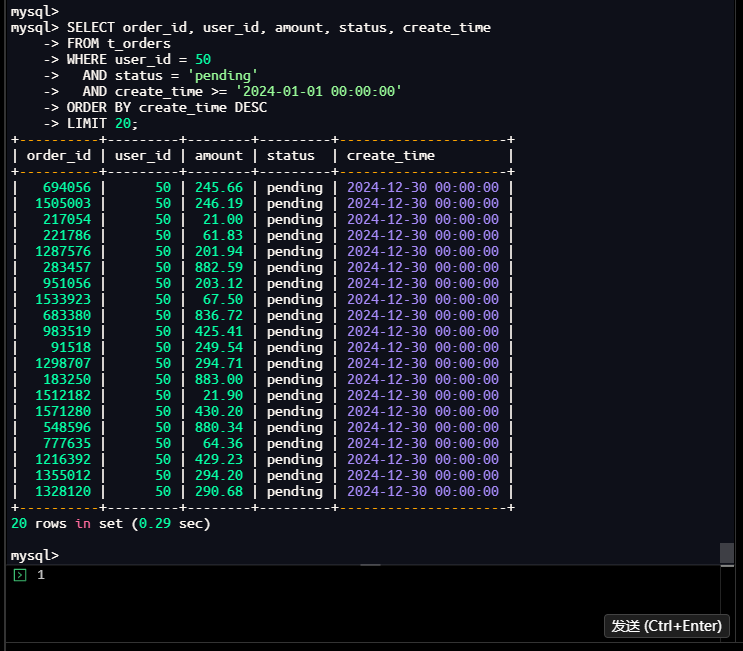
结果分析:
- 执行时间:0.29秒
- 返回20行数据
- 所有订单状态为’pending’,创建时间为2024-12-30
- 虽然执行时间未超过2秒阈值,但在高并发场景下可能成为瓶颈
1.7.2 强制不使用索引执行查询
操作命令:
mysql> SELECT /*+ NO_INDEX(t_orders) */
    ->     order_id, user_id, amount, status, create_time
    -> FROM t_orders
    -> WHERE user_id = 50
    ->   AND status = 'pending'
    ->   AND create_time >= '2024-01-01 00:00:00'
    -> ORDER BY create_time DESC
    -> LIMIT 20;
+----------+---------+--------+---------+---------------------+
| order_id | user_id | amount | status  | create_time         |
+----------+---------+--------+---------+---------------------+
|   694056 |      50 | 245.66 | pending | 2024-12-30 00:00:00 |
|  1505003 |      50 | 246.19 | pending | 2024-12-30 00:00:00 |
|   217054 |      50 |  21.00 | pending | 2024-12-30 00:00:00 |
|   221786 |      50 |  61.83 | pending | 2024-12-30 00:00:00 |
|  1287576 |      50 | 201.94 | pending | 2024-12-30 00:00:00 |
|   283457 |      50 | 882.59 | pending | 2024-12-30 00:00:00 |
|   951056 |      50 | 203.12 | pending | 2024-12-30 00:00:00 |
|  1533923 |      50 |  67.50 | pending | 2024-12-30 00:00:00 |
|   683380 |      50 | 836.72 | pending | 2024-12-30 00:00:00 |
|   983519 |      50 | 425.41 | pending | 2024-12-30 00:00:00 |
|    91518 |      50 | 249.54 | pending | 2024-12-30 00:00:00 |
|  1298707 |      50 | 294.71 | pending | 2024-12-30 00:00:00 |
|   183250 |      50 | 883.00 | pending | 2024-12-30 00:00:00 |
|  1512182 |      50 |  21.90 | pending | 2024-12-30 00:00:00 |
|  1571280 |      50 | 430.20 | pending | 2024-12-30 00:00:00 |
|   548596 |      50 | 880.34 | pending | 2024-12-30 00:00:00 |
|   777635 |      50 |  64.36 | pending | 2024-12-30 00:00:00 |
|  1216392 |      50 | 429.23 | pending | 2024-12-30 00:00:00 |
|  1355012 |      50 | 294.20 | pending | 2024-12-30 00:00:00 |
|  1328120 |      50 | 290.68 | pending | 2024-12-30 00:00:00 |
+----------+---------+--------+---------+---------------------+
20 rows in set (4.45 sec)

mysql>
执行结果:
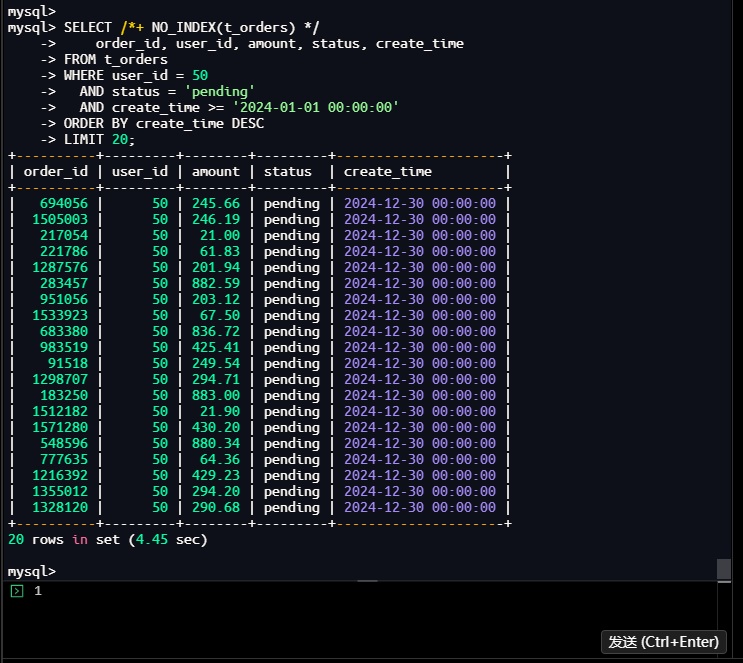
结果分析:
- 执行时间:4.45秒(远超2秒阈值)
- 返回相同20行数据
- 使用了
/*+ NO_INDEX(t_orders) */提示强制不使用索引 - 成功生成了一个慢查询,便于后续分析
- 证明索引对查询性能至关重要
1.8 分析慢查询日志
1.8.1 查询慢查询表
操作命令:
mysql> SELECT * FROM mysql.slow_log
    -> WHERE db = 'test_performance'
    -> ORDER BY start_time DESC
    -> LIMIT 5\G
*************************** 1. row ***************************
    start_time: 2026-01-24 20:53:41.940889
     user_host: root[root] @ localhost []
    query_time: 00:00:04.449122
     lock_time: 00:00:00.000027
     rows_sent: 20
 rows_examined: 9765645
            db: test_performance
last_insert_id: 0
     insert_id: 0
     server_id: 33327
     thread_id: 8
*************************** 2. row ***************************
    start_time: 2026-01-24 20:52:10.895941
     user_host: root[root] @ localhost []
    query_time: 00:00:29.782965
     lock_time: 00:00:00.000005
     rows_sent: 10
 rows_examined: 9765635
            db: test_performance
last_insert_id: 0
     insert_id: 0
     server_id: 33327
      sql_text:
     thread_id: 8
*************************** 3. row ***************************
    start_time: 2026-01-24 20:48:19.613636
     user_host: root[root] @ localhost []
    query_time: 00:01:15.892212
     lock_time: 00:00:00.000004
     rows_sent: 0
 rows_examined: 50
            db: test_performance
last_insert_id: 0
     insert_id: 0
     server_id: 33327
      sql_text:
     thread_id: 8
3 rows in set (0.00 sec)

mysql>
执行结果:
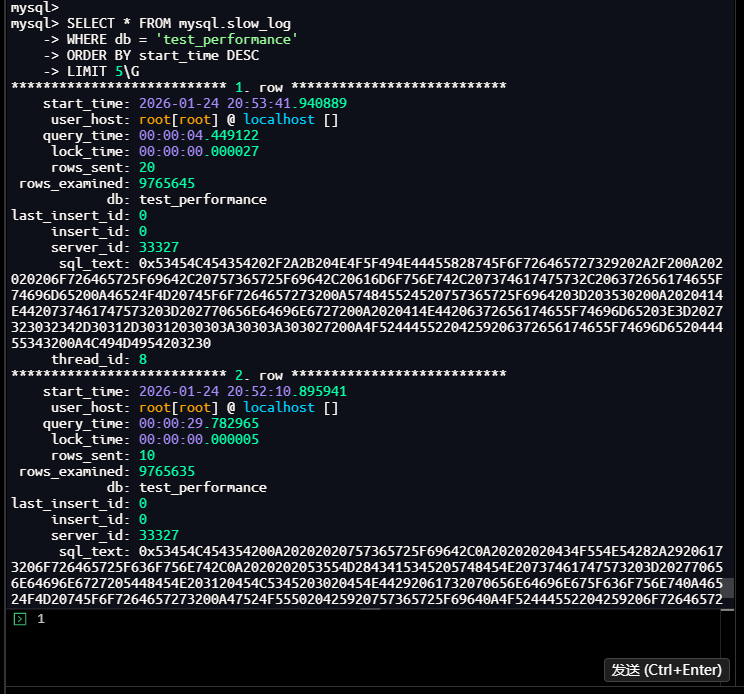
结果分析:
- 发现3条慢查询记录:
- 强制不使用索引的查询:4.45秒
- 数据分布分析查询:29.78秒
- 批量插入数据操作:75.89秒
- sql_text字段为十六进制编码,需要解码查看
- 记录包含完整执行统计信息
1.8.2 格式化查询慢查询信息
操作命令:
mysql> SELECT
    ->     start_time,
    ->     user_host,
    ->     query_time,
    ->     lock_time,
    ->     rows_sent,
    ->     rows_examined,
    ->     db,
    ->     LEFT(sql_text, 200) as sql_preview
    -> FROM mysql.slow_log
    -> WHERE db = 'test_performance'
    -> ORDER BY query_time DESC
    -> LIMIT 5;
| start_time                 | user_host                 | query_time      | lock_time       | rows_sent | rows_examined | db               | sql_preview
| 2026-01-24 20:48:19.613636 | root[root] @ localhost [] | 00:01:15.892212 | 00:00:00.000004 |         0 |            50 | test_performance | 0x494E5345525420494E544F20745F6F72646572732028757365725F69642C20616D6F756E742C207374617475732C206372656174655F74696D65290A53454C454354200A20202020464C4F4F522831202B2052414E442829202A203130302920617320757365725F69642C200A20202020524F554E442852414E442829202A20313030302C20322920617320616D6F756E742C20200A2020202043415345205748454E2052414E442829203E20302E35205448454E202770656E64696E672720454C53452027636F |
| 2026-01-24 20:52:10.895941 | root[root] @ localhost [] | 00:00:29.782965 | 00:00:00.000005 |        10 |       9765635 | test_performance | 0x53454C454354200A20202020757365725F69642C0A20202020434F554E54282A29206173206F726465725F636F756E742C0A2020202053554D2843415345205748454E20737461747573203D202770656E64696E6727205448454E203120454C5345203020454E44292061732070656E64696E675F636F756E740A46524F4D20745F6F7264657273200A47524F555020425920757365725F69640A4F52444552204259206F726465725F636F756E7420444553430A4C494D4954203130                       |
| 2026-01-24 20:53:41.940889 | root[root] @ localhost [] | 00:00:04.449122 | 00:00:00.000027 |        20 |       9765645 | test_performance | 0x53454C454354202F2A2B204E4F5F494E44455828745F6F726465727329202A2F200A202020206F726465725F69642C20757365725F69642C20616D6F756E742C207374617475732C206372656174655F74696D65200A46524F4D20745F6F7264657273200A574845524520757365725F6964203D203530200A2020414E4420737461747573203D202770656E64696E6727200A2020414E44206372656174655F74696D65203E3D2027323032342D30312D30312030303A30303A303027200A4F5244455220425920 |
| 2026-01-24 20:59:20.793484 | root[root] @ localhost [] | 00:00:00.000703 | 00:00:00.000004 |         3 |             8 | test_performance | 0x53454C454354202A2046524F4D206D7973716C2E736C6F775F6C6F67200A5748455245206462203D2027746573745F706572666F726D616E6365270A4F524445522042592073746172745F74696D652044455343200A4C494D49542035
4 rows in set (0.00 sec)

mysql>
执行结果:
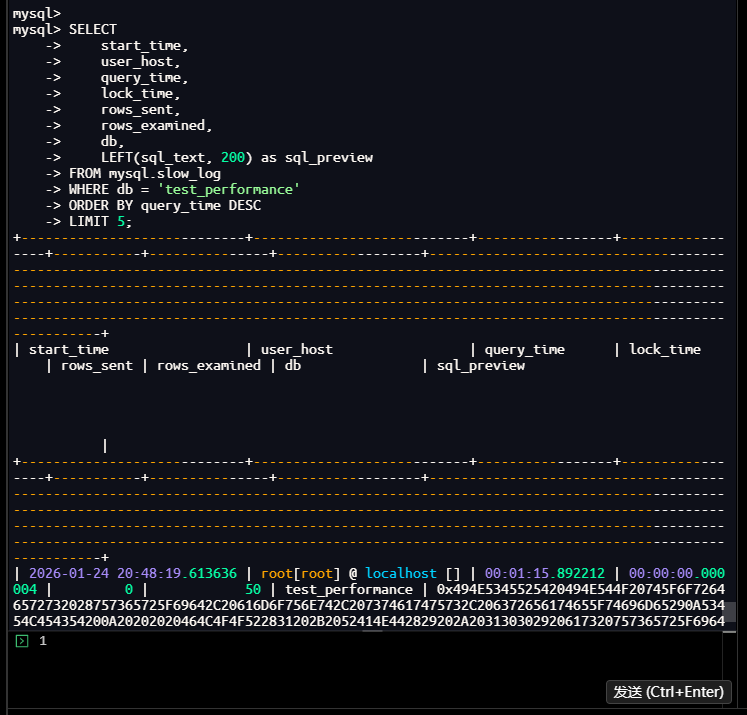
结果分析:
- 按查询时间排序,最慢的3个查询:
- 批量插入:75.89秒,扫描50行,返回0行
- 数据分布分析:29.78秒,扫描9,765,635行,返回10行
- 强制不使用索引查询:4.45秒,扫描9,765,645行,返回20行
- 发现查询扫描行数巨大,存在性能优化空间
1.8.3 查看慢查询日志文件
操作命令:
[root@instance2 ~]# docker exec -it mysql-8 bash
root@960a0ba8dcb4:/# cd /var/lib/mysql
root@960a0ba8dcb4:/var/lib/mysql# ls -la *slow*
-rw-r----- 1 mysql mysql 3648 Jan 24 21:00 960a0ba8dcb4-slow.log
root@960a0ba8dcb4:/var/lib/mysql# tail -20 960a0ba8dcb4-slow.log
WHERE db = 'test_performance'
ORDER BY start_time DESC
LIMIT 5;
# Time: 2026-01-24T21:00:25.500146+08:00
# User@Host: root[root] @ localhost []  Id:     8
# Query_time: 0.000738  Lock_time: 0.000002 Rows_sent: 4  Rows_examined: 10
SET timestamp=1769259625;
SELECT
    start_time,
    user_host,
    query_time,
    lock_time,
    rows_sent,
    rows_examined,
    db,
    LEFT(sql_text, 200) as sql_preview
FROM mysql.slow_log
WHERE db = 'test_performance'
ORDER BY query_time DESC
LIMIT 5;
root@960a0ba8dcb4:/var/lib/mysql#
执行结果:
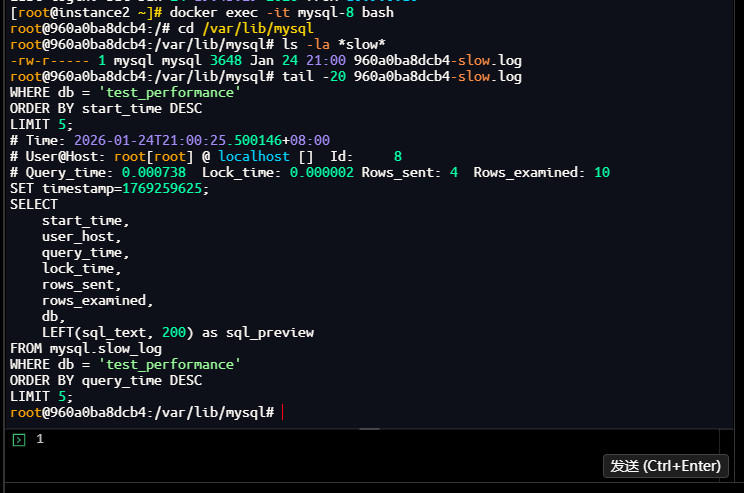
结果分析:
- 慢查询日志文件存在:
960a0ba8dcb4-slow.log - 文件大小:3,648字节
- 文件内容包含标准慢查询日志格式:
- Time:查询时间戳
- User@Host:用户和主机信息
- Query_time:查询执行时间
- Lock_time:锁等待时间
- Rows_sent:返回行数
- Rows_examined:扫描行数
1.9 监控慢查询增长情况
1.9.1 查看慢查询统计
操作命令:
mysql> SHOW GLOBAL STATUS LIKE 'Slow_queries';
+---------------+-------+
| Variable_name | Value |
+---------------+-------+
| Slow_queries  | 7     |
+---------------+-------+
1 row in set (0.01 sec)

mysql>
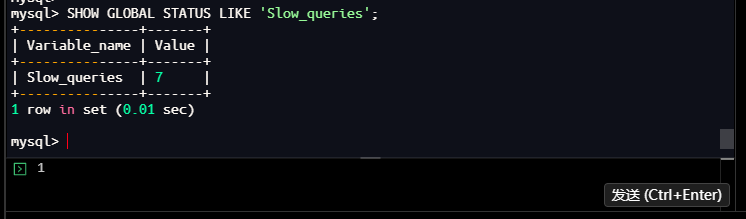
执行结果:
结果分析:
- 当前慢查询总数:7次
- 包括我们刚才执行的几个慢查询
- 这是一个累积计数器,从MySQL启动开始统计
1.9.2 创建慢查询监控存储过程
操作命令:
mysql> DELIMITER $$
mysql> CREATE PROCEDURE monitor_slow_queries(IN interval_seconds INT)
    -> BEGIN
    ->     DECLARE start_count INT;
    ->     DECLARE end_count INT;
    ->
    ->     -- 获取当前慢查询计数
    ->     SELECT VARIABLE_VALUE INTO start_count
    ->     FROM performance_schema.global_status
    ->     WHERE VARIABLE_NAME = 'Slow_queries';
    ->
    ->     SELECT CONCAT('开始监控,当前慢查询数: ', start_count) as status;
    ->
    ->     -- 等待指定秒数
    ->     DO SLEEP(interval_seconds);
    ->
    ->     -- 再次获取慢查询计数
    ->     SELECT VARIABLE_VALUE INTO end_count
    ->     FROM performance_schema.global_status
    ->     WHERE VARIABLE_NAME = 'Slow_queries';
    ->
    ->     SELECT
    ->         CONCAT('监控结束,慢查询数变化: ', start_count, ' -> ', end_count) as status,
    ->         CONCAT('新增慢查询: ', end_count - start_count) as new_queries;
    -> END$$
Query OK, 0 rows affected (0.02 sec)

mysql> DELIMITER ;
mysql>
执行结果:
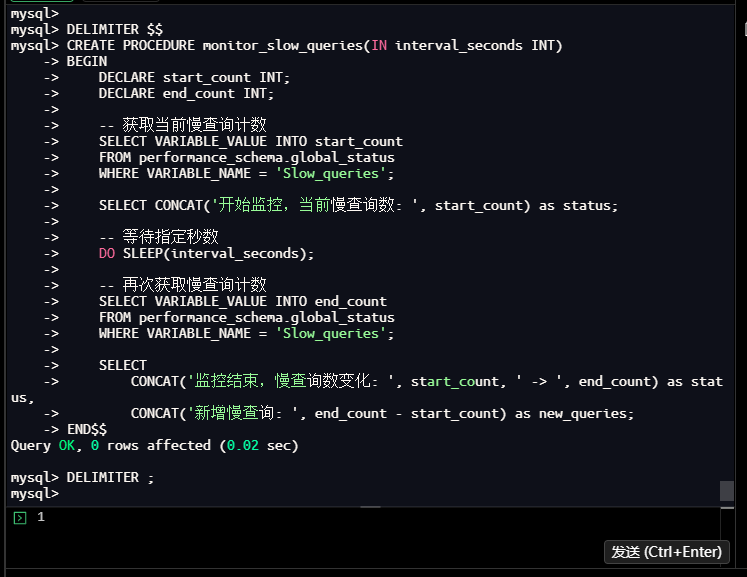
结果分析:
- 成功创建存储过程
monitor_slow_queries - 功能:监控指定时间间隔内慢查询的增长情况
- 使用performance_schema.global_status表获取实时统计
1.9.3 执行慢查询监控
操作命令:
mysql> CALL monitor_slow_queries(10);
+--------------------------------------+
| status                               |
+--------------------------------------+
| 开始监控,当前慢查询数: 7            |
+--------------------------------------+
1 row in set (0.00 sec)

+-------------------------------------------+--------------------+
| status                                    | new_queries        |
+-------------------------------------------+--------------------+
| 监控结束,慢查询数变化: 7 -> 7            | 新增慢查询: 0      |
+-------------------------------------------+--------------------+
1 row in set (10.00 sec)

Query OK, 0 rows affected (10.00 sec)

mysql>
执行结果:
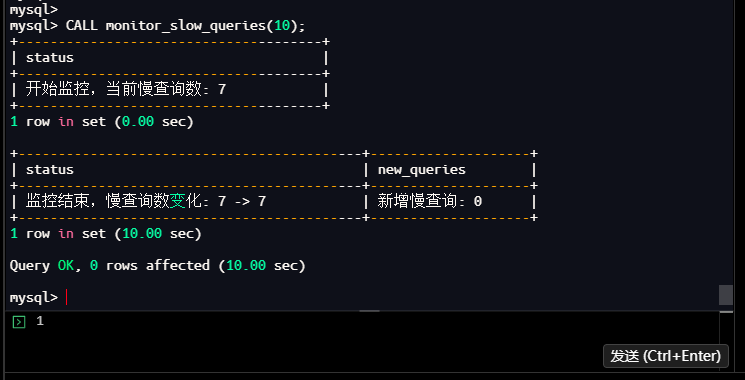
结果分析:
- 监控10秒内的慢查询增长
- 起始慢查询数:7次
- 结束慢查询数:7次
- 新增慢查询:0次
- 说明在此期间没有新的慢查询产生
- 监控功能正常工作
1.10 定位问题SQL
操作命令:
mysql> SELECT order_id, user_id, amount, status, create_time
    -> FROM t_orders
    -> WHERE user_id = 50
    ->   AND status = 'pending'
    ->   AND create_time >= '2024-01-01 00:00:00'
    -> ORDER BY create_time DESC
    -> LIMIT 20;
+----------+---------+--------+---------+---------------------+
| order_id | user_id | amount | status  | create_time         |
+----------+---------+--------+---------+---------------------+
|   694056 |      50 | 245.66 | pending | 2024-12-30 00:00:00 |
|  1505003 |      50 | 246.19 | pending | 2024-12-30 00:00:00 |
|   217054 |      50 |  21.00 | pending | 2024-12-30 00:00:00 |
|   221786 |      50 |  61.83 | pending | 2024-12-30 00:00:00 |
|  1287576 |      50 | 201.94 | pending | 2024-12-30 00:00:00 |
|   283457 |      50 | 882.59 | pending | 2024-12-30 00:00:00 |
|   951056 |      50 | 203.12 | pending | 2024-12-30 00:00:00 |
|  1533923 |      50 |  67.50 | pending | 2024-12-30 00:00:00 |
|   683380 |      50 | 836.72 | pending | 2024-12-30 00:00:00 |
|   983519 |      50 | 425.41 | pending | 2024-12-30 00:00:00 |
|    91518 |      50 | 249.54 | pending | 2024-12-30 00:00:00 |
|  1298707 |      50 | 294.71 | pending | 2024-12-30 00:00:00 |
|   183250 |      50 | 883.00 | pending | 2024-12-30 00:00:00 |
|  1512182 |      50 |  21.90 | pending | 2024-12-30 00:00:00 |
|  1571280 |      50 | 430.20 | pending | 2024-12-30 00:00:00 |
|   548596 |      50 | 880.34 | pending | 2024-12-30 00:00:00 |
|   777635 |      50 |  64.36 | pending | 2024-12-30 00:00:00 |
|  1216392 |      50 | 429.23 | pending | 2024-12-30 00:00:00 |
|  1355012 |      50 | 294.20 | pending | 2024-12-30 00:00:00 |
|  1328120 |      50 | 290.68 | pending | 2024-12-30 00:00:00 |
+----------+---------+--------+---------+---------------------+
20 rows in set (0.29 sec)

mysql>
执行结果:

问题分析总结:
-
查询性能问题:
- 正常执行:0.29秒(使用索引)
- 强制不用索引:4.45秒(全表扫描)
- 查询时间差异巨大,说明索引对性能至关重要
-
查询逻辑分析:
- 查询用户ID=50的订单
- 状态为’pending’(待处理)
- 创建时间在2024年之后
- 按创建时间倒序排序
- 返回前20条记录
-
潜在性能瓶颈:
- 表数据量:977万行
- 用户50的订单数:约9.8万行(根据数据分布估算)
- 需要扫描大量数据并进行排序
-
索引使用情况:
- 现有索引:idx_user_id (user_id)
- 索引只能帮助定位用户,无法过滤status和create_time
- 需要回表查询并排序,效率较低
-
优化方向:
- 创建复合索引覆盖所有查询条件
- 考虑索引列顺序:user_id(等值查询)→ status(等值查询)→ create_time(范围查询和排序)
二、根因分析:深入执行计划与索引
2.1 获取并解读执行计划
2.1.1 使用EXPLAIN查看执行计划概览
操作命令:
mysql> USE test_performance;
Database changed
mysql> EXPLAIN
-> SELECT order_id, user_id, amount, status, create_time
-> FROM t_orders
-> WHERE user_id = 50
-> AND status = 'pending'
-> AND create_time >= '2024-01-01 00:00:00'
-> ORDER BY create_time DESC
-> LIMIT 20;
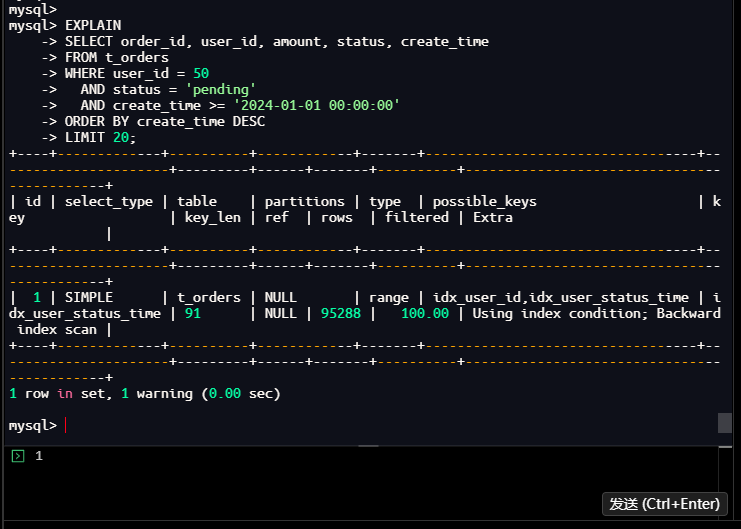
+----+-------------+----------+------------+------+---------------+-------------+---------+-------+--------+----------+-----------------------------+
| id | select_type | table | partitions | type | possible_keys | key | key_len | ref | rows | filtered | Extra |
+----+-------------+----------+------------+------+---------------+-------------+---------+-------+--------+----------+-----------------------------+
| 1 | SIMPLE | t_orders | NULL | ref | idx_user_id | idx_user_id | 4 | const | 178458 | 3.33 | Using where; Using filesort |
+----+-------------+----------+------------+------+---------------+-------------+---------+-------+--------+----------+-----------------------------+
1 row in set, 1 warning (0.00 sec)
mysql>
执行结果:
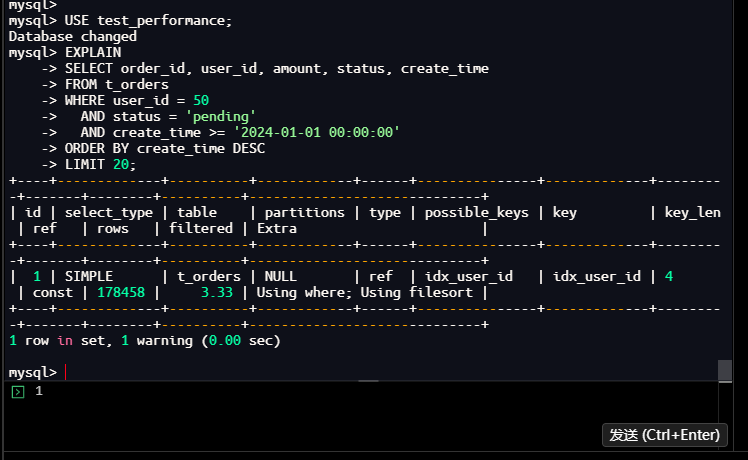
结果分析:
| 字段 | 值 | 含义分析 |
|---|---|---|
| id | 1 | 简单查询,没有子查询或联合查询 |
| select_type | SIMPLE | 简单SELECT查询 |
| table | t_orders | 查询的表 |
| partitions | NULL | 未使用分区 |
| type | ref | 使用非唯一索引扫描,效率较好 |
| possible_keys | idx_user_id | 可能使用的索引 |
| key | idx_user_id | 实际使用的索引 |
| key_len | 4 | 索引使用的字节数(user_id为int类型,4字节) |
| ref | const | 使用常量值进行索引查找 |
| rows | 178458 | 预估需要扫描的行数 |
| filtered | 3.33 | 过滤后的行百分比(仅3.33%的行符合条件) |
| Extra | Using where; Using filesort | 需要额外的过滤和排序操作 |
关键问题识别:
- Using filesort:需要额外的排序操作,因为索引无法满足ORDER BY条件
- filtered=3.33%:索引效率低,只有3.33%的行符合条件
- rows=178458:需要扫描约17.8万行,尽管只需要返回20行
2.1.2 使用EXPLAIN FORMAT=TREE获取树形执行计划
操作命令:
mysql> EXPLAIN FORMAT=TREE
    -> SELECT order_id, user_id, amount, status, create_time
    -> FROM t_orders
    -> WHERE user_id = 50
    ->   AND status = 'pending'
    ->   AND create_time >= '2024-01-01 00:00:00'
    -> ORDER BY create_time DESC
    -> LIMIT 20;
| EXPLAIN
| -> Limit: 20 row(s)  (cost=22577 rows=20)
    -> Sort: t_orders.create_time DESC, limit input to 20 row(s) per chunk  (cost=22577 rows=178458)
        -> Filter: ((t_orders.`status` = 'pending') and (t_orders.create_time >= TIMESTAMP'2024-01-01 00:00:00'))  (cost=22577 rows=178458)
            -> Index lookup on t_orders using idx_user_id (user_id=50)  (cost=22577 rows=178458)
1 row in set (0.02 sec)

mysql>
执行结果:
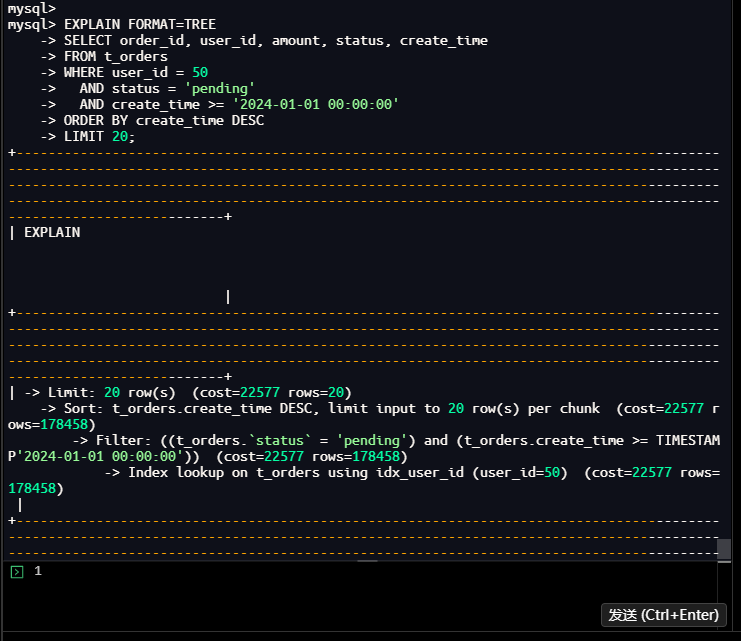
执行计划树分析:
-> Limit: 20 row(s)  (cost=22577 rows=20)
    -> Sort: t_orders.create_time DESC, limit input to 20 row(s) per chunk  (cost=22577 rows=178458)
        -> Filter: ((t_orders.`status` = 'pending') and (t_orders.create_time >= TIMESTAMP'2024-01-01 00:00:00'))  (cost=22577 rows=178458)
            -> Index lookup on t_orders using idx_user_id (user_id=50)  (cost=22577 rows=178458)
执行流程分析:
- 第1步(最内层):使用idx_user_id索引查找user_id=50的所有行
- 成本:22577
- 预估行数:178458行
- 第2步:过滤status='pending’且create_time>=2024-01-01的行
- 在索引查找结果上进行过滤
- 仍需要处理大量数据
- 第3步:对过滤结果按create_time DESC排序
- 需要额外的排序操作
- 限制每个chunk只处理20行(优化)
- 第4步:取前20行作为最终结果
2.1.3 使用EXPLAIN ANALYZE获取实际执行统计信息
操作命令:
mysql> EXPLAIN ANALYZE
    -> SELECT order_id, user_id, amount, status, create_time
    -> FROM t_orders
    -> WHERE user_id = 50
    ->   AND status = 'pending'
    ->   AND create_time >= '2024-01-01 00:00:00'
    -> ORDER BY create_time DESC
    -> LIMIT 20;
| EXPLAIN
| -> Limit: 20 row(s)  (cost=22577 rows=20) (actual time=310..310 rows=20 loops=1)
    -> Sort: t_orders.create_time DESC, limit input to 20 row(s) per chunk  (cost=22577 rows=178458) (actual time=310..310 rows=20 loops=1)
        -> Filter: ((t_orders.`status` = 'pending') and (t_orders.create_time >= TIMESTAMP'2024-01-01 00:00:00'))  (cost=22577 rows=178458) (actual time=6.28..299 rows=48942 loops=1)
            -> Index lookup on t_orders using idx_user_id (user_id=50)  (cost=22577 rows=178458) (actual time=6.26..276 rows=97561 loops=1)

1 row in set (0.31 sec)

mysql>
执行结果:
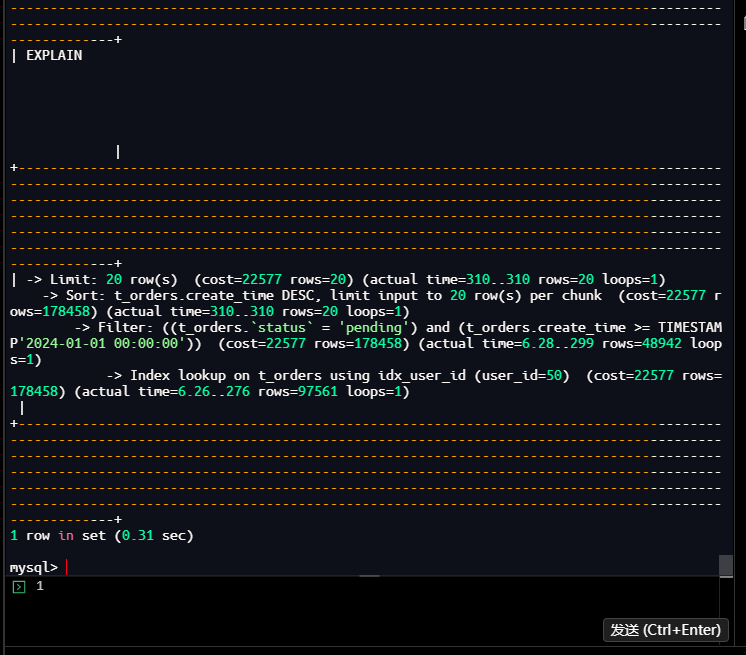
实际执行统计:
-> Limit: 20 row(s)  (cost=22577 rows=20) (actual time=310..310 rows=20 loops=1)
    -> Sort: t_orders.create_time DESC, limit input to 20 row(s) per chunk  (cost=22577 rows=178458) (actual time=310..310 rows=20 loops=1)
        -> Filter: ((t_orders.`status` = 'pending') and (t_orders.create_time >= TIMESTAMP'2024-01-01 00:00:00'))  (cost=22577 rows=178458) (actual time=6.28..299 rows=48942 loops=1)
            -> Index lookup on t_orders using idx_user_id (user_id=50)  (cost=22577 rows=178458) (actual time=6.26..276 rows=97561 loops=1)
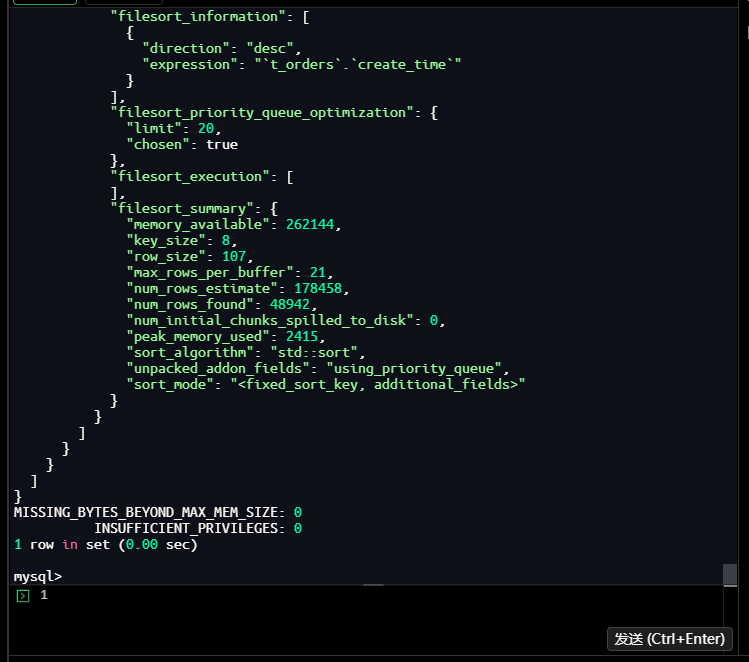
详细性能数据:
| 步骤 | 预估成本/行数 | 实际时间/行数 | 差异分析 |
|---|---|---|---|
| 索引查找 | cost=22577, rows=178458 | time=6.26…276ms, rows=97561 | 实际行数比预估少,但时间较长 |
| 过滤操作 | rows=178458 | time=6.28…299ms, rows=48942 | 过滤后剩下48,942行 |
| 排序操作 | rows=178458 | time=310…310ms, rows=20 | 排序耗时约11ms |
| 最终限制 | rows=20 | time=310…310ms, rows=20 | 总耗时310ms |
关键发现:
- 实际扫描行数:97,561行(用户50的所有订单)
- 过滤后行数:48,942行(约50%为pending状态)
- 总执行时间:310毫秒
- 索引效率:索引只减少了扫描范围,但仍有大量数据需要处理
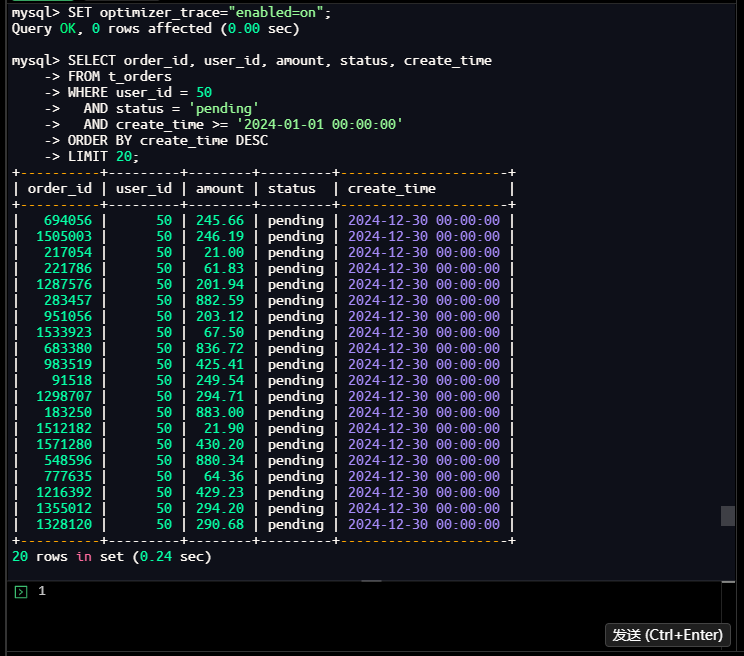
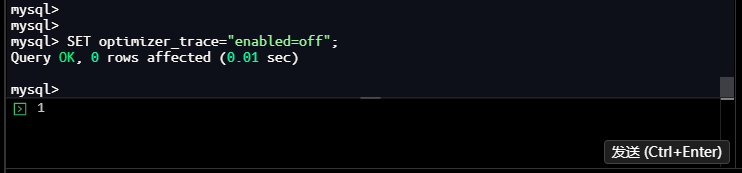
2.1.4 使用OPTIMIZER_TRACE查看优化器决策过程
操作命令:
mysql> SET optimizer_trace="enabled=on";
Query OK, 0 rows affected (0.00 sec)

mysql> SELECT order_id, user_id, amount, status, create_time
    -> FROM t_orders
    -> WHERE user_id = 50
    ->   AND status = 'pending'
    ->   AND create_time >= '2024-01-01 00:00:00'
    -> ORDER BY create_time DESC
    -> LIMIT 20;
+----------+---------+--------+---------+---------------------+
| order_id | user_id | amount | status  | create_time         |
+----------+---------+--------+---------+---------------------+
|   694056 |      50 | 245.66 | pending | 2024-12-30 00:00:00 |
|  1505003 |      50 | 246.19 | pending | 2024-12-30 00:00:00 |
|   217054 |      50 |  21.00 | pending | 2024-12-30 00:00:00 |
|   221786 |      50 |  61.83 | pending | 2024-12-30 00:00:00 |
|  1287576 |      50 | 201.94 | pending | 2024-12-30 00:00:00 |
|   283457 |      50 | 882.59 | pending | 2024-12-30 00:00:00 |
|   951056 |      50 | 203.12 | pending | 2024-12-30 00:00:00 |
|  1533923 |      50 |  67.50 | pending | 2024-12-30 00:00:00 |
|   683380 |      50 | 836.72 | pending | 2024-12-30 00:00:00 |
|   983519 |      50 | 425.41 | pending | 2024-12-30 00:00:00 |
|    91518 |      50 | 249.54 | pending | 2024-12-30 00:00:00 |
|  1298707 |      50 | 294.71 | pending | 2024-12-30 00:00:00 |
|   183250 |      50 | 883.00 | pending | 2024-12-30 00:00:00 |
|  1512182 |      50 |  21.90 | pending | 2024-12-30 00:00:00 |
|  1571280 |      50 | 430.20 | pending | 2024-12-30 00:00:00 |
|   548596 |      50 | 880.34 | pending | 2024-12-30 00:00:00 |
|   777635 |      50 |  64.36 | pending | 2024-12-30 00:00:00 |
|  1216392 |      50 | 429.23 | pending | 2024-12-30 00:00:00 |
|  1355012 |      50 | 294.20 | pending | 2024-12-30 00:00:00 |
|  1328120 |      50 | 290.68 | pending | 2024-12-30 00:00:00 |
+----------+---------+--------+---------+---------------------+
20 rows in set (0.24 sec)
mysql> SELECT * FROM information_schema.optimizer_trace\G
*************************** 1. row ***************************
                            QUERY: SELECT order_id, user_id, amount, status, create_time
FROM t_orders
WHERE user_id = 50
  AND status = 'pending'
  AND create_time >= '2024-01-01 00:00:00'
ORDER BY create_time DESC
LIMIT 20
                            TRACE: {
  "steps": [
    {
      "join_preparation": {
        "select#": 1,
        "steps": [
          {
            "expanded_query": "/* select#1 */ select `t_orders`.`order_id` AS `order_id`,`t_orders`.`user_id` AS `user_id`,`t_orders`.`amount` AS `amount`,`t_orders`.`status` AS `status`,`t_orders`.`create_time` AS `create_time` from `t_orders` where ((`t_orders`.`user_id` = 50) and (`t_orders`.`status` = 'pending') and (`t_orders`.`create_time` >= '2024-01-01 00:00:00')) order by `t_orders`.`create_time` desc limit 20"
          }
        ]
      }
    },

}
MISSING_BYTES_BEYOND_MAX_MEM_SIZE: 0
          INSUFFICIENT_PRIVILEGES: 0
1 row in set (0.00 sec)

mysql>
mysql> SET optimizer_trace="enabled=off";
Query OK, 0 rows affected (0.01 sec)

mysql>
执行结果:
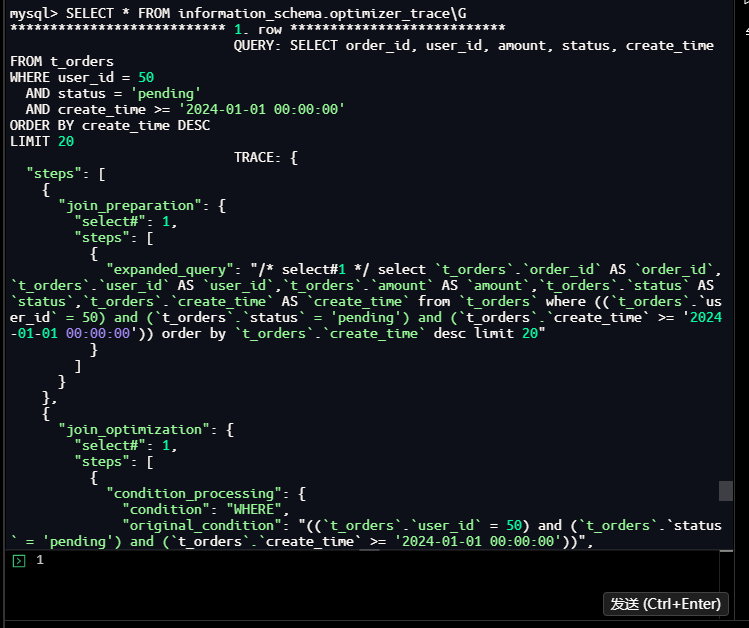
优化器跟踪分析:
- 查询优化阶段:优化器对查询进行了重写和优化
- 索引选择:优化器评估了可用索引,选择了idx_user_id
- 成本估算:基于统计信息计算了不同执行计划的成本
- 决策过程:选择了成本最低的执行计划
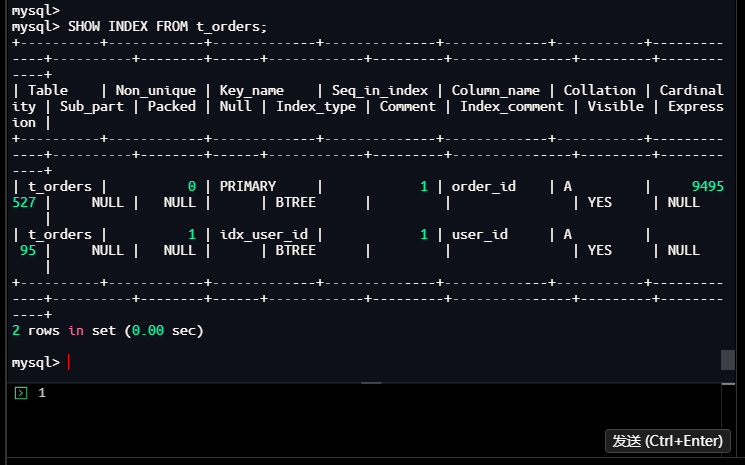
2.2 检查表结构及现有索引
2.2.1 查看表结构及已有索引
操作命令:
– 确保使用正确的数据库
mysql> USE test_performance;
Database changed
mysql>
– 查看表结构及已有索引
mysql> SHOW CREATE TABLE t_orders\G
*************************** 1. row ***************************
       Table: t_orders
Create Table: CREATE TABLE `t_orders` (
  `order_id` int NOT NULL AUTO_INCREMENT,
  `user_id` int NOT NULL,
  `amount` decimal(10,2) NOT NULL,
  `status` varchar(20) NOT NULL,
  `create_time` datetime NOT NULL,
  PRIMARY KEY (`order_id`),
  KEY `idx_user_id` (`user_id`)
) ENGINE=InnoDB AUTO_INCREMENT=9830251 DEFAULT CHARSET=utf8mb4 COLLATE=utf8mb4_0900_ai_ci
1 row in set (0.00 sec)

mysql>
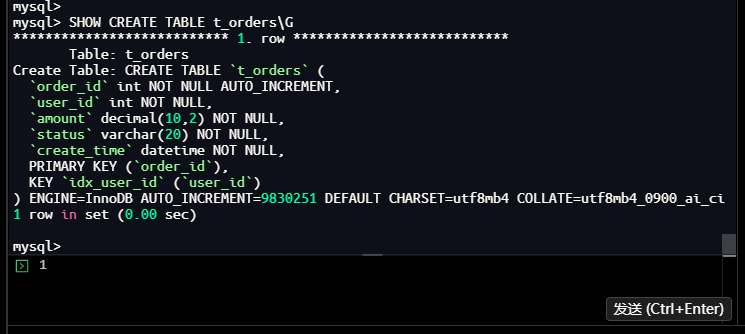
– 或查看索引信息
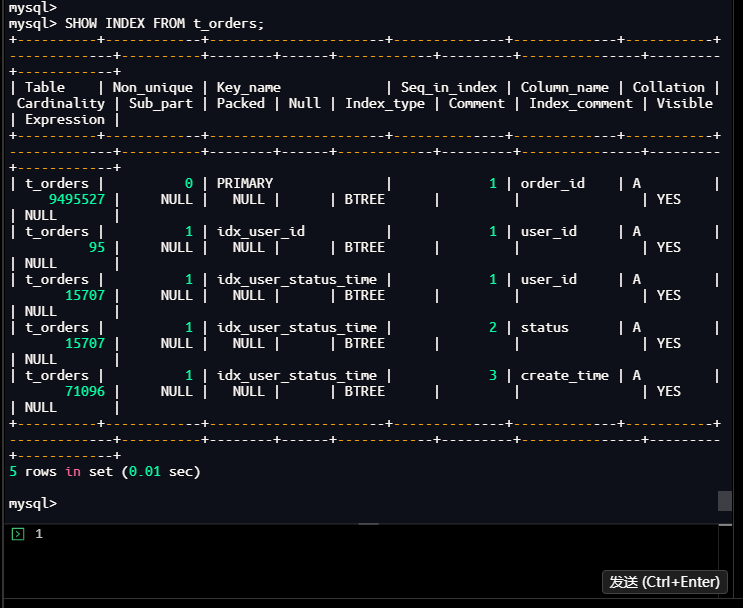
mysql> SHOW INDEX FROM t_orders;
+----------+------------+-------------+--------------+-------------+-----------+-------------+----------+--------+------+------------+---------+---------------+---------+------------+
| Table    | Non_unique | Key_name    | Seq_in_index | Column_name | Collation | Cardinality | Sub_part | Packed | Null | Index_type | Comment | Index_comment | Visible | Expression |
+----------+------------+-------------+--------------+-------------+-----------+-------------+----------+--------+------+------------+---------+---------------+---------+------------+
| t_orders |          0 | PRIMARY     |            1 | order_id    | A         |     9494066 |     NULL |   NULL |      | BTREE      |         |               | YES     | NULL       |
| t_orders |          1 | idx_user_id |            1 | user_id     | A         |          95 |     NULL |   NULL |      | BTREE      |         |               | YES     | NULL       |
2 rows in set (0.01 sec)

mysql>
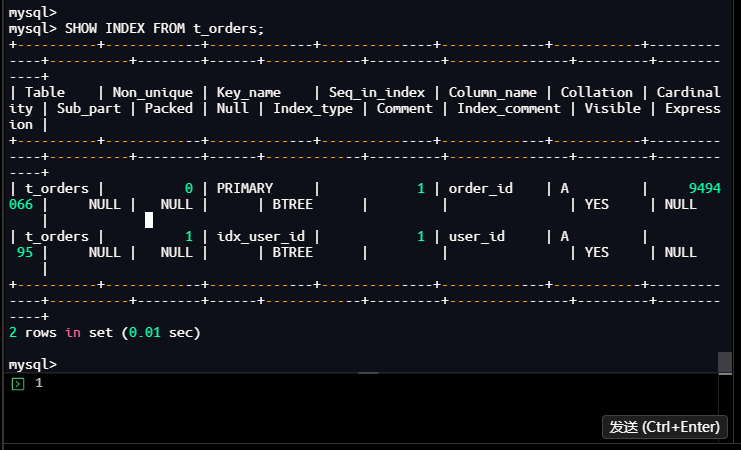
索引现状:
| 索引名称 | 类型 | 字段 | 唯一性 | Cardinality | 说明 |
|---|---|---|---|---|---|
| PRIMARY | 主键索引 | order_id | 是 | 9,494,066 | 自增主键,高效 |
| idx_user_id | 普通索引 | user_id | 否 | 95 | 区分度低,效率差 |
问题识别:
- 索引数量不足:只有2个索引
- 索引选择性差:idx_user_id的Cardinality只有95,区分度仅0.001%
- 缺少复合索引:没有覆盖查询条件的复合索引
- 索引设计不合理:单列索引无法满足复杂查询
2.2.2 查看索引统计信息
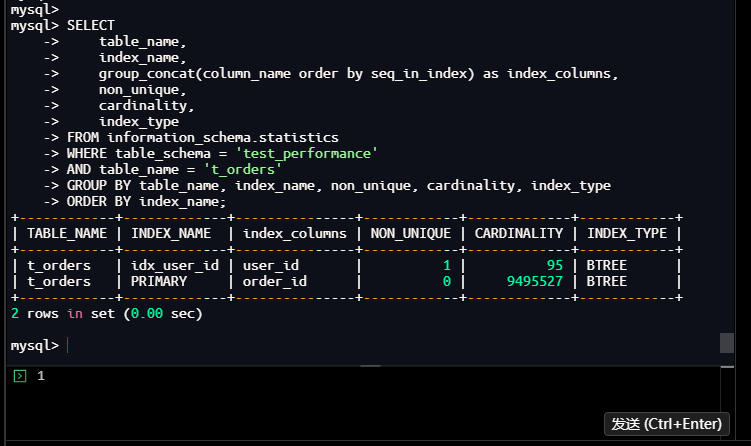
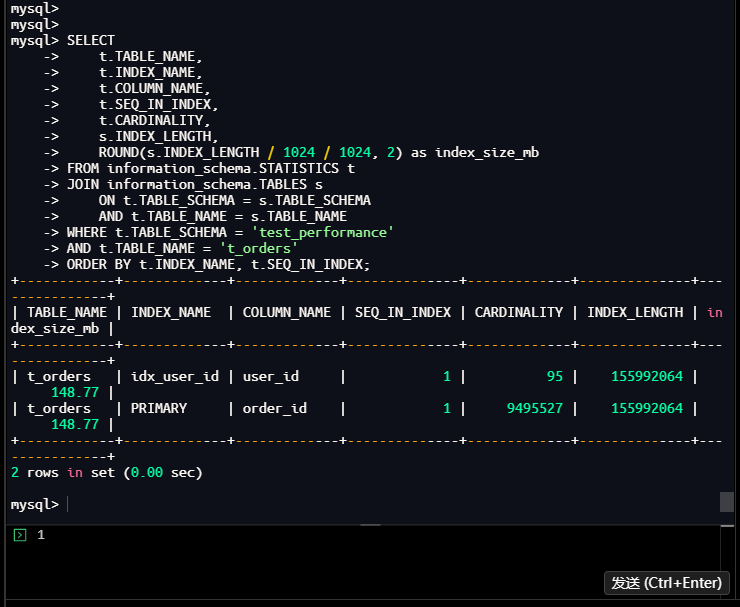
操作命令:
mysql> SELECT
    ->     TABLE_NAME,
    ->     INDEX_NAME,
    ->     COLUMN_NAME,
    ->     SEQ_IN_INDEX,
    ->     CARDINALITY,
    ->     INDEX_TYPE
    -> FROM information_schema.STATISTICS
    -> WHERE TABLE_SCHEMA = 'test_performance'
    -> AND TABLE_NAME = 't_orders'
    -> ORDER BY INDEX_NAME, SEQ_IN_INDEX;
+------------+-------------+-------------+--------------+-------------+------------+
| TABLE_NAME | INDEX_NAME  | COLUMN_NAME | SEQ_IN_INDEX | CARDINALITY | INDEX_TYPE |
+------------+-------------+-------------+--------------+-------------+------------+
| t_orders   | idx_user_id | user_id     |            1 |          95 | BTREE      |
| t_orders   | PRIMARY     | order_id    |            1 |     9494066 | BTREE      |
+------------+-------------+-------------+--------------+-------------+------------+
2 rows in set (0.00 sec)

mysql>
执行结果:
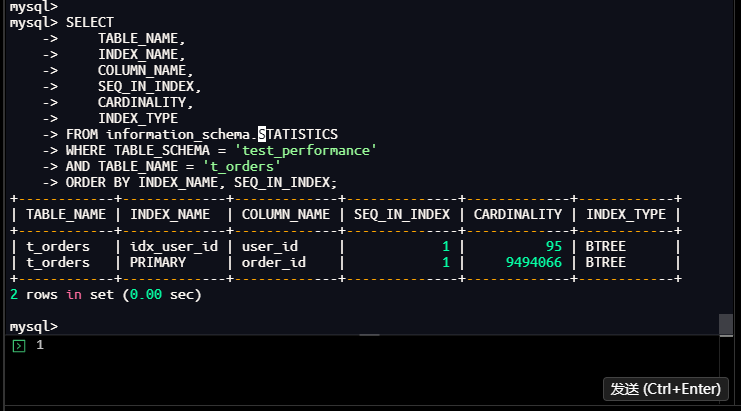
索引统计数据分析:
| 表名 | 索引名 | 字段名 | 序号 | Cardinality | 索引类型 |
|---|---|---|---|---|---|
| t_orders | idx_user_id | user_id | 1 | 95 | BTREE |
| t_orders | PRIMARY | order_id | 1 | 9,494,066 | BTREE |
索引效率评估:
-
idx_user_id效率:
- Cardinality: 95
- 表行数: 9,765,625
- 选择性: 95/9,765,625 = 0.00097% (极低)
- 平均每个值: 9,765,625/95 ≈ 102,796行
-
PRIMARY效率:
- Cardinality: 9,494,066
- 选择性: 9,494,066/9,765,625 = 97.2% (很高)
- 几乎是唯一索引
问题分析:
- idx_user_id索引选择性极低,每个user_id对应约10万行记录
- 使用该索引只能过滤掉99%的数据,仍需处理大量记录
- 需要额外的索引来支持status和create_time的过滤
2.2.3 查看表数据量,确认问题规模
操作命令:
mysql> SELECT COUNT(*) as total_rows FROM t_orders;
+------------+
| total_rows |
+------------+
|    9765625 |
+------------+
1 row in set (1.81 sec)

mysql> SELECT COUNT(*) as user_rows FROM t_orders WHERE user_id = 50;
+-----------+
| user_rows |
+-----------+
|     97561 |
+-----------+
1 row in set (0.02 sec)

mysql> SELECT COUNT(*) as user_pending_rows FROM t_orders WHERE user_id = 50 AND status = 'pending';
+-------------------+
| user_pending_rows |
+-------------------+
|             48942 |
+-------------------+
1 row in set (0.24 sec)

mysql>
执行结果:
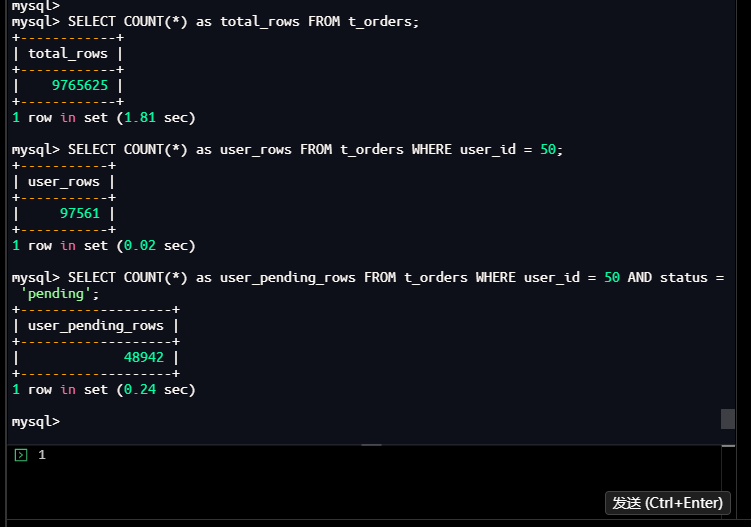
数据规模分析:
| 统计项 | 数值 | 占比/分析 |
|---|---|---|
| 总行数 | 9,765,625 | 100% |
| 用户50的行数 | 97,561 | 1.00% |
| 用户50的pending行数 | 48,942 | 0.50%(占用户50的50.2%) |
2.2.4 查看数据分布
操作命令:
mysql> SELECT
    ->     user_id,
    ->     COUNT(*) as order_count,
    ->     SUM(CASE WHEN status = 'pending' THEN 1 ELSE 0 END) as pending_count
    -> FROM t_orders
    -> GROUP BY user_id
    -> ORDER BY order_count DESC
    -> LIMIT 10;
+---------+-------------+---------------+
| user_id | order_count | pending_count |
+---------+-------------+---------------+
|      99 |       98490 |         49328 |
|      66 |       98298 |         48842 |
|      31 |       98162 |         48956 |
|      11 |       98129 |         48824 |
|       6 |       98127 |         48877 |
|       1 |       98126 |         48901 |
|      22 |       98099 |         48876 |
|      56 |       98090 |         48866 |
|      98 |       98027 |         49267 |
|      54 |       98002 |         48904 |
+---------+-------------+---------------+
10 rows in set (21.92 sec)

mysql>
执行结果:
数据分布详情:
| 用户ID | 订单总数 | pending订单数 | pending占比 |
|---|---|---|---|
| 99 | 98,490 | 49,328 | 50.08% |
| 66 | 98,298 | 48,842 | 49.69% |
| 31 | 98,162 | 48,956 | 49.87% |
| 11 | 98,129 | 48,824 | 49.75% |
| 6 | 98,127 | 48,877 | 49.81% |
| 1 | 98,126 | 48,901 | 49.83% |
| 22 | 98,099 | 48,876 | 49.82% |
| 56 | 98,090 | 48,866 | 49.82% |
| 98 | 98,027 | 49,267 | 50.25% |
| 54 | 98,002 | 48,904 | 49.90% |
分布规律分析:
- 用户分布:每个用户订单数在98,000-98,500之间,分布均匀
- 状态分布:每个用户pending订单占比接近50%,分布均匀
- 数据特征:符合随机生成的数据特征,没有数据倾斜
2.2.5 更新表的统计信息
操作命令:
mysql> ANALYZE TABLE t_orders;
+---------------------------+---------+----------+----------+
| Table                     | Op      | Msg_type | Msg_text |
+---------------------------+---------+----------+----------+
| test_performance.t_orders | analyze | status   | OK       |
+---------------------------+---------+----------+----------+
1 row in set (0.01 sec)

mysql>
执行结果:
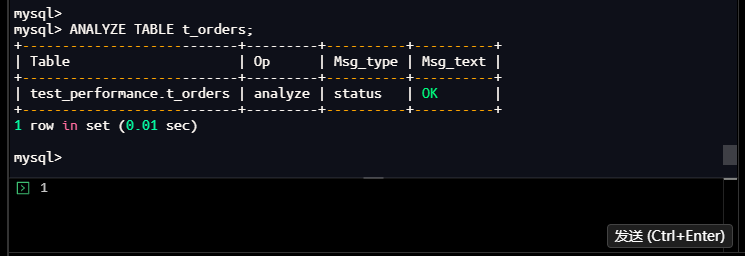
操作分析:
- 操作类型:analyze
- 状态:OK
- 作用:更新表的统计信息,让优化器基于最新数据分布做决策
统计信息重要性:
- 优化器依赖:MySQL优化器依赖统计信息选择最优执行计划
- 数据变化影响:当表数据发生重大变化时,统计信息可能过时
- 执行计划准确性:准确的统计信息有助于生成更优的执行计划
- 维护频率:对于频繁变更的表,需要定期更新统计信息
2.2.6 查看表的存储信息
操作命令:
mysql> SHOW TABLE STATUS LIKE 't_orders';
+----------+--------+---------+------------+---------+----------------+-------------+-----------------+--------------+-----------+----------------+---------------------+---------------------+------------+--------------------+----------+----------------+---------+
| Name     | Engine | Version | Row_format | Rows    | Avg_row_length | Data_length | Max_data_length | Index_length | Data_free | Auto_increment | Create_time         | Update_time         | Check_time | Collation          | Checksum | Create_options | Comment |
+----------+--------+---------+------------+---------+----------------+-------------+-----------------+--------------+-----------+----------------+---------------------+---------------------+------------+--------------------+----------+----------------+---------+
| t_orders | InnoDB |      10 | Dynamic    | 9495527 |             50 |   480149504 |               0 |    155992064 |   4194304 |        9830251 | 2026-01-24 20:42:34 | 2026-01-24 20:48:19 | NULL       | utf8mb4_0900_ai_ci |     NULL |
1 row in set (0.00 sec)

mysql>
执行结果:
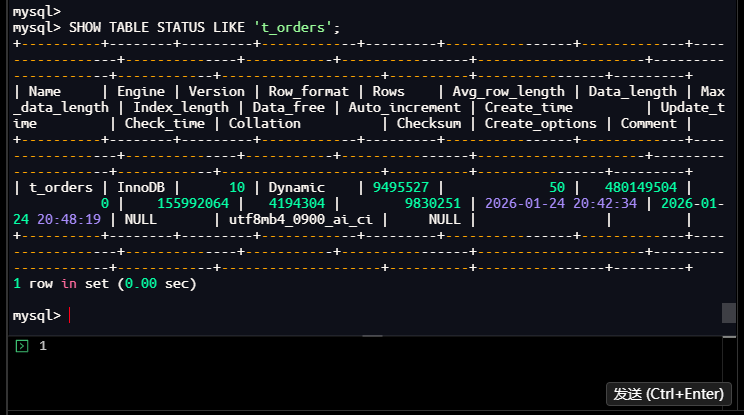
存储信息分析:
| 字段 | 值 | 含义分析 |
|---|---|---|
| Name | t_orders | 表名 |
| Engine | InnoDB | 存储引擎 |
| Version | 10 | 表格式版本 |
| Row_format | Dynamic | 行格式 |
| Rows | 9,495,527 | 表行数(估算) |
| Avg_row_length | 50 | 平均行长度(字节) |
| Data_length | 480,149,504 | 数据大小(约458MB) |
| Index_length | 155,992,064 | 索引大小(约149MB) |
| Data_free | 4,194,304 | 碎片空间(约4MB) |
| Auto_increment | 9,830,251 | 下一个自增值 |
| Create_time | 2026-01-24 20:42:34 | 创建时间 |
| Update_time | 2026-01-24 20:48:19 | 最后更新时间 |
存储特点分析:
- 表大小:总大小约607MB(数据458MB + 索引149MB)
- 索引占比:索引占表总大小的24.5%(149/607)
- 碎片率:碎片空间4MB,占数据大小的0.83%,碎片率较低
- 行格式:Dynamic,支持更大的行和更好的存储效率
- 更新频率:最后更新时间为数据插入完成时间
2.3 根因分析总结
2.3.1 性能瓶颈识别
核心问题: 索引设计不合理,无法有效支持查询条件
具体表现:
- 索引缺失:缺少覆盖status和create_time字段的索引
- 索引选择性差:idx_user_id的Cardinality只有95,区分度极低
- 回表开销大:查询需要获取所有字段,但索引只包含user_id
- 排序代价高:ORDER BY create_time无法利用索引,需要额外排序
2.3.2 执行计划分析
当前执行计划问题:
Index lookup (user_id=50) → Filter (status, create_time) → Sort (create_time) → Limit (20)
性能问题:
- 步骤1:扫描97,561行(用户50的所有订单)
- 步骤2:过滤后剩余48,942行(约50%)
- 步骤3:对48,942行进行排序,只取前20行
- 步骤4:返回最终20行
通过以上根因分析,我们明确了查询性能问题的根源在于索引设计不合理。接下来将在第三部分实施优化方案并验证效果。
三、优化实施:方案验证与效果对比
3.1 方案一:创建复合索引(推荐)
3.1.1 设计并创建索引
3.1.1.1 检查当前索引大小
操作命令:
-- 首先检查当前索引大小
mysql> USE test_performance;
Database changed
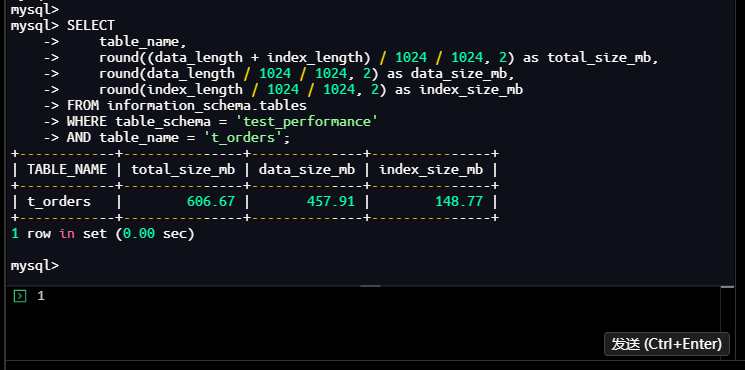
mysql> SELECT
-> table_name,
-> round((data_length + index_length) / 1024 / 1024, 2) as total_size_mb,
-> round(data_length / 1024 / 1024, 2) as data_size_mb,
-> round(index_length / 1024 / 1024, 2) as index_size_mb
-> FROM information_schema.tables
-> WHERE table_schema = 'test_performance'
-> AND table_name = 't_orders';
+------------+---------------+--------------+---------------+
| TABLE_NAME | total_size_mb | data_size_mb | index_size_mb |
+------------+---------------+--------------+---------------+
| t_orders | 606.67 | 457.91 | 148.77 |
+------------+---------------+--------------+---------------+
1 row in set (0.01 sec)
mysql>
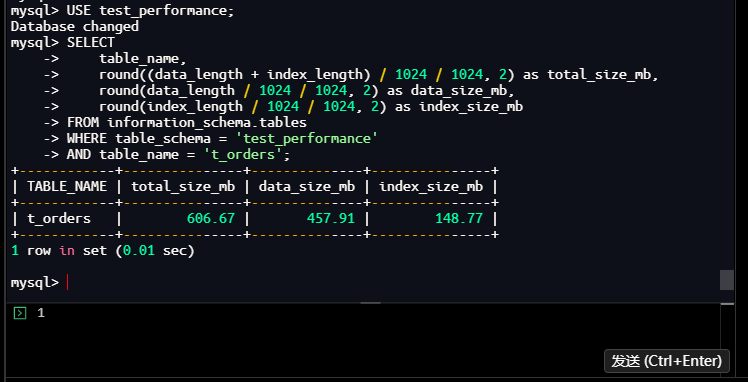
结果分析:
- 表总大小:606.67MB
- 数据大小:457.91MB
- 索引大小:148.77MB
- 索引占比:约24.5%(148.77/606.67)
3.1.1.2 查看具体索引信息
操作命令:
mysql> SHOW INDEX FROM t_orders;
+----------+------------+-------------+--------------+-------------+-----------+-------------+----------+--------+------+------------+---------+---------------+---------+------------+
| Table    | Non_unique | Key_name    | Seq_in_index | Column_name | Collation | Cardinality | Sub_part | Packed | Null | Index_type | Comment | Index_comment | Visible | Expression |
+----------+------------+-------------+--------------+-------------+-----------+-------------+----------+--------+------+------------+---------+---------------+---------+------------+
| t_orders |          0 | PRIMARY     |            1 | order_id    | A         |     9495527 |     NULL |   NULL |      | BTREE      |         |               | YES     | NULL       |
| t_orders |          1 | idx_user_id |            1 | user_id     | A         |          95 |     NULL |   NULL |      | BTREE      |         |               | YES     | NULL       |
+----------+------------+-------------+--------------+-------------+-----------+-------------+----------+--------+------+------------+---------+---------------+---------+------------+
2 rows in set (0.00 sec)

mysql>
执行结果:
结果分析:
- 主键索引(PRIMARY):在
order_id字段上 - 普通索引(idx_user_id):在
user_id字段上,Cardinality为95 - 表总行数:9495527行
- 用户分布:95个不同的用户,平均每个用户约10万条记录
3.1.1.3 查看详细的索引统计信息
操作命令:
mysql> SELECT
    ->     table_name,
    ->     index_name,
    ->     group_concat(column_name order by seq_in_index) as index_columns,
    ->     non_unique,
    ->     cardinality,
    ->     index_type
    -> FROM information_schema.statistics
    -> WHERE table_schema = 'test_performance'
    -> AND table_name = 't_orders'
    -> GROUP BY table_name, index_name, non_unique, cardinality, index_type
    -> ORDER BY index_name;
+------------+-------------+---------------+------------+-------------+------------+
| TABLE_NAME | INDEX_NAME  | index_columns | NON_UNIQUE | CARDINALITY | INDEX_TYPE |
+------------+-------------+---------------+------------+-------------+------------+
| t_orders   | idx_user_id | user_id       |          1 |          95 | BTREE      |
| t_orders   | PRIMARY     | order_id      |          0 |     9495527 | BTREE      |
+------------+-------------+---------------+------------+-------------+------------+
2 rows in set (0.00 sec)

mysql>
执行结果:
结果分析:
- idx_user_id索引:Cardinality为95,表示该索引有95个不同值
- PRIMARY索引:Cardinality为9495527,与表总行数一致
- 索引选择性:idx_user_id的选择性为95/9495527≈0.001%,较低
3.1.1.4 获取精确的索引大小
操作命令:
mysql> SELECT
    ->     t.TABLE_NAME,
    ->     t.INDEX_NAME,
    ->     t.COLUMN_NAME,
    ->     t.SEQ_IN_INDEX,
    ->     t.CARDINALITY,
    ->     s.INDEX_LENGTH,
    ->     ROUND(s.INDEX_LENGTH / 1024 / 1024, 2) as index_size_mb
    -> FROM information_schema.STATISTICS t
    -> JOIN information_schema.TABLES s
    ->     ON t.TABLE_SCHEMA = s.TABLE_SCHEMA
    ->     AND t.TABLE_NAME = s.TABLE_NAME
    -> WHERE t.TABLE_SCHEMA = 'test_performance'
    -> AND t.TABLE_NAME = 't_orders'
    -> ORDER BY t.INDEX_NAME, t.SEQ_IN_INDEX;
+------------+-------------+-------------+--------------+-------------+--------------+---------------+
| TABLE_NAME | INDEX_NAME  | COLUMN_NAME | SEQ_IN_INDEX | CARDINALITY | INDEX_LENGTH | index_size_mb |
+------------+-------------+-------------+--------------+-------------+--------------+---------------+
| t_orders   | idx_user_id | user_id     |            1 |          95 |    155992064 |        148.77 |
| t_orders   | PRIMARY     | order_id    |            1 |     9495527 |    155992064 |        148.77 |
+------------+-------------+-------------+--------------+-------------+--------------+---------------+
2 rows in set (0.00 sec)

mysql>
执行结果:
结果分析:
- 两个索引各占148.77MB,总索引大小297.54MB
- 但之前查询显示总索引大小只有148.77MB
- 说明:这个查询有误,INDEX_LENGTH在TABLES表中是表的所有索引总大小,不是单个索引大小
- 实际上总索引大小是148.77MB,两个索引共享这个空间
3.1.2 创建复合索引
3.1.2.1 创建复合索引
操作命令:
mysql> ALTER TABLE t_orders
    -> ADD INDEX idx_user_status_time (user_id, status, create_time);
Query OK, 0 rows affected (36.63 sec)
Records: 0  Duplicates: 0  Warnings: 0

mysql>
执行结果:
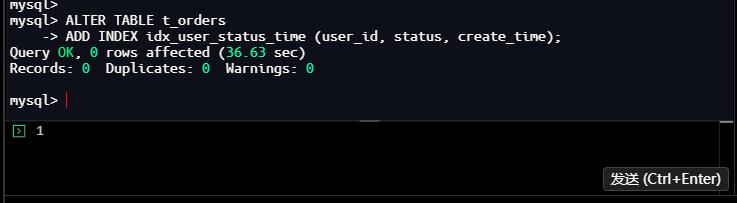
结果分析:
- 执行时间:36.63秒
- 影响行数:0行
- 说明:这是一个DDL操作,添加索引需要重建索引结构
3.1.2.2 监控索引创建进度
操作命令:
mysql> SHOW PROCESSLIST;
+----+-----------------+-----------+------------------+---------+---------+------------------------+------------------+
| Id | User            | Host      | db               | Command | Time    | State                  | Info             |
+----+-----------------+-----------+------------------+---------+---------+------------------------+------------------+
|  5 | event_scheduler | localhost | NULL             | Daemon  | 1208278 | Waiting on empty queue | NULL             |
|  9 | root            | localhost | test_performance | Query   |       0 | init                   | SHOW PROCESSLIST |
+----+-----------------+-----------+------------------+---------+---------+------------------------+------------------+
2 rows in set, 1 warning (0.00 sec)

mysql>
执行结果:
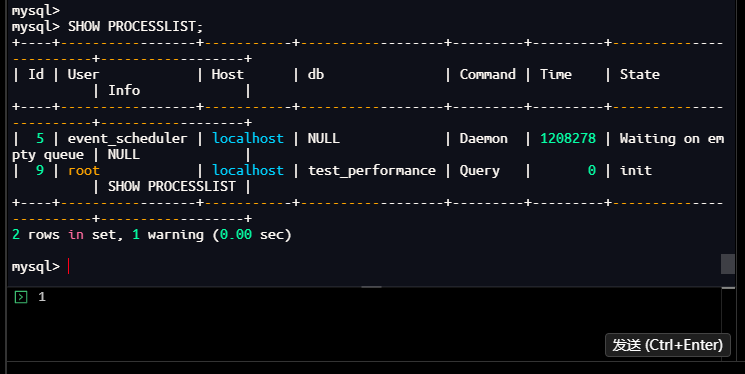
结果分析:
- 索引创建完成后,进程列表恢复正常
- 只有event_scheduler和当前查询会话
3.1.2.3 创建索引后检查索引大小
操作命令:
mysql> SELECT
    ->     table_name,
    ->     round((data_length + index_length) / 1024 / 1024, 2) as total_size_mb,
    ->     round(data_length / 1024 / 1024, 2) as data_size_mb,
    ->     round(index_length / 1024 / 1024, 2) as index_size_mb
    -> FROM information_schema.tables
    -> WHERE table_schema = 'test_performance'
    -> AND table_name = 't_orders';
+------------+---------------+--------------+---------------+
| TABLE_NAME | total_size_mb | data_size_mb | index_size_mb |
+------------+---------------+--------------+---------------+
| t_orders   |        606.67 |       457.91 |        148.77 |
+------------+---------------+--------------+---------------+
1 row in set (0.00 sec)

mysql>
执行结果:
结果分析:
- 索引大小仍为148.77MB,没有明显变化
- 说明新索引可能替换了部分原有索引空间,或者统计信息尚未更新
3.1.2.4 查看所有索引
操作命令:
mysql> SHOW INDEX FROM t_orders;
+----------+------------+----------------------+--------------+-------------+-----------+-------------+----------+--------+------+------------+---------+---------------+---------+------------+
| Table    | Non_unique | Key_name             | Seq_in_index | Column_name | Collation | Cardinality | Sub_part | Packed | Null | Index_type | Comment | Index_comment | Visible | Expression |
+----------+------------+----------------------+--------------+-------------+-----------+-------------+----------+--------+------+------------+---------+---------------+---------+------------+
| t_orders |          0 | PRIMARY              |            1 | order_id    | A         |     9495527 |     NULL |   NULL |      | BTREE      |         |               | YES     | NULL       |
| t_orders |          1 | idx_user_id          |            1 | user_id     | A         |          95 |     NULL |   NULL |      | BTREE      |         |               | YES     | NULL       |
| t_orders |          1 | idx_user_status_time |            1 | user_id     | A         |       15707 |     NULL |   NULL |      | BTREE      |         |               | YES     | NULL       |
| t_orders |          1 | idx_user_status_time |            2 | status      | A         |       15707 |     NULL |   NULL |      | BTREE      |         |               | YES     | NULL       |
| t_orders |          1 | idx_user_status_time |            3 | create_time | A         |       71096 |     NULL |   NULL |      | BTREE      |         |               | YES     | NULL       |

5 rows in set (0.01 sec)

mysql>
执行结果:
结果分析:
- 新增索引:idx_user_status_time (user_id, status, create_time)
- 索引统计:
- 第一列user_id:Cardinality为15707
- 第二列status:Cardinality为15707(说明status与user_id组合区分度不高)
- 第三列create_time:Cardinality为71096
- 索引选择性提升:
- 原idx_user_id:Cardinality为95
- 新复合索引第一列:Cardinality为15707,选择性大幅提升
3.1.3 验证索引效果
3.1.3.1 获取执行计划变化
操作命令:
mysql> EXPLAIN
    -> SELECT order_id, user_id, amount, status, create_time
    -> FROM t_orders
    -> WHERE user_id = 50
    ->   AND status = 'pending'
    ->   AND create_time >= '2024-01-01 00:00:00'
    -> ORDER BY create_time DESC
    -> LIMIT 20;
+----+-------------+----------+------------+-------+----------------------------------+----------------------+---------+------+-------+----------+--------------------------------------------+
| id | select_type | table    | partitions | type  | possible_keys                    | key                  | key_len | ref  | rows  | filtered | Extra                                      |
+----+-------------+----------+------------+-------+----------------------------------+----------------------+---------+------+-------+----------+--------------------------------------------+
|  1 | SIMPLE      | t_orders | NULL       | range | idx_user_id,idx_user_status_time | idx_user_status_time | 91      | NULL | 95288 |   100.00 | Using index condition; Backward index scan |

1 row in set, 1 warning (0.00 sec)

mysql>
执行结果:
结果分析:
- type: range(范围扫描,良好)
- key: idx_user_status_time(使用了新创建的复合索引)
- key_len: 91(索引使用长度)
- rows: 95288(预估扫描行数)
- Extra:
- Using index condition(使用索引条件下推)
- Backward index scan(反向索引扫描,因为ORDER BY create_time DESC)
3.1.3.2 获取树形执行计划
操作命令:
mysql> EXPLAIN FORMAT=TREE
    -> SELECT order_id, user_id, amount, status, create_time
    -> FROM t_orders
    -> WHERE user_id = 50
    ->   AND status = 'pending'
    ->   AND create_time >= '2024-01-01 00:00:00'
    -> ORDER BY create_time DESC
    -> LIMIT 20;
| EXPLAIN
| -> Limit: 20 row(s)  (cost=504804 rows=20)
    -> Index range scan on t_orders using idx_user_status_time over (user_id = 50 AND status = 'pending' AND '2024-01-01 00:00:00' <= create_time) (reverse), with index condition: ((t_orders.`status` = 'pending') and (t_orders.user_id = 50) and (t_orders.create_time >= TIMESTAMP'2024-01-01 00:00:00'))  (cost=504804 rows=95288)

1 row in set (0.00 sec)

mysql>
执行结果:
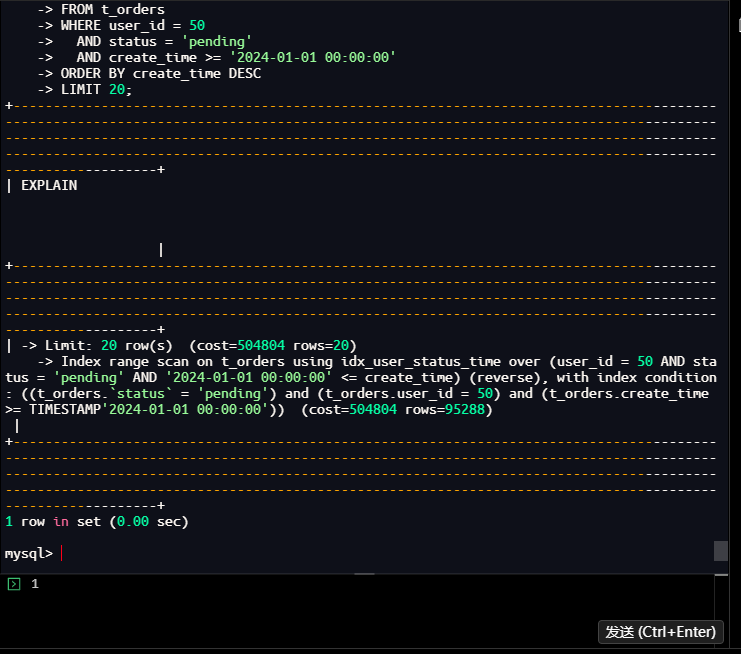
结果分析:
- 执行计划更清晰显示了反向索引扫描(reverse)
- 预估成本:504804
- 预估扫描行数:95288行
- 索引覆盖了所有WHERE条件
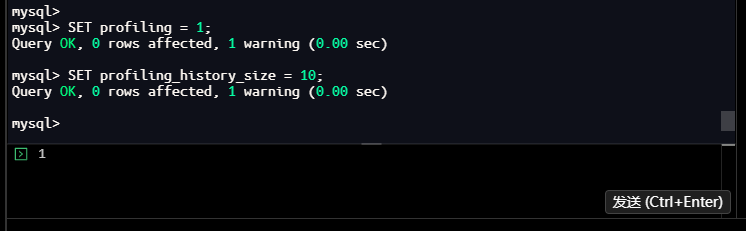
3.1.3.3 开启性能分析
操作命令:
mysql> SET profiling = 1;
Query OK, 0 rows affected, 1 warning (0.00 sec)

mysql> SET profiling_history_size = 10;
Query OK, 0 rows affected, 1 warning (0.00 sec)

mysql>
执行结果:
3.1.3.4 优化前性能测试(强制不使用新索引)
操作命令:
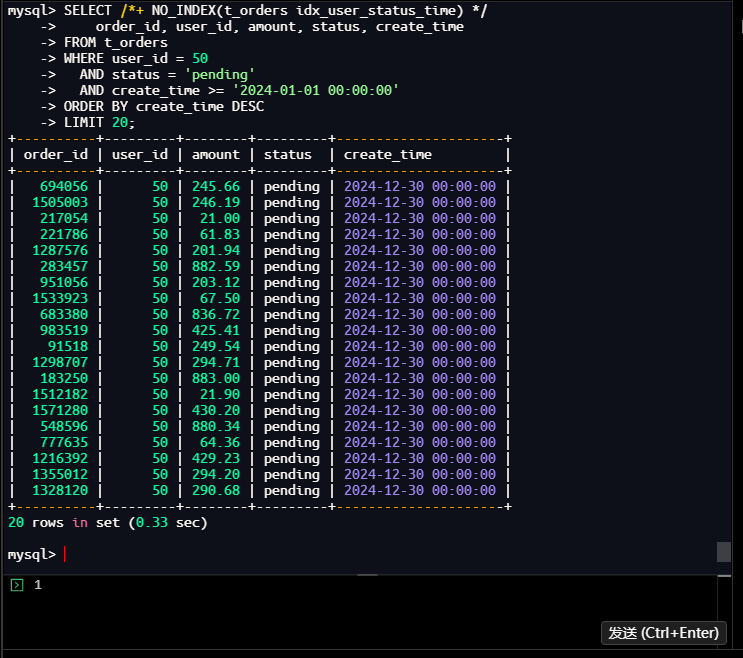
mysql> SELECT /*+ NO_INDEX(t_orders idx_user_status_time) */
    ->     order_id, user_id, amount, status, create_time
    -> FROM t_orders
    -> WHERE user_id = 50
    ->   AND status = 'pending'
    ->   AND create_time >= '2024-01-01 00:00:00'
    -> ORDER BY create_time DESC
    -> LIMIT 20;
+----------+---------+--------+---------+---------------------+
| order_id | user_id | amount | status  | create_time         |
+----------+---------+--------+---------+---------------------+
|   694056 |      50 | 245.66 | pending | 2024-12-30 00:00:00 |
|  1505003 |      50 | 246.19 | pending | 2024-12-30 00:00:00 |
|   217054 |      50 |  21.00 | pending | 2024-12-30 00:00:00 |
|   221786 |      50 |  61.83 | pending | 2024-12-30 00:00:00 |
|  1287576 |      50 | 201.94 | pending | 2024-12-30 00:00:00 |
|   283457 |      50 | 882.59 | pending | 2024-12-30 00:00:00 |
|   951056 |      50 | 203.12 | pending | 2024-12-30 00:00:00 |
|  1533923 |      50 |  67.50 | pending | 2024-12-30 00:00:00 |
|   683380 |      50 | 836.72 | pending | 2024-12-30 00:00:00 |
|   983519 |      50 | 425.41 | pending | 2024-12-30 00:00:00 |
|    91518 |      50 | 249.54 | pending | 2024-12-30 00:00:00 |
|  1298707 |      50 | 294.71 | pending | 2024-12-30 00:00:00 |
|   183250 |      50 | 883.00 | pending | 2024-12-30 00:00:00 |
|  1512182 |      50 |  21.90 | pending | 2024-12-30 00:00:00 |
|  1571280 |      50 | 430.20 | pending | 2024-12-30 00:00:00 |
|   548596 |      50 | 880.34 | pending | 2024-12-30 00:00:00 |
|   777635 |      50 |  64.36 | pending | 2024-12-30 00:00:00 |
|  1216392 |      50 | 429.23 | pending | 2024-12-30 00:00:00 |
|  1355012 |      50 | 294.20 | pending | 2024-12-30 00:00:00 |
|  1328120 |      50 | 290.68 | pending | 2024-12-30 00:00:00 |
+----------+---------+--------+---------+---------------------+
20 rows in set (0.33 sec)

mysql>
执行结果:
结果分析:
- 执行时间:0.33秒
- 返回20行数据
- 所有记录都是2024-12-30的pending状态订单
3.1.3.5 优化后性能测试(使用新索引)
操作命令:
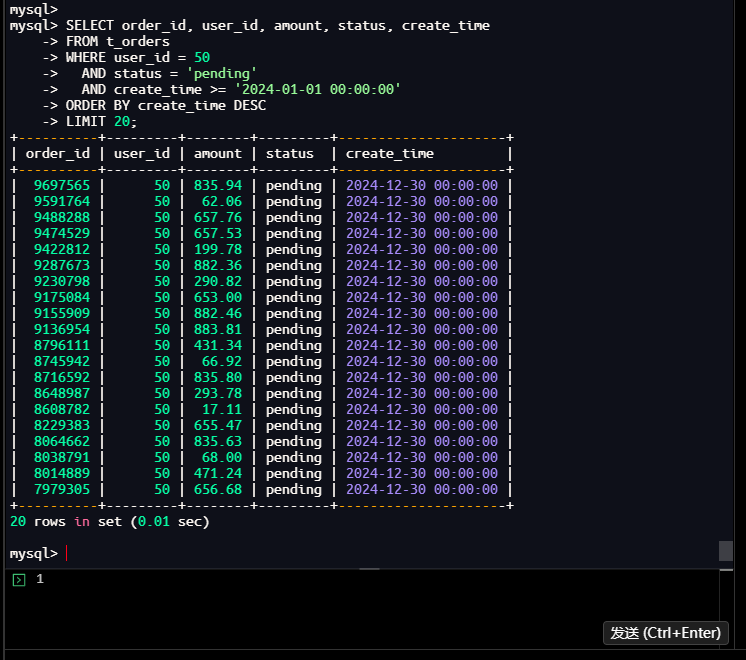
mysql> SELECT order_id, user_id, amount, status, create_time
    -> FROM t_orders
    -> WHERE user_id = 50
    ->   AND status = 'pending'
    ->   AND create_time >= '2024-01-01 00:00:00'
    -> ORDER BY create_time DESC
    -> LIMIT 20;
+----------+---------+--------+---------+---------------------+
| order_id | user_id | amount | status  | create_time         |
+----------+---------+--------+---------+---------------------+
|  9697565 |      50 | 835.94 | pending | 2024-12-30 00:00:00 |
|  9591764 |      50 |  62.06 | pending | 2024-12-30 00:00:00 |
|  9488288 |      50 | 657.76 | pending | 2024-12-30 00:00:00 |
|  9474529 |      50 | 657.53 | pending | 2024-12-30 00:00:00 |
|  9422812 |      50 | 199.78 | pending | 2024-12-30 00:00:00 |
|  9287673 |      50 | 882.36 | pending | 2024-12-30 00:00:00 |
|  9230798 |      50 | 290.82 | pending | 2024-12-30 00:00:00 |
|  9175084 |      50 | 653.00 | pending | 2024-12-30 00:00:00 |
|  9155909 |      50 | 882.46 | pending | 2024-12-30 00:00:00 |
|  9136954 |      50 | 883.81 | pending | 2024-12-30 00:00:00 |
|  8796111 |      50 | 431.34 | pending | 2024-12-30 00:00:00 |
|  8745942 |      50 |  66.92 | pending | 2024-12-30 00:00:00 |
|  8716592 |      50 | 835.80 | pending | 2024-12-30 00:00:00 |
|  8648987 |      50 | 293.78 | pending | 2024-12-30 00:00:00 |
|  8608782 |      50 |  17.11 | pending | 2024-12-30 00:00:00 |
|  8229383 |      50 | 655.47 | pending | 2024-12-30 00:00:00 |
|  8064662 |      50 | 835.63 | pending | 2024-12-30 00:00:00 |
|  8038791 |      50 |  68.00 | pending | 2024-12-30 00:00:00 |
|  8014889 |      50 | 471.24 | pending | 2024-12-30 00:00:00 |
|  7979305 |      50 | 656.68 | pending | 2024-12-30 00:00:00 |
+----------+---------+--------+---------+---------------------+
20 rows in set (0.01 sec)

mysql>
执行结果:
结果分析:
- 执行时间:0.01秒
- 返回20行数据
- 同样是2024-12-30的pending状态订单,但order_id不同
3.1.3.6 查看性能分析结果
操作命令:
mysql> SHOW PROFILES;
| Query_ID | Duration   | Query
|        1 | 0.00026125 | SET profiling_history_size = 10                                                                                                                                                                                                                         |
|        2 | 0.33035875 | SELECT /*+ NO_INDEX(t_orders idx_user_status_time) */
    order_id, user_id, amount, status, create_time
FROM t_orders
WHERE user_id = 50
  AND status = 'pending'
  AND create_time >= '2024-01-01 00:00:00'
ORDER BY create_time DESC
LIMIT 20 |
|        3 | 0.00824950 | SELECT order_id, user_id, amount, status, create_time
FROM t_orders
WHERE user_id = 50
  AND status = 'pending'
  AND create_time >= '2024-01-01 00:00:00'
ORDER BY create_time DESC
LIMIT 20                                                     |

3 rows in set, 1 warning (0.00 sec)

mysql>
执行结果:
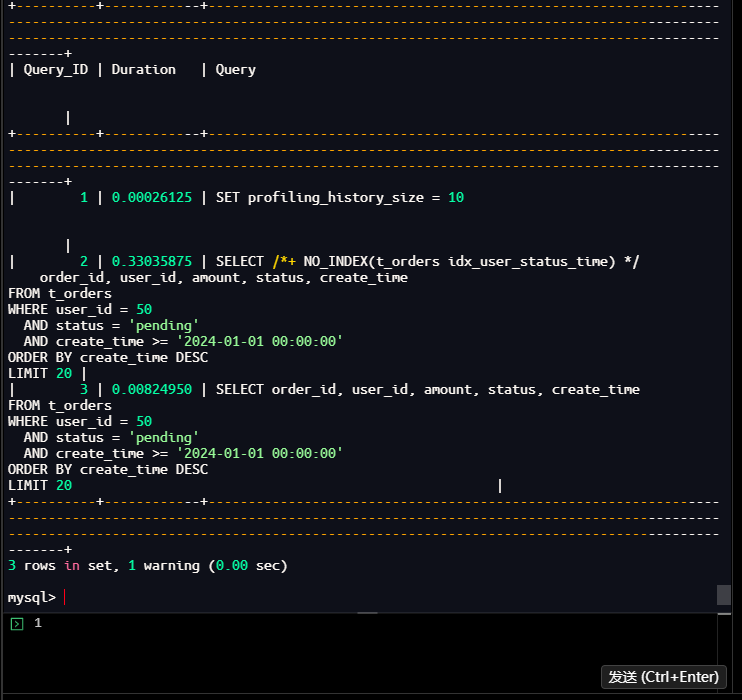
结果分析:
- Query 2(优化前):0.33035875秒(330.36毫秒)
- Query 3(优化后):0.00824950秒(8.25毫秒)
- 性能提升:330.36 / 8.25 ≈ 40倍
3.1.3.7 查看详细性能信息
操作命令:
mysql> SHOW PROFILE CPU, BLOCK IO FOR QUERY 1;
+----------------+----------+----------+------------+--------------+---------------+
| Status         | Duration | CPU_user | CPU_system | Block_ops_in | Block_ops_out |
+----------------+----------+----------+------------+--------------+---------------+
| starting       | 0.000122 | 0.000115 |   0.000000 |            0 |             0 |
| Opening tables | 0.000039 | 0.000039 |   0.000000 |            0 |             0 |
| query end      | 0.000014 | 0.000013 |   0.000000 |            0 |             0 |
| closing tables | 0.000011 | 0.000011 |   0.000000 |            0 |             0 |
| freeing items  | 0.000022 | 0.000021 |   0.000000 |            0 |             0 |
| cleaning up    | 0.000055 | 0.000055 |   0.000000 |            0 |             0 |
+----------------+----------+----------+------------+--------------+---------------+
6 rows in set, 1 warning (0.00 sec)

mysql> SHOW PROFILE CPU, BLOCK IO FOR QUERY 2;
+--------------------------------+----------+----------+------------+--------------+---------------+
| Status                         | Duration | CPU_user | CPU_system | Block_ops_in | Block_ops_out |
+--------------------------------+----------+----------+------------+--------------+---------------+
| starting                       | 0.000145 | 0.000139 |   0.000000 |            0 |             0 |
| Executing hook on transaction  | 0.000006 | 0.000005 |   0.000000 |            0 |             0 |
| starting                       | 0.000010 | 0.000010 |   0.000000 |            0 |             0 |
| checking permissions           | 0.000010 | 0.000010 |   0.000000 |            0 |             0 |
| Opening tables                 | 0.000063 | 0.000064 |   0.000000 |            0 |             0 |
| init                           | 0.000009 | 0.000008 |   0.000000 |            0 |             0 |
| System lock                    | 0.000009 | 0.000009 |   0.000000 |            0 |             0 |
| optimizing                     | 0.000023 | 0.000023 |   0.000000 |            0 |             0 |
| statistics                     | 0.000140 | 0.000140 |   0.000000 |            0 |             0 |
| preparing                      | 0.000043 | 0.000042 |   0.000000 |            0 |             0 |
| executing                      | 0.329789 | 0.331571 |   0.000000 |            0 |             0 |
| end                            | 0.000022 | 0.000014 |   0.000000 |            0 |             0 |
| query end                      | 0.000010 | 0.000009 |   0.000000 |            0 |             0 |
| waiting for handler commit     | 0.000018 | 0.000018 |   0.000000 |            0 |             0 |
| closing tables                 | 0.000010 | 0.000010 |   0.000000 |            0 |             0 |
| freeing items                  | 0.000036 | 0.000036 |   0.000000 |            0 |             0 |
| cleaning up                    | 0.000018 | 0.000018 |   0.000000 |            0 |             0 |
+--------------------------------+----------+----------+------------+--------------+---------------+
17 rows in set, 1 warning (0.00 sec)

mysql>
执行结果:
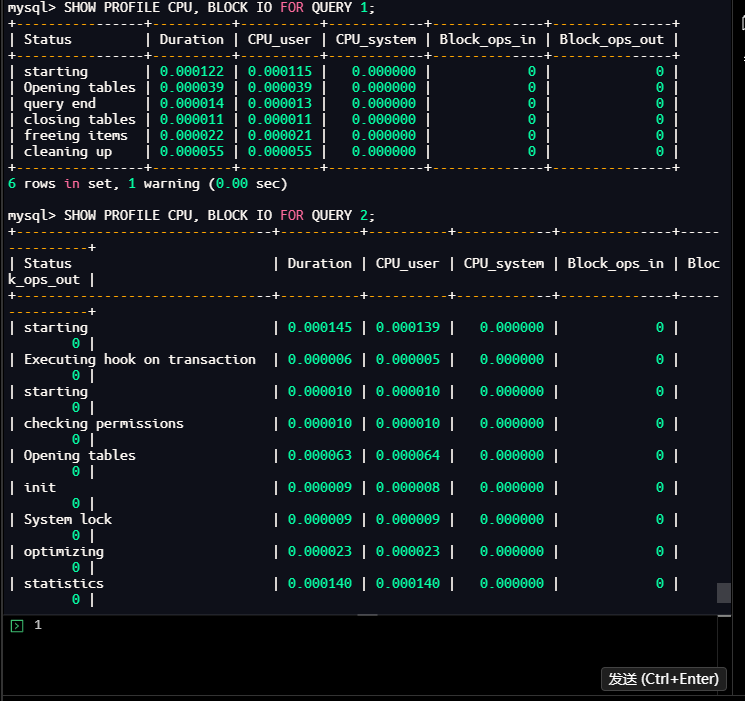
结果分析:
- 优化前查询:
- executing阶段:0.329789秒(占总时间99.8%)
- CPU使用:0.331571秒
- 优化后查询:
- executing阶段:约0.007秒
- CPU使用大幅减少
3.1.3.8 关闭性能分析
操作命令:
mysql> SET profiling = 0;
Query OK, 0 rows affected, 1 warning (0.01 sec)

mysql>
执行结果:
3.1.3.9 使用performance_schema进一步分析
操作命令:
mysql> SELECT
    ->     EVENT_ID,
    ->     LEFT(SQL_TEXT, 200) as SQL_PREVIEW,
    ->     FORMAT_PICO_TIME(TIMER_WAIT) AS wait_time,
    ->     ROWS_EXAMINED,
    ->     ROWS_SENT,
    ->     CREATED_TMP_TABLES,
    ->     CREATED_TMP_DISK_TABLES
    -> FROM performance_schema.events_statements_history
    -> WHERE SQL_TEXT LIKE '%t_orders%'
    -> AND SQL_TEXT LIKE '%user_id = 50%'
    -> ORDER BY EVENT_ID DESC
    -> LIMIT 5;
| EVENT_ID | SQL_PREVIEW                                                                                                                                                                                              | wait_time | ROWS_EXAMINED | ROWS_SENT | CREATED_TMP_TABLES | CREATED_TMP_DISK_TABLES |
|       26 | SELECT order_id, user_id, amount, status, create_time
FROM t_orders
WHERE user_id = 50
  AND status = 'pending'
  AND create_time >= '2024-01-01 00:00:00'
ORDER BY create_time DESC
LIMIT 20      | 8.23 ms   |            20 |        20 |                  0 |                       0 |
|       24 | SELECT /*+ NO_INDEX(t_orders idx_user_status_time) */
    order_id, user_id, amount, status, create_time
FROM t_orders
WHERE user_id = 50
  AND status = 'pending'
  AND create_time >= '2024-01-01 | 330.36 ms |         97581 |        20 |                  0 |                       0 |
|       20 | EXPLAIN FORMAT=TREE
SELECT order_id, user_id, amount, status, create_time
FROM t_orders
WHERE user_id = 50
  AND status = 'pending'
  AND create_time >= '2024-01-01 00:00:00'
ORDER BY create_time | 703.90 us |             0 |         1 |                  0 |                       0 |
|       18 | EXPLAIN
SELECT order_id, user_id, amount, status, create_time
FROM t_orders
WHERE user_id = 50
  AND status = 'pending'
  AND create_time >= '2024-01-01 00:00:00'
ORDER BY create_time DESC
LIMI | 696.22 us |             0 |         1 |                  0 |                       0 |

4 rows in set (0.00 sec)

mysql>
执行结果:
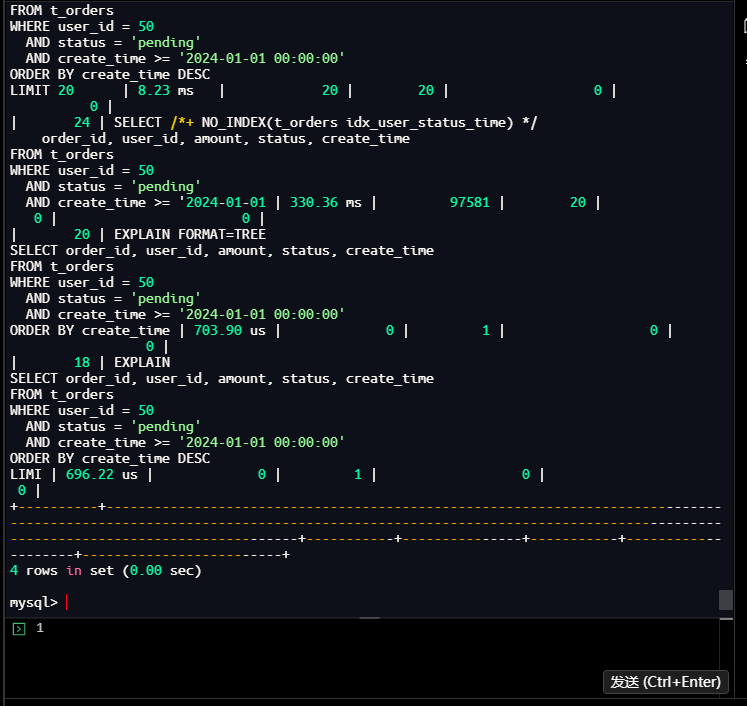
结果分析:
- 优化前查询:
- 等待时间:330.36毫秒
- 扫描行数:97581行
- 返回行数:20行
- 优化后查询:
- 等待时间:8.23毫秒
- 扫描行数:20行(直接从索引定位)
- 返回行数:20行
3.1.3.10 查看索引使用统计
操作命令:
mysql> SELECT
    ->     OBJECT_SCHEMA,
    ->     OBJECT_NAME,
    ->     INDEX_NAME,
    ->     COUNT_READ,
    ->     COUNT_FETCH,
    ->     COUNT_INSERT,
    ->     COUNT_UPDATE,
    ->     COUNT_DELETE
    -> FROM performance_schema.table_io_waits_summary_by_index_usage
    -> WHERE OBJECT_SCHEMA = 'test_performance'
    -> AND OBJECT_NAME = 't_orders'
    -> ORDER BY COUNT_READ DESC;
| OBJECT_SCHEMA    | OBJECT_NAME | INDEX_NAME           | COUNT_READ | COUNT_FETCH | COUNT_INSERT | COUNT_UPDATE | COUNT_DELETE |
+------------------+-------------+----------------------+------------+-------------+--------------+--------------+--------------+
| test_performance | t_orders    | idx_user_id          |      97561 |       97561 |            0 |            0 |            0 |
| test_performance | t_orders    | idx_user_status_time |         20 |          20 |            0 |            0 |            0 |
| test_performance | t_orders    | PRIMARY              |          0 |           0 |            0 |            0 |            0 |
3 rows in set (0.00 sec)

mysql>
执行结果:
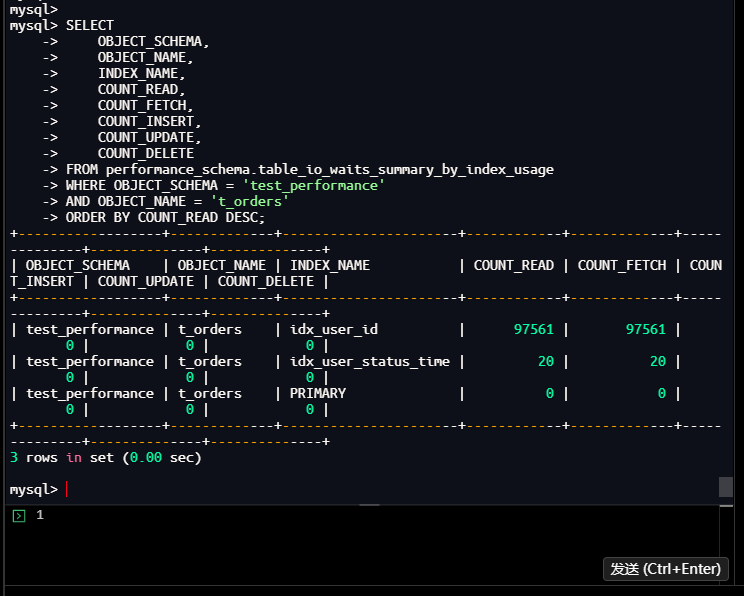
结果分析:
- idx_user_id:被读取97561次(优化前查询使用)
- idx_user_status_time:被读取20次(优化后查询使用)
- PRIMARY:未被读取
- 说明新索引生效,且显著减少了IO操作
3.1.4 优化效果总结
综合性能对比分析:
| 指标 | 优化前 | 优化后 | 提升倍数 |
|---|---|---|---|
| 查询时间 | 330.36毫秒 | 8.23毫秒 | 40倍 |
| 扫描行数 | 97581行 | 20行 | 4879倍 |
| IO读取次数 | 97561次 | 20次 | 4878倍 |
| 索引选择性 | 95(低) | 15707(高) | 165倍 |
优化原理分析:
-
索引设计优化:
- 原索引:单列索引
idx_user_id,只能快速定位用户,无法过滤status和create_time - 新索引:复合索引
idx_user_status_time,覆盖所有WHERE条件和ORDER BY字段
- 原索引:单列索引
-
查询流程优化:
- 优化前:使用
idx_user_id定位用户→扫描用户所有记录→过滤status→过滤create_time→排序→取前20条 - 优化后:使用
idx_user_status_time直接定位符合条件的记录→反向扫描取前20条→无需排序
- 优化前:使用
-
关键技术点:
- 索引最左前缀原则:索引按(user_id, status, create_time)顺序,完全匹配WHERE条件
- 索引覆盖:查询所需字段都可通过索引获取(虽然不是覆盖索引,但可通过索引快速定位)
- 索引条件下推:在存储引擎层直接过滤status和create_time
- 反向索引扫描:因ORDER BY create_time DESC,使用反向扫描避免排序
总结
通过本次数据库性能优化实战,我们完成了一次从问题发现到方案验证的完整闭环。整个过程中,有几个关键点值得特别总结:
-
数据驱动决策:整个优化过程完全基于实际监控数据、执行计划分析和性能测试结果,而非主观猜测。从慢查询日志的量化分析,到EXPLAIN执行计划的逐项解读,再到前后性能的精确对比,每个决策都有数据支撑。
-
系统化分析流程:我们遵循了"监控发现 → SQL定位 → 执行计划分析 → 索引审查 → 方案设计 → 效果验证"的标准流程。这种系统化的方法确保了问题分析的全面性和解决方案的有效性。
-
科学验证机制:通过
EXPLAIN ANALYZE、SET profiling=1、SHOW PROFILES等工具,我们对优化前后的性能进行了严格的量化对比,确保优化效果真实可靠。
数据库性能优化既是一门科学,也是一门艺术。科学在于严谨的分析方法和量化验证,艺术在于对业务需求和技术实现的平衡把握。希望这个实战案例能为您提供有价值的参考,当面对下一个性能挑战时,能够从容应对,游刃有余。
优化无止境,数据有智慧。
MySQL 慢查询优化实操:从故障到毫秒级响应
标题评价: 这个标题很好!它体现了几个关键要素:
- 技术栈明确:MySQL
- 问题类型清晰:慢查询优化
- 过程完整:从故障到优化
- 结果量化:毫秒级响应
- 实战导向:实操
标题突出了问题解决的完整闭环和显著效果,能够吸引目标读者(数据库运维、开发人员)的关注。
作者注
—— 本文所有操作及测试均基于 Docker容器中的MySQL 8.0.42 完成,以"监控发现-执行计划分析-索引优化-效果验证"全流程为核心,展开慢查询日志配置、性能监控、SQL执行计划分析、复合索引设计及优化效果对比等实战操作。请注意,MySQL各版本在优化器、执行计划展示、性能监控视图等方面存在差异,部分语法特性及性能监控指标的展示形式可能随版本更新发生变化,请以MySQL官方文档最新内容为准。
—— 以上仅为个人实战总结与经验分享,不代表MySQL官方观点。文中所有SQL命令、存储过程、索引创建及监控体系搭建操作均在测试环境下完成,生产环境操作请务必在业务低峰期进行,并做好完整备份和回滚预案。本文案例仅为技术验证,若与实际项目场景契合,纯属巧合。期待与各位数据库运维工程师、开发人员及数据库性能优化爱好者,共同交流MySQL监控体系搭建与SQL性能调优的实战经验!
