


前日有套11.2.0.3 RAC on HPUX数据库环境突然出现较高的latch: free wait event, 该event在10G以后的版本较为少见(已经细化为具体latch) , 通过p1 or p2值可以确认具体latch. 下面记录一下这个问题。
Note:
具体的latch是“transaction branch allocation” 常见于多个新会话logon开始新trasactions时。
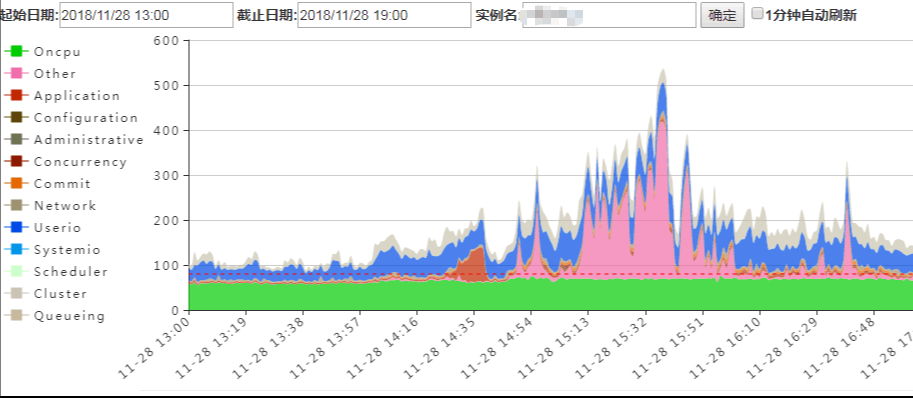
收集该时段AWR
Note:
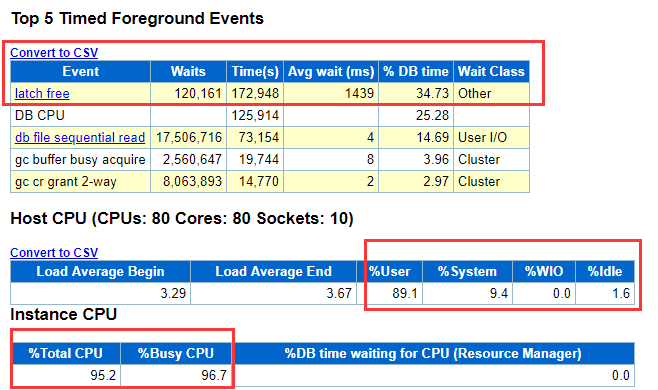
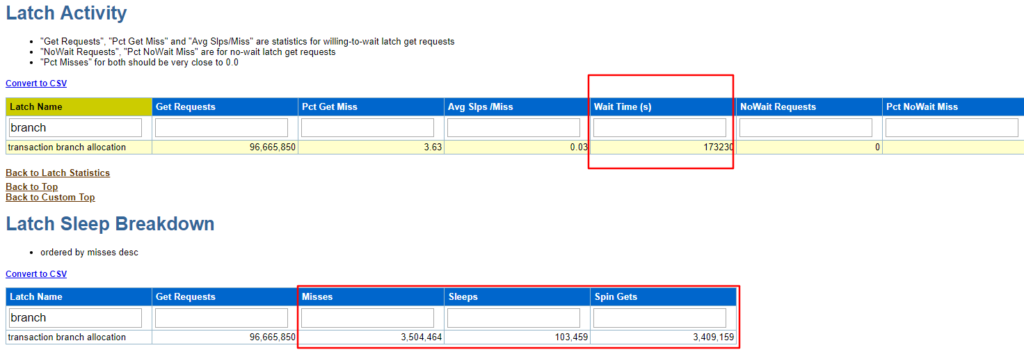
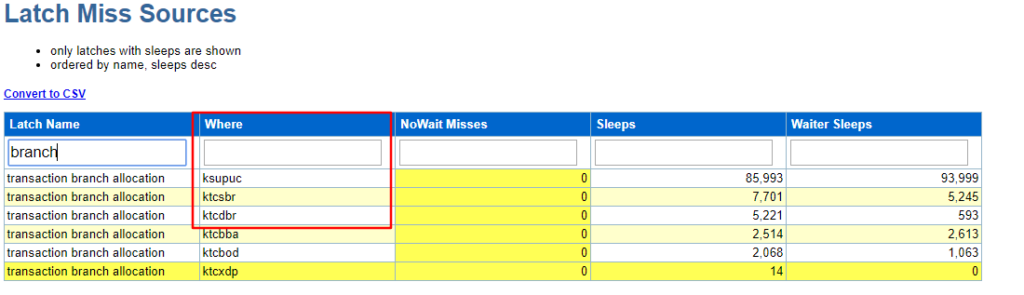
注意latch free, transaction branch allocation占用较高的db time, latch 位置主要是ksupuc(kernel service user processes push user call), 和ktcsbr(kernel transaction control component state branch), 同时每秒logon在10, 每秒事务在860左右, 是一个较忙的数据库, 同时CPU 使用率高大98%。 是否在是CPU 较高时触发了某个BUG? 在MOS中查找发现命中一Bug 20130575 .
该BUG在影响11.2.0.3 、11.2.0.4 、12cR1 ,在12c R2版本中修复,在一些版本中提供one off patch, 但是在当前平台版本没有相应的patch. 因版本已过服务期,无法提供新的patch. 该问题会在经过一段时间后自愈,还会间隔出现, 属于一种程序代码缺陷,没有其它有效的手段, 我分析该bug 应该于cpu high usage 有间接关系,于时建议部分应用调整到了另一节点, 规避该问题,调整后CPU降到70%左右后,该问题没有再出现。
SQL> @snapper ash 5 1 all
Sampling SID all with interval 5 seconds, taking 1 snapshots...
-- Session Snapper v4.22 - by Tanel Poder ( http://blog.tanelpoder.com/snapper ) - Enjoy the Most Advanced Oracle Troubleshooting Script on the Planet! :)

---------------------------------------------------------------------------------------------------------------
  ActSes   %Thread | INST | SQL_ID          | SQL_CHILD | EVENT                               | WAIT_CLASS
---------------------------------------------------------------------------------------------------------------
  191.25  (19125%) |    1 |                 |           | latch free                          | Other
    9.50    (950%) |    1 | bnqupvb8r8cgz   | 0         | ON CPU                              | ON CPU
    8.50    (850%) |    1 | 26838x2c8b9f0   | 0         | ON CPU                              | ON CPU
    6.25    (625%) |    1 |                 |           | log file sync                       | Commit
    4.00    (400%) |    1 | b0q3p47z445s7   | 1         | ON CPU                              | ON CPU
    3.75    (375%) |    1 |                 |           | ON CPU                              | ON CPU
    3.00    (300%) |    1 | 22bp4wvbzarpz   | 0         | ON CPU                              | ON CPU
    3.00    (300%) |    1 | 8uj2h75038h0n   | 1         | read by other session               | User I/O
    2.75    (275%) |    1 | bqkx2vdyd65pq   | 0         | read by other session               | User I/O
    2.75    (275%) |    1 | f22guq9nw55x4   | 2         | db file scattered read              | User I/O
--  End of ASH snap 1, end=2018-11-28 14:55:28, seconds=5, samples_taken=4, AAS=369.8
SQL> @sw "select sid from v$session where event='latch free'"
    SID STATE   EVENT                                          SEQ# SEC_IN_WAIT P1                  P2                  P3                  P1TRANSL
------- ------- ---------------------------------------- ---------- ----------- ------------------- ------------------- ------------------- ------------------------------------------
      3 WAITING latch free                                    50634           0 address=            number= 244         tries= 0            0xC0000000AFE0BE98: transaction branch all
                                                                                0xC0000000AFE0BE98                                          ocation[par
      7 WAITING latch free                                    26288           0 address=            number= 244         tries= 0            0xC0000000AFE0BE98: transaction branch all
                                                                                0xC0000000AFE0BE98                                          ocation[par
     93 WAITING latch free                                    28532           0 address=            number= 244         tries= 0            0xC0000000AFE0BE98: transaction branch all
                                                                                0xC0000000AFE0BE98                                          ocation[par
...
SQL> select * from v$latchname where latch#=244;
    LATCH# NAME                                                                   HASH
---------- ---------------------------------------------------------------- ----------
       244 transaction branch allocation                                     397209581
-- or query v$latch_parent  using P1 value
Note:
具体的latch是“transaction branch allocation” 常见于多个新会话logon开始新trasactions时。
收集该时段AWR
Note:
注意latch free, transaction branch allocation占用较高的db time, latch 位置主要是ksupuc(kernel service user processes push user call), 和ktcsbr(kernel transaction control component state branch), 同时每秒logon在10, 每秒事务在860左右, 是一个较忙的数据库, 同时CPU 使用率高大98%。 是否在是CPU 较高时触发了某个BUG? 在MOS中查找发现命中一Bug 20130575 .
该BUG在影响11.2.0.3 、11.2.0.4 、12cR1 ,在12c R2版本中修复,在一些版本中提供one off patch, 但是在当前平台版本没有相应的patch. 因版本已过服务期,无法提供新的patch. 该问题会在经过一段时间后自愈,还会间隔出现, 属于一种程序代码缺陷,没有其它有效的手段, 我分析该bug 应该于cpu high usage 有间接关系,于时建议部分应用调整到了另一节点, 规避该问题,调整后CPU降到70%左右后,该问题没有再出现。
「喜欢这篇文章,您的关注和赞赏是给作者最好的鼓励」
关注作者
【版权声明】本文为墨天轮用户原创内容,转载时必须标注文章的来源(墨天轮),文章链接,文章作者等基本信息,否则作者和墨天轮有权追究责任。如果您发现墨天轮中有涉嫌抄袭或者侵权的内容,欢迎发送邮件至:contact@modb.pro进行举报,并提供相关证据,一经查实,墨天轮将立刻删除相关内容。
