


概述
node_exporter除了可以收集系统指标外,还可以采集我们自定义的监控指标。采集自定义监控指标是通过textfile模块来完成的,textfile模块默认会随着node_exporter启动而启动,如果想要采集自定义指标,还需要在启动node_exporter的时候,添加–collector.textfile.directory=""参数,这个参数是自定义的采集路径,所有自定义监控指标文件都放在这个目录下,且文件名都以.prom结尾。
自定义指标
启动node_exporter
--创建目录
# mkdir -p /opt/node_exporter/prom

--以指定采集路径的方式启动
# nohup /opt/node_exporter/node_exporter --collector.textfile.directory="/opt/node_exporter/prom" > /opt/node_exporter/node_exporter.log 2>&1 &
创建监控指标文件
# cd /opt/node_exporter/prom
# vi db_heartbeat.prom
--HELP 和 TYPE 如果没有制定,node_exporter会自动添加
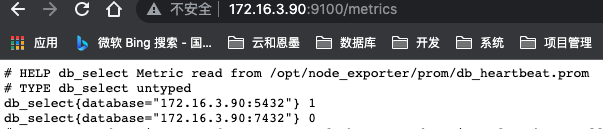
# HELP db_select Metric read from /opt/node_exporter/prom/db_heartbeat.prom
# TYPE db_select untyped
db_select{database="172.16.3.90:5432"} 1
db_select{database="172.16.3.90:7432"} 0
在浏览器中可以看到,我们自定义的指标已经采集到
定时任务
自定义监控指标大多数需要与crontab结合,按着需求设置采集指标的时间。
flock命令
为了防止某个任务的执行时间超过了 crontab 中为此任务设定的执行周期,使用flock命令将crontab串行化:
flock -xn /tmp/flock.lock -c ‘xxx.sh’ --如果/tmp/flock.lock不存在,flock会自动创建
Usage:
 flock [options] <file|directory> <command> [command args]
 flock [options] <file|directory> -c <command>
 flock [options] <file descriptor number>

Options:
 -s  --shared             get a shared lock
 -x  --exclusive          get an exclusive lock (default)
 -u  --unlock             remove a lock
 -n  --nonblock           fail rather than wait
 -w  --timeout <secs>     wait for a limited amount of time
 -E  --conflict-exit-code <number>  exit code after conflict or timeout
 -o  --close              close file descriptor before running command
 -c  --command <command>  run a single command string through the shell

 -h, --help     display this help and exit
 -V, --version  output version information and exit

For more details see flock(1).
MogDB 探活脚本
通过sql(select 1;)进行探活
vi /opt/scripts/db_heartbeat.sh

#!/bin/bash

source /home/omm/.bashrc

nums=(
172.16.3.90:5432:opengauss_exporter:opengauss_exporter123
172.16.3.90:7432:opengauss_exporter:opengauss_exporter123
)

for i in $(seq 0 $[${#nums[*]}-1])
do
  ip=`echo ${nums[$i]}|awk -F ':' '{print $1}'`
  port=`echo ${nums[$i]}|awk -F ':' '{print $2}'`
  username=`echo ${nums[$i]}|awk -F ':' '{print $3}'`
  password=`echo ${nums[$i]}|awk -F ':' '{print $4}'`

  result=`gsql "host=$ip port=$port user=$username password=$password dbname=postgres" -t -c "select 1"`
  if [ $? -eq 0 ]; then
     echo "db_select{database=\"$ip:$port\"} 1" >> /opt/node_exporter/prom/db_heartbeat.prom
  else
     echo "db_select{database=\"$ip:$port\"} 0" >> /opt/node_exporter/prom/db_heartbeat.prom
  fi
done
MogHA状态检测脚本
vi /opt/scripts/mogha_status.sh

--需要部署在每一台mogha所在的服务器上

#!/bin/bash

ip=`ip addr |grep -i global|head -1|awk '{print$2}'|cut -d / -f 1`
mogha_status=`systemctl status mogha |grep -i 'Active:' |awk -F ' ' '{print $2}'`

if [ "$mogha_status" == 'active' ]; then
    echo "mogha_status {database=\"$ip\"} 1" >> /opt/node_exporter/prom/mogha_status.prom
else
    echo "mogha_status {database=\"$ip\"} 0" >> /opt/node_exporter/prom/mogha_status.prom
fi

--部署在prometheus服务器上即可,通过探测端口判断mogha状态
#!/bin/bash

nums=(
172.16.3.90:8081
172.16.3.91:8081
)

for i in $(seq 0 $[${#nums[*]}-1])
do
  ip=`echo ${nums[$i]}|awk -F ':' '{print $1}'`
  port=`echo ${nums[$i]}|awk -F ':' '{print $2}'`

  result=`(sleep 1;) | telnet $ip $port|grep "]"|wc -l`
  if [ $result -eq 0 ]; then
     echo "mogha_status {database=\"$ip\"} 0" >> /opt/node_exporter/prom/mogha_status.prom
  else
     echo "mogha_status {database=\"$ip\"} 1" >> /opt/node_exporter/prom/mogha_status.prom
  fi
done
crontab
--执行脚本之前,先清理.prom文件,防止监控指标重复
* * * * * /usr/bin/flock -xn /tmp/flock.lock -c ">/opt/node_exporter/prom/db_heartbeat.prom && /usr/bin/bash /opt/scripts/db_heartbeat.sh >> /opt/scripts/db_heartbeat.log"
* * * * * /usr/bin/flock -xn /tmp/flock1.lock -c ">/opt/node_exporter/prom/mogha_status.prom && /usr/bin/bash /opt/scripts/mogha_status.sh >> /opt/scripts/mogha_status.log"
最后修改时间:2022-02-11 21:27:37
「喜欢这篇文章,您的关注和赞赏是给作者最好的鼓励」
关注作者
【版权声明】本文为墨天轮用户原创内容,转载时必须标注文章的来源(墨天轮),文章链接,文章作者等基本信息,否则作者和墨天轮有权追究责任。如果您发现墨天轮中有涉嫌抄袭或者侵权的内容,欢迎发送邮件至:contact@modb.pro进行举报,并提供相关证据,一经查实,墨天轮将立刻删除相关内容。
