
对 Kubernetes 中的各项资源进行监控有助于我们时刻了解集群的运行状况,从而对集群进行相应的操作,比如扩容、缩容等。在 Kubernetes 中主要通过Heapster 结合一些其它组件进行资源监控。
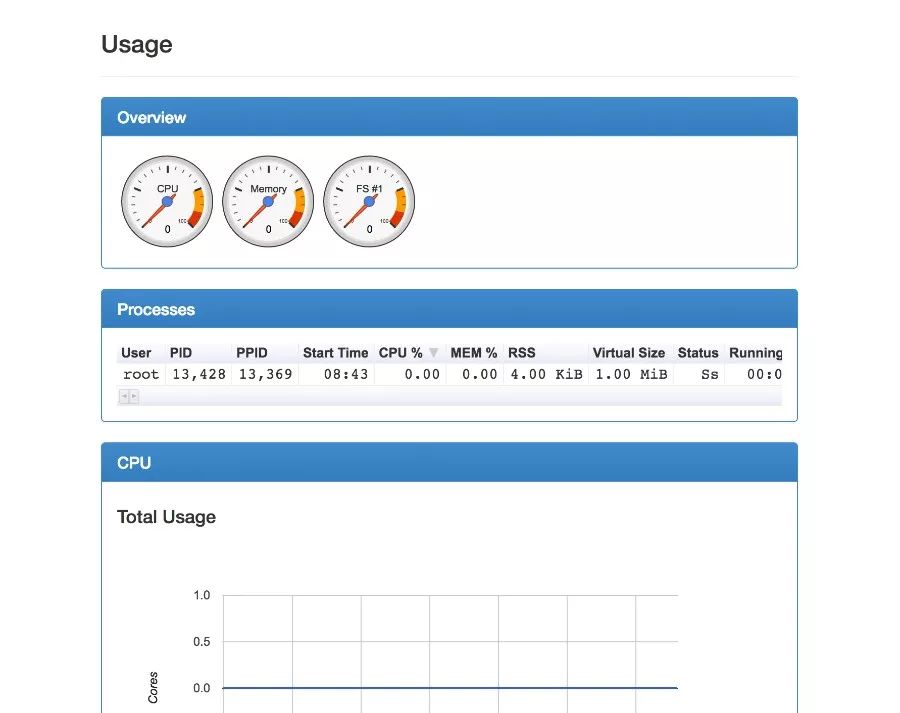
Heapster 也是 Kubernetes 的一部分,主要目标就是对 Kubernetes 集群进行基础监控,再结合 cAdvisor 等工具就可以对集群进行很好的监控。而cAdvisor 工具已经集成到了 kubelet 文件中,当我们部署好一个 Kubernetes 集群以后,默认监听在 4194 端口,且有简单的 UI:

某个容器的资源使用:
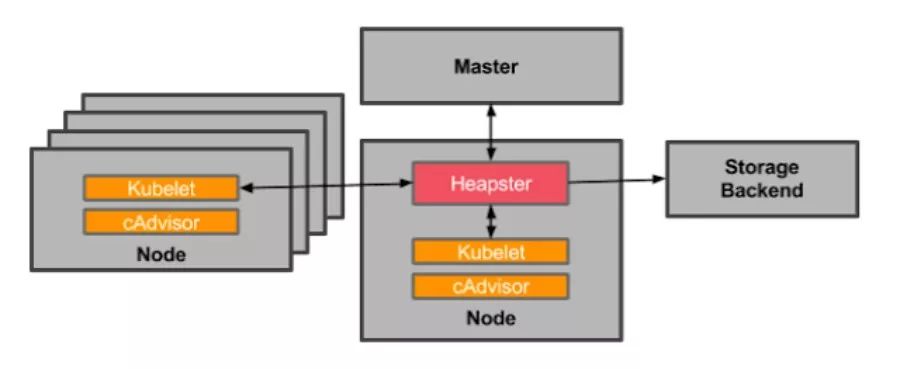
Heapster 和普通的应用一样,都是以 Pod 的方式运行在集群中,并通过kubelet进程获取 Node 的使用信息,而 kubelet 则是通过自己内置的cAdvisor 来获取数据。然后 Heapster 根据 Pod 及相关的 Labels 将这些信息进行分组聚合,最后保存到后端。这个后端也是可配置的,在开源界最受欢迎的是 InfluxDB(使用 Grafana 作为前端展示),其他支持的后端可参考here。整个监控的架构如下:
我们以最受欢迎的 Heapster+InfluxDB+Grafana 作为实践,大部分涉及的东西可以在 Heapster 工程下面找到,包括部署需要的 yaml 文件,如果你可以访问 Google 的 registry,那么整个实践还是比较容易的,否则可能会比较麻烦。
heapster-deployment.yaml:
apiVersion: extensions/v1beta1kind: Deploymentmetadata:name: heapsternamespace: kube-systemspec:replicas: 1template:metadata:labels:task: monitoringk8s-app: heapsterspec:containers:- name: heapsterimage: gcr.io/google_containers/heapster-amd64:v1.3.0-beta.1imagePullPolicy: IfNotPresentcommand:- /heapster- --source=kubernetes:https://kubernetes.default- --sink=influxdb:http://monitoring-influxdb:8086
这里需要注意一个问题,如果你部署的 Kubernetes 集群没有创建证书,只有 http 的话,那 heapster 会因为证书找不到而启动失败,此时,可以将上面的 --source 改掉:
- --source=kubernetes:http://192.168.56.101:8080/?inClusterConfig=false
即替换为你的 http 地址(注意将上面的 IP 和端口替换为你的集群的端口和地址,即执行 kubectl cluster-info 的输出地址),当然你也可以自己生成证书,可参考:https://github.com/kubernetes/heapster/blob/master/docs/source-configuration.md#current-sources
heapster-service.yaml文件:
apiVersion: v1kind: Servicemetadata:labels:task: monitoring# For use as a Cluster add-on (https://github.com/kubernetes/kubernetes/tree/master/cluster/addons)# If you are NOT using this as an addon, you should comment out this line.kubernetes.io/cluster-service: 'true'kubernetes.io/name: Heapstername: heapsternamespace: kube-systemspec:ports:- port: 80targetPort: 8082selector:k8s-app: heapster
influxdb-deployment.yaml:
apiVersion: extensions/v1beta1kind: Deploymentmetadata:name: monitoring-influxdbnamespace: kube-systemspec:replicas: 1template:metadata:labels:task: monitoringk8s-app: influxdbspec:containers:- name: influxdbimage: gcr.io/google_containers/heapster-influxdb-amd64:v1.1.1volumeMounts:- mountPath: /dataname: influxdb-storagevolumes:- name: influxdb-storageemptyDir: {}
influxdb-service.yaml:
apiVersion: v1kind: Servicemetadata:labels:task: monitoring# For use as a Cluster add-on (https://github.com/kubernetes/kubernetes/tree/master/cluster/addons)# If you are NOT using this as an addon, you should comment out this line.kubernetes.io/cluster-service: 'true'kubernetes.io/name: monitoring-influxdbname: monitoring-influxdbnamespace: kube-systemspec:ports:- port: 8086targetPort: 8086selector:k8s-app: influxdb
InfluxDB 默认的端口是 8086,用户名和密码都是"root"。当你登录到Grafana 后,可以通过 http://localhost:8086 来访问 InfluxDB。
grafana-deployment.yaml:
apiVersion: extensions/v1beta1kind: Deploymentmetadata:name: monitoring-grafananamespace: kube-systemspec:replicas: 1template:metadata:labels:task: monitoringk8s-app: grafanaspec:containers:- name: grafanaimage: gcr.io/google_containers/heapster-grafana-amd64:v4.0.2ports:- containerPort: 3000protocol: TCPvolumeMounts:- mountPath: /varname: grafana-storageenv:- name: INFLUXDB_HOSTvalue: monitoring-influxdb- name: GRAFANA_PORTvalue: "3000"# The following env variables are required to make Grafana accessible via# the kubernetes api-server proxy. On production clusters, we recommend# removing these env variables, setup auth for grafana, and expose the grafana# service using a LoadBalancer or a public IP.- name: GF_AUTH_BASIC_ENABLEDvalue: "false"- name: GF_AUTH_ANONYMOUS_ENABLEDvalue: "true"- name: GF_AUTH_ANONYMOUS_ORG_ROLEvalue: Admin- name: GF_SERVER_ROOT_URL# If you're only using the API Server proxy, set this value instead:# value: /api/v1/proxy/namespaces/kube-system/services/monitoring-grafana/value: /volumes:- name: grafana-storageemptyDir: {}
grafana-service.yaml:
apiVersion: v1kind: Servicemetadata:labels:# For use as a Cluster add-on (https://github.com/kubernetes/kubernetes/tree/master/cluster/addons)# If you are NOT using this as an addon, you should comment out this line.kubernetes.io/cluster-service: 'true'kubernetes.io/name: monitoring-grafananame: monitoring-grafananamespace: kube-systemspec:# In a production setup, we recommend accessing Grafana through an external Loadbalancer# or through a public IP.# type: LoadBalancer# You could also use NodePort to expose the service at a randomly-generated porttype: NodePortports:- port: 80targetPort: 3000selector:k8s-app: grafana
Grafana 的 service 文件里面默认使用的是 LoadBalancer,但如果你的集群不支持的话,可以像我上面一样使用 NodePort 的方式。
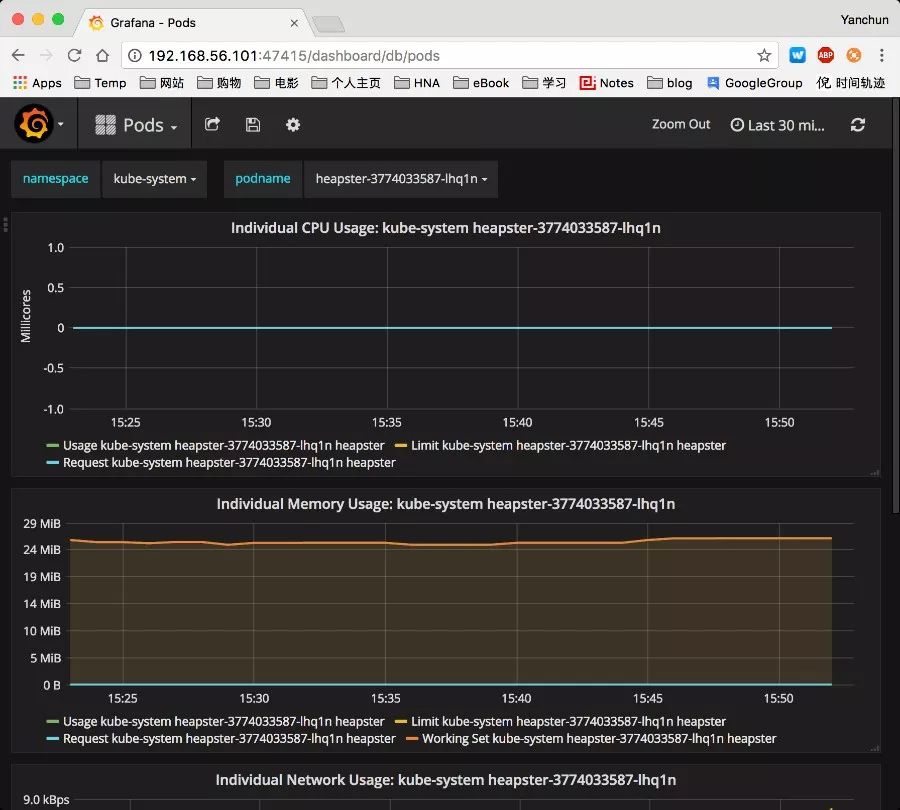
三个应用部署好以后,我们可以通过 Web 去访问 Grafana了:
当然,如果你装了 kubernetes-dashboard,你会发现 dashboard 上面也有资源使用的图示了。
实际使用中,我们可能一般不会使用诸如 Grafana 这种显示工具,而是通过InfluxDB 的 API 去获取监控信息,然后在自己的系统里面展示监控。后面文章中我们会展示如何通过 Heapster 的 API 去获取这些监控信息。
参考:
Resource Usage Monitoring
https://github.com/kubernetes/heapster
原文链接:https://niyanchun.com/kubernetes-resource-usage-monitor-practice.html
51Reboot 的 K8S 课程将于 11.27 日开课
想要了解或者试听的朋友扫下面的二维码咨询小助手