


Prometheus
是Cloud Native Computing Foundation
的一个监控系统项目, 集采集、监控、报警等特点于一体。
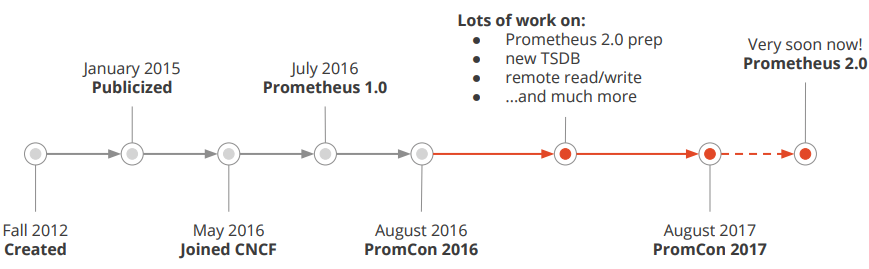
Prometheus
主要受启发于Google
的Brogmon
监控系统, 从2012
年开始由前Google
工程师在Soundcloud
以开源软件的形式进行研发,2017
年底发布了基于全新存储层的2.0
版本,当前最新版本是2.28
版本。
谈谈监控的本质?
监控系统需要能够有效的支持白盒监控和黑盒监控。
来源:《SRE: Google运维解密》
通过白盒能够了解其内部的实际运行状态,通过对监控指标的观察能够预判,从而对潜在的不确定因素进行优化。
通过黑盒监控,可以在系统或者服务在发生故障时能够快速通知相关的人员进行处理。
通过白加黑策略,主要为了达到以下目标:
稳定长期趋势分析,对不确定性和突发状况有个整体的把控和预测,进而做出相对应的应对策略; 通过版本数据对比并发和负载,评估新版本发布后可能带来的未知风险或性能提升指标; 发生故障时候能及时告警通知,附带错误信息辅助判断; 可视化,对系统的资源状态有个完整的把握;
Prometheus架构图
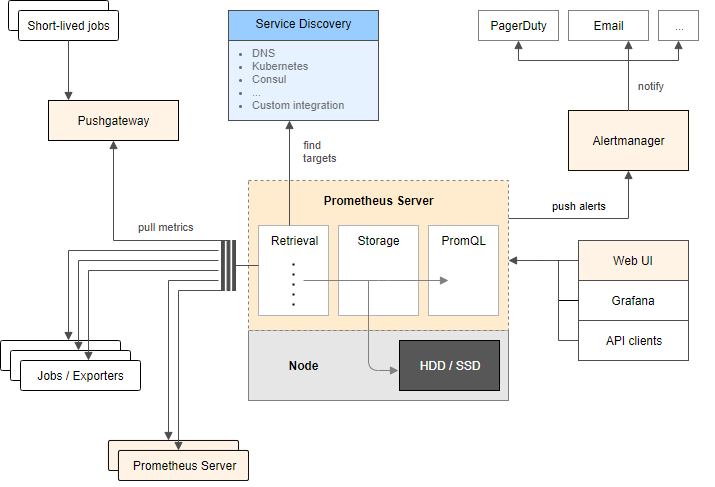
上图描述了prometheus
各组件和其作用:
prometheus server
负责实现监控数据的抓取、存储和查询;
抓取:通过配置文件中指定静态配置或使用服务发现的方式管理监控对象; 存储:使用 TSDB
作为存储数据库,将采集到的监控指标数据按照时间序列的方式存储在本地磁盘;查询:使用强大的 promsql
来查询指标数据,借助web ui
、grafana
等集成工具使用promsql
查询;
exporters
负责暴露数据给prometheus server
进行数据抓取;
直接采集:内置用于向 prometheus
暴露监控数据的端点,比如cadvisor
,etcd
等;间接采集:需要通过 prometheus
提供的library
编写对应的采集程序exporter
;
alertmanager
负责基于promsql
创建告警规则,通过与第三方通知方式或者webhook
集成,可完成告警通知消息发送;
pushgateway
统一网关,负责接收自定义过来推送的指标,统一暴露给prometheus_server
, 这种方式使用统一网关中转,改变原有的拉模式为推模式,将数据推送给统一网关,进而暴露给prometheus_server
拉取。
Prometheus具有哪些特点
多维数据模型(由指标名称、键/值组合的时间序列); 提供了一种强大而灵活的查询语言 promsql
;没有对分布式存储的依赖,单个服务器节点是自主的; 主要支持时间序列集合的HTTP拉模模型,同时也提供 PushGateway
来满足;服务发现; 自带 UI
,支持丰富多种图形和仪表板,还能与其他;支持分层和水平联合;
安装部署
k8s
平台部署详见下文prometheus operator
部分, 单机部署详见https://prometheus.io/docs/prometheus/latest/installation/
Promethus配置文件详解
配置文件主要包括:
全局配置 告警配置 promsql
查询语句构成的rules待抓取的后端配置, 服务发现
# 全局配置global:scrape_interval: 15s # By default, scrape targets every 15 seconds.# Attach these labels to any time series or alerts when communicating with# external systems (federation, remote storage, Alertmanager).external_labels:monitor: 'codelab-monitor'# 告警配置alerting:alertmanagers:- static_configs:- targets:# - alertmanager:9093# 根据指定文件的rules来周期性的评估,评估周期与全局变量'evaluation_interval'有关:rule_files:- "first_rules.yml"# 待抓取的后端配置,下面是Prometheus的后端配置scrape_configs:# The job name is added as a label `job=<job_name>` to any timeseries scraped from this config.- job_name: 'prometheus'# Override the global default and scrape targets from this job every 5 seconds.scrape_interval: 5s# 静态配置static_configs:- targets: ['localhost:9090']下面解释下rule_files, 假设定义了first_rules.yaml这个文件: groups:- name: cpu-noderules:# record用下面的promsql来周期性评估指标,指标名称为 job_instance_mode:node_cpu_seconds:avg_rate5m- record: job_instance_mode:node_cpu_seconds:avg_rate5mexpr: avg by (job, instance, mode) (rate(node_cpu_seconds_total[5m]))Promql
promql
作为prometheus server
查询语言,有着自己的指标与数据类型定义、运算操作和聚合函数,本章就此粗浅地探讨一下promql
怎么写、怎么理解。
样本
首先,我们理解下什么是样本。
我们知道prometheus
使用TSDB
时序数据库存储数据,顾名思义,随着时间的推移,不断落盘数据,而每一个时间点,对应的metrics指标内容,就表示一个样本。
^│ . . . . . . . . . . . . . . . . . . . node_cpu{cpu="cpu0",mode="idle"}│ . . . . . . . . . . . . . . . . . . . node_cpu{cpu="cpu0",mode="system"}│ . . . . . . . . . . . . . . . . . . node_load1{}│ . . . . . . . . . . . . . . . . . .v<------------------ 时间 ---------------->
TSDB
中一个样本包含指标、时间戳和值。
<--------------- metric ---------------------><-timestamp -><-value->http_request_total{status="200", method="GET"}@1434417560938 => 94355http_request_total{status="200", method="GET"}@1434417561287 => 94334http_request_total{status="404", method="GET"}@1434417560938 => 38473http_request_total{status="404", method="GET"}@1434417561287 => 38544http_request_total{status="200", method="POST"}@1434417560938 => 4748http_request_total{status="200", method="POST"}@1434417561287 => 4788而一个样本通常由多个指标组成。
我们来看一个样本数据,它是由prometheus server
在t1
时刻从一个exporter
的metrics
接口中拉取过来的:
# HELP node_cpu Seconds the cpus spent in each mode.# TYPE node_cpu counternode_cpu{cpu="cpu0",mode="idle"} 362812.7890625# TYPE node_load1 gaugenode_load1 3.0703125以#开头的标识注释,这没有疑问。
一个样本主要有指标名称、label键值对、样本值等构成:
node_cpu
和node_load1
表明了当前指标的名称、大括号中的标签键值对则反映了当前样本的特征和维度(可选)、最后的浮点数则是该监控样本的具体值。
我们都用过mysql
,如果把node_cpu{cpu="cpu0",mode="idle"}
翻译成sql
, 它将会如何表示?
$ select * from node_cpu where cpu=cpu0 and mode=idle and create_time=t1
这意味着我正在查询node_cpu
表中创建时间为t1
,cpu
为cpu0
,mode
为idle
的数据。
瞬间向量和区间向量
所谓瞬间向量就是值特定时间戳下的一组指标向量,区间向量就是指一组时间序列下包含每个时间序列随时间变化的数据点范围。
http_request_total{} # 瞬时向量表达式,选择当前最新的数据http_request_total{}[5m] # 区间向量表达式,选择以当前时间为基准,5分钟内的数据,时间单位可以是y/w/d/h/m/s/ms等
指标查询
等值查询、模糊查询:
=
、!=
、=~
、!~特殊查询:
offset
、@ modifier
在sql
中,除了等值查询,你也可以使用like
等方式进行模糊查询,这时候可以修改为:
node_cpu{cpu=~"cpu0",mode="idle"}
这里的~=
就表示模糊查询,但查询时必须指定一个指标,并且指标值不能为空:
{job=~".*"}              # Bad!
{job=~".+"}              # Good!{job=~".*",method="get"} # Good!
还可以用!=
和!~
来表示排除查询。
特殊的,以下表达式选择名称以job
开头的所有指标, 你可以把__name__
想象成是语法糖:
{__name__=~"job:.*"}
表示时间范围的查询:
如果我们想查询5m之前的瞬时数据呢?可以使用offset: http_request_total{}[5m] # 区间向量表达式,选择以当前时间为基准,5分钟内的数据,时间单位可以是y/w/d/h/m/s/ms等
http_request_total{} offset 5m # 5m之前的瞬时指标http_request_total{}[5m] offset 5m # 5m之前的区间指标http_requests_total{method="GET"} offset 5m @ 1609746000 // 指定时间戳的瞬时指标
注意:
http_request_total{}[5m] offset 5m
是一个整体指标,使用函数表达式应该将整体括起来。
操作符
支持的数学运算符有:
+
、-
、*
、\
、%
、^
等;支持的比较符有:
==
、!=
、>=
、<=
、>
、<
等;支持集合运算:交集
and
、并集or
、差集unless
;
使用数学运算符时,可能的情况有标量/标量、向量/标量和向量/向量值对。
标量/标量:应用于两个标量操作数的运算符的结果。
标量/向量:应用于向量中每个数据样本的值。
向量/向量:按照分组的label来进行左右运算,结果将按分组标签分类。
以向量/向量的加法为例子:
node_disk_bytes_written + node_disk_bytes_read
那这个表达式是如何工作的呢?
依次找到与**左边向量元素匹配(标签完全一致)**的右边向量元素进行运算,如果没找到匹配元素,则直接丢弃;
使用比较符时:
标量/标量:必须提供 bool 修饰符,根据比较结果,这些运算符会产生另一个 0(假)或 1(真)标量。
标量/向量:这些运算符应用于向量中每个向量数据样本的值,并且比较结果为假的向量元素从结果向量中删除。
向量/向量:默认情况下,这些运算符充当过滤器,应用于匹配的每个标签。表达式不为真,或在表达式的另一侧找不到匹配项的向量元素将从结果中删除,依靠分组标签作为输出标签集。如果使用了 bool 修饰符,则将被删除的向量元素的值为 0,保留的向量元素的值为 1,依靠分组标签来输出标签集。如果使用了 bool 修饰符,则度量名称将被删除。
使用集合运算符时:
vector1 and vector2
会产生一个由vector1
的元素组成的新的向量。该向量包含vector1
中完全匹配vector2
中的元素组成,相当于取交集。
vector1 or vector2
会产生一个新的向量,该向量包含vector1
中所有的样本数据,以及vector2
中没有与vector1
匹配到的样本数据,相当于取并集。
vector1 unless vector2
会产生一个新的向量,新向量中的元素由vector1
中没有与vector2
匹配的元素组成,相当于取差集。
关于操作符优先级,遵从数学操作符逻辑、and
、unless
、or
的优先级。
向量匹配原则
在以上的操作符篇中讨论了向量之间的作用原则,这一部分作为以上向量/向量的一个补充。
根据匹配模式映射关系来说,可以分为一对一、一对多(或多对一)。
ignoring 关键字允许在匹配时忽略某些标签,而 on 关键字允许从有限几个标签匹配
以下面的例子为例:
一对一匹配时, 如果不ignoring(code),就不会有匹配项,因为指标不共享同一 method_code:http_errors:rate5m{method="get", code="500"} 24method_code:http_errors:rate5m{method="get", code="404"} 30method_code:http_errors:rate5m{method="put", code="501"} 3method_code:http_errors:rate5m{method="post", code="500"} 6method_code:http_errors:rate5m{method="post", code="404"} 21method:http_requests:rate5m{method="get"} 600method:http_requests:rate5m{method="del"} 34method:http_requests:rate5m{method="post"} 120
组标签。
<vector expr> <bin-op> ignoring(<label list>) <vector expr><vector expr> <bin-op> on(<label list>) <vector expr>
以下是一对一匹配时的表达式:
method_code:http_errors:rate5m{code="500"} / ignoring(code) method:http_requests:rate5m
多对一匹配时,左向量每个方法标签值包含一个以上的标签值:
<vector expr> <bin-op> ignoring(<label list>) group_left(<label list>)<vector expr><vector expr> <bin-op> ignoring(<label list>) group_right(<label list>)<vector expr><vector expr> <bin-op> on(<label list>) group_left(<label list>) <vector expr><vector expr> <bin-op> on(<label list>) group_right(<label list>) <vector expr>
以下的多对一匹配,使用group_left表示这一点,右侧的元素现在与左侧具
有相同标签就可以匹配:
method_code:http_errors:rate5m / ignoring(code) group_left method:http_requests:rate5m
聚合操作
counter
、gauge
、Histogram
和Summary
从上面指标的注释来看,已经有counter
和gauge
两种指标类型。
counter
表示为数据只增不减的计数器,gauge
表示可增可减的仪表盘(汽车上的油表盘,可大可小)。
除了这两种类型,还有用来描述数据分布情况的两类指标Histogram
和Summary
。
Histogram
和Summary
这两个指标的需求场景,来源于大多数情况下人们更倾向于使用某些量化指标的平均值、分位数等,例如CPU的平均使用率、页面的平均响应时间。
# HELP prometheus_tsdb_wal_fsync_duration_seconds Duration of WAL fsync.# TYPE prometheus_tsdb_wal_fsync_duration_seconds summaryprometheus_tsdb_wal_fsync_duration_seconds{quantile="0.5"} 0.012352463prometheus_tsdb_wal_fsync_duration_seconds{quantile="0.9"} 0.014458005prometheus_tsdb_wal_fsync_duration_seconds{quantile="0.99"} 0.017316173prometheus_tsdb_wal_fsync_duration_seconds_sum 2.888716127000002prometheus_tsdb_wal_fsync_duration_seconds_count 216
从上面的样本中可以得知当前Prometheus Server
进行wal_fsync
操作的总次数为216
次,耗时2.888716127000002s
。其中中位数(quantile=0.5
)的耗时为0.012352463
,9分位数(quantile=0.9
)的耗时为0.014458005s
。
内置函数
sum
(求和)min
(最小值)max
(最大值)avg
(平均值)count
(计数)count_values
(对value进行计数)abs
(绝对值)
在学习编程语言时候,会使用sum
、avg
以及count
等,这很好理解。转换为sql
模式,sum by (mode) (node_cpu_seconds_total)
类似于select sum(vaule) from node_cpu_seconds_total group by mode
,其他的函数都可以类推。
# 查询系统所有http请求的总量sum(http_request_total)# 按照mode计算主机CPU的平均使用时间avg(node_cpu) by (mode)
rateiratepredict_lineardelta
# 按照主机汇总查询各个主机的CPU使用率sum( sum(irate(node_cpu{mode!='idle'}[5m])) / sum(irate(node_cpu[5m])) ) by (instance)
这里irate
函数表示计算区间向量v在时间窗口内瞬时增长率,还有个类似的函数rate
函数表示计算区间向量v在时间窗口内平均增长速率。
所谓瞬时增长率,是通过区间向量中最后两个样本数据来计算区间向量的增长速率,可以避免长尾问题
。不过当需要分析长期趋势或者在告警规则中,irate
的这种灵敏度反而容易造成干扰。
另外,predict_linear(v range-vector, t scalar)
函数可以帮助管理员预测变化趋势,尤其是业务带来陡增资源情况:
predict_linear(node_filesystem_free{job="node"}[2h], 4 * 3600) < 0
以上表达式表示基于现有2小时的样本数据,来预测主机可用磁盘空间的是否在4个小时候被占满。
另外,delta返回区间向量中,第一个元素和最后一个元素之间的变化值,常用与gauge结合使用。
更多的内置函数参考:https://prometheus.io/docs/prometheus/latest/querying/functions/
告警
在学习完promql
后,我们就可以使用promql
进行布尔表达式查询,当满足某个条件为真时就可以产生一次告警消息。
上面说的表达式称之为告警规则,由PromQL
进行定义,其实际意义是当表达式(PromQL
)查询结果持续多长时间(During
)后出发告警。
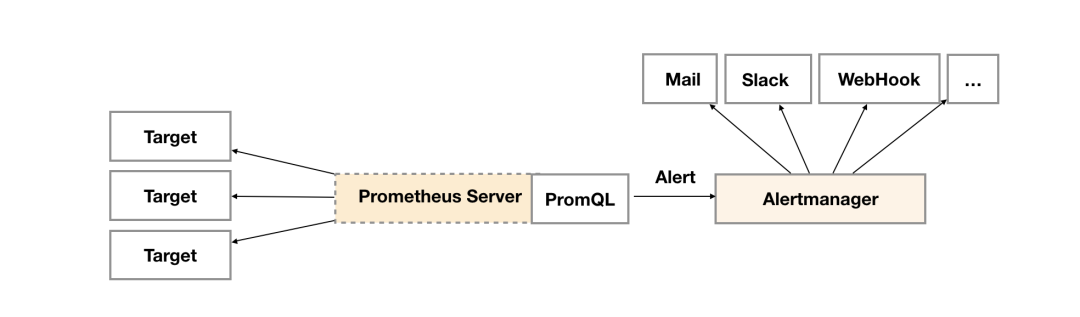
Alertmanager
作为一个独立的组件,负责接收并处理来自Prometheus Server
(也可以是其它的客户端程序)的告警信息。Prometheus
内置了对邮件,Slack
等多种通知方式的支持,同时还支持与Webhook
的集成,以支持更多定制化的场景。
Alertmanager
除了提供基本的告警通知能力以外,还主要提供了如:分组、抑制以及静默等告警特性:
分组:分组机制可以将详细的告警信息合并成一个通知。 抑制:抑制是指当某一告警发出后,可以停止重复发送由此告警引发的其它告警的机制。 静默:静默提供了一个简单的机制可以快速根据标签对告警进行静默处理。如果接收到的告警符合静默的配置, Alertmanager
则不会发送告警通知。
定义告警规则
groups:- name: examplerules:- alert: HighErrorRateexpr: job:request_latency_seconds:mean5m{job="myjob"} > 0.5for: 10mlabels:severity: pageannotations:summary: High request latencydescription: description info
详细字段如下:
alert
:告警规则的名称。expr
:基于PromQL
表达式告警触发条件,用于计算是否有时间序列满足该条件。for
:评估等待时间,可选参数。用于表示只有当触发条件持续一段时间后才发送告警。在等待期间新产生告警的状态为pending。labels
:自定义标签,允许用户指定要附加到告警上的一组附加标签。annotations
:用于指定一组附加信息,比如用于描述告警详细信息的文字等,annotation
s的内容在告警产生时会一同作为参数发送到Alertmanager
。
这些告警规则可以在prometheus
配置中进行预定义:
rule_files:[ - <filepath_glob> ... ]global: //定义自己的告警计算周期[ evaluation_interval: <duration> | default = 1m ]alerting: // 关联alertmanageralertmanagers:- static_configs:- targets: ['localhost:9093']
告警配置文件
Alertmanager
的配置主要包含两个部分:路由(route
)以及接收器(receivers
)。
所有的告警信息都会从配置中的顶级路由(route
)进入路由树,根据路由规则将告警信息发送给相应的接收器。接收器可以定义成一组,比如可以按照角色(比如系统运维,数据库管理员)来划分多个接收器。接收器可以关联邮件,Slack
以及其它方式接收告警信息。
global:resolve_timeout: 5mroute:group_by: ['alertname']group_wait: 10sgroup_interval: 10srepeat_interval: 1hreceiver: 'web.hook'receivers:- name: 'web.hook'webhook_configs:- url: 'http://127.0.0.1:5001/'inhibit_rules:- source_match:severity: 'critical'target_match:severity: 'warning'equal: ['alertname', 'dev', 'instance']
Notification Manager
如果觉得上述的配置比较复杂,可以访问
github.com/kubesphere/notification-manager
了解云原生唯一全渠道通知告警系统。
Exporter
前文提到exporter
是用来给app
提供metrics
指标,供给prometheus server
抓取,对应于配置文件中的一个job
。
社区提供了丰富的exporter
, 可按需搜索安装, 部署运行正常后在/metrics
路径下可以获取到指标。
在与prometheus
集成时,需要添加job
配置:
- job_name: cadvisorstatic_configs:- targets:- localhost:8080
关于自定义exporter
需要依赖各个编程语言的library
库。
https://cloud.tencent.com/developer/article/1744817
Prometheus Operator
https://github.com/prometheus-operator/kube-prometheus
https://github.com/prometheus-operator/prometheus-operator
https://github.com/prometheus-community/helm-charts/tree/main/charts/kube-prometheus-stack
Operator
针对管理特定应用程序的,建立在基本的Resource
和Controller
的概念上。
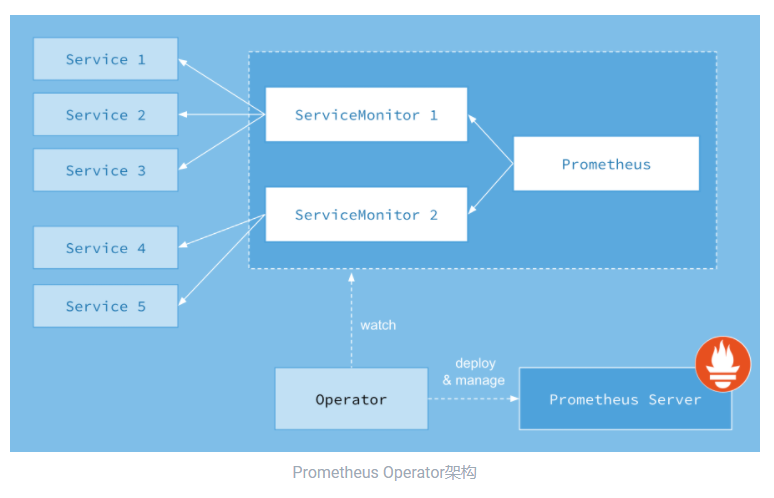
我们看下这个operator
定义了哪些CRD
:
Prometheus
: 定义Prometheus
资源实例;ServiceMonitor
: 定义监控服务;PrometheusRule
: 告警配置;Alertmanager
:告警实例;
我们主要看下ServiceMonitor
怎么来暴露抓取服务给prometheus
。
首先,得保证集群上已经部署好了对应的exporter
,或者在指定endpoint
上暴露了相应的接口。
apiVersion: monitoring.coreos.com/v1kind: ServiceMonitorname: kubeletnamespace: kubesphere-monitoring-systemspec:endpoints:- bearerTokenFile: /var/run/secrets/kubernetes.io/serviceaccount/tokenhonorLabels: trueinterval: 1mmetricRelabelings:- action: keepregex: kubelet_node_name|kubelet_running_container_count|kubelet_running_pod_count|kubelet_volume_stats.*|kubelet_pleg_relist_duration_seconds_.+sourceLabels:- __name__port: https-metricsrelabelings:- action: labeldropregex: (service|endpoint)scheme: httpstlsConfig:insecureSkipVerify: true- bearerTokenFile: /var/run/secrets/kubernetes.io/serviceaccount/tokenhonorLabels: trueinterval: 1mmetricRelabelings:- action: keepregex: container_cpu_usage_seconds_total|container_memory_usage_bytes|container_memory_cache|container_network_.+_bytes_total|container_memory_working_set_bytes|container_cpu_cfs_.*periods_totalsourceLabels:- __name__path: /metrics/cadvisorport: https-metricsrelabelings:- action: labeldropregex: (service|endpoint)scheme: httpstlsConfig:insecureSkipVerify: truejobLabel: k8s-appnamespaceSelector:matchNames:- kube-systemselector:matchLabels:k8s-app: kubelet
这个servivemonitor
的定义是通过selectors
和namepace
来绑定endpoints
的,有点类似service
的定义:
kubectl -n kube-system get endpoints -l k8s-app=kubelet
而endpoints
部分的定义则阐述了和endpoints metrics API
交互的一些逻辑,包含metricRelabelings
、bearerToken
、tlsConfig
等。
再看看其他CRD
, 首先是prometheus
实例:
apiVersion: monitoring.coreos.com/v1kind: Prometheusmetadata:labels:prometheus: k8smanager: kubectlname: k8snamespace: kubesphere-monitoring-systemspec:additionalScrapeConfigs:key: prometheus-additional.yamlname: additional-scrape-configsaffinity:...alerting:...evaluationInterval: 1mimage: prom/prometheus:v2.26.0nodeSelector:kubernetes.io/os: linuxpodMonitorNamespaceSelector: {}podMonitorSelector: {}query:maxConcurrency: 1000replicas: 2resources:...retention: 7druleSelector:matchLabels:prometheus: k8srole: alert-rulesscrapeInterval: 1msecurityContext:fsGroup: 0runAsNonRoot: falserunAsUser: 0serviceAccountName: prometheus-k8sserviceMonitorNamespaceSelector: {}serviceMonitorSelector: {}storage:...tolerations:...version: v2.26.0
再看看prometheusrules
:
apiVersion: monitoring.coreos.com/v1kind: PrometheusRulemetadata:labels:prometheus: k8srole: alert-rulesname: prometheus-k8s-rulesnamespace: kubesphere-monitoring-systemspec:groups:- name: kube-apiserver.rulesrules:- expr: |((# too slowsum(rate(apiserver_request_duration_seconds_count{job="apiserver",verb=~"LIST|GET"}[1d]))-(sum(rate(apiserver_request_duration_seconds_bucket{job="apiserver",verb=~"LIST|GET",scope=~"resource|",le="0.1"}[1d])) +sum(rate(apiserver_request_duration_seconds_bucket{job="apiserver",verb=~"LIST|GET",scope="namespace",le="0.5"}[1d])) +sum(rate(apiserver_request_duration_seconds_bucket{job="apiserver",verb=~"LIST|GET",scope="cluster",le="5"}[1d]))))+# errorssum(rate(apiserver_request_total{job="apiserver",verb=~"LIST|GET",code=~"5.."}[1d])))/sum(rate(apiserver_request_total{job="apiserver",verb=~"LIST|GET"}[1d]))labels:verb: readrecord: apiserver_request:burnrate1d...
搭建Prometheus高可用集群
local
Prometheus 2.x
采用自定义的存储格式,将样本数据保存在本地磁盘当中。两个小时为一个时间窗口,将两小时内产生的数据存储在一个块(Block
)中,每一个块中包含该时间窗口内的所有样本数据(chunks
),元数据文件(meta.json
)以及索引文件(index
)。
具体的数据为:
./data|- 01BKGV7JBM69T2G1BGBGM6KB12 # 块|- meta.json # 元数据|- wal # 写入日志|- 000002|- 000001|- 01BKGTZQ1SYQJTR4PB43C8PD98 # 块|- meta.json #元数据|- index # 索引文件|- chunks # 样本数据|- 000001|- tombstones # 逻辑数据|- 01BKGTZQ1HHWHV8FBJXW1Y3W0K|- meta.json|- wal|-000001
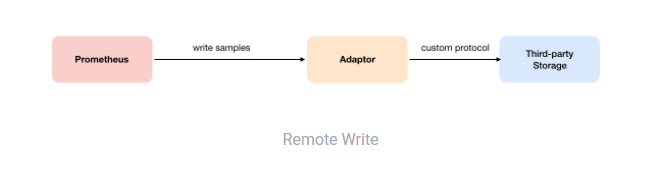
Remote Write
用户可以在Prometheus
配置文件中指定Remote Write
(远程写)的URL地址,一旦设置了该配置项,Prometheus
将采集到的样本数据通过HTTP
的形式发送给适配器(Adaptor
)。而用户则可以在适配器中对接外部任意的服务。
配置如下:
remote_write:url: <string>[ remote_timeout: <duration> | default = 30s ]write_relabel_configs:[ - <relabel_config> ... ]basic_auth:[ username: <string> ][ password: <string> ][ bearer_token: <string> ][ bearer_token_file: /path/to/bearer/token/file ]tls_config:[ <tls_config> ][ proxy_url: <string> ]
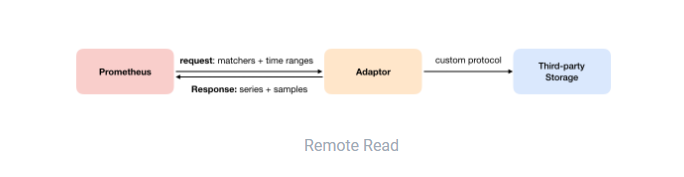
Remote Read
如下图所示,Promthues
的Remote Read
(远程读)也通过了一个适配器实现。在远程读的流程当中,当用户发起查询请求后,Promthues
将向remote_read
中配置的URL
发起查询请求(matchers
,ranges
),Adaptor
根据请求条件从第三方存储服务中获取响应的数据。同时将数据转换为Promthues
的原始样本数据返回给Prometheus Server
。
配置如下:
remote_read:url: <string>required_matchers:[ <labelname>: <labelvalue> ... ][ remote_timeout: <duration> | default = 30s ][ read_recent: <boolean> | default = false ]basic_auth:[ username: <string> ][ password: <string> ][ bearer_token: <string> ][ bearer_token_file: /path/to/bearer/token/file ][ <tls_config> ][ proxy_url: <string> ]
联邦集群
联邦集群的本质就是多实例部署,对于大部分监控规模而言,在每一个数据中心安装一个Prometheus Server
实例,就可以搭建一个联邦集群。
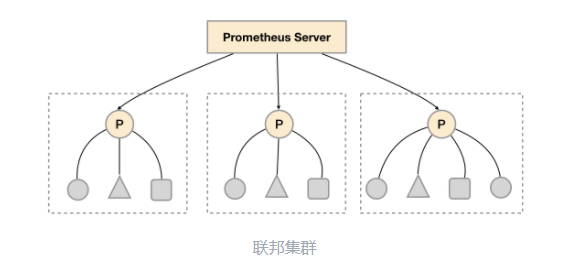
联邦集群的核心在于每一个Prometheus Server
都包含一个当前实例中监控样本的接口/federate
。
对于中心Prometheus Server
而言,无论是从其他的Prometheus
实例还是Exporter
实例中获取数据实际上并没有任何差异。
scrape_configs:- job_name: 'federate'scrape_interval: 15shonor_labels: truemetrics_path: '/federate'params:'match[]':- '{job="prometheus"}'- '{__name__=~"job:.*"}'- '{__name__=~"node.*"}'static_configs:- targets:- '192.168.77.11:9090'- '192.168.77.12:9090'
此外,联邦集群的特性可以帮助用户根据监控规模对Promthues
部署架构进行功能分区调整。
例如,每一个Prometheus Server
实例只负责采集当前数据中心中的一部分任务(Job
),就可以将不同的监控任务分离到不同的Prometheus
实例当中,最后由中心Prometheus
实例进行聚合。
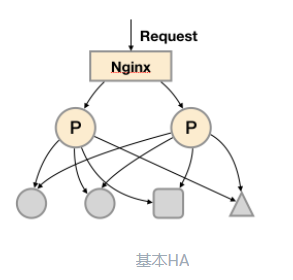
高可用演进
HA
模式:
由于
Pull
机制的设计,为了确保Promthues
服务的可用性,用户只需要部署多套Prometheus Server
实例,并且采集相同的Exporter
目标即可。
HA
保证了prometheus server
的可用性,却没法保证一致性以及持久化问题。
通过基本HA + 远程存储
, 将监控数据保存在第三方存储服务上, 在解决了Promthues
服务可用性的基础上,同时确保了数据的持久化,当Promthues Server
发生宕机或者数据丢失的情况下,可以快速的恢复。
引入联邦集群, 实现基本HA + 远程存储 + 联邦集群
, 可进一步提高水平扩展能力:
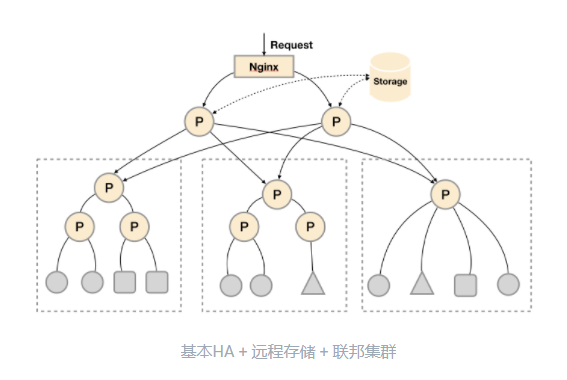
联邦任务切分参考配置:
global:external_labels:slave: 1 # This is the 2nd slave. This prevents clashes between slaves.scrape_configs:- job_name: some_jobrelabel_configs:- source_labels: [__address__]modulus: 4target_label: __tmp_hashaction: hashmod- source_labels: [__tmp_hash]regex: ^1$action: keep- job_name: slaveshonor_labels: truemetrics_path: /federateparams:match[]:- '{__name__=~"^slave:.*"}' # Request all slave-level time seriesstatic_configs:- targets:- slave0:9090- slave1:9090- slave3:9090- slave4:9090
Thanos
https://github.com/thanos-io/thanos
Thanos
是一组可以组合成具有无限存储容量的高可用性度量系统的组件,可以无缝添加到现有 Prometheus 部署之上。
Thanos
基于prometheus
生态的目标是:
指标的全局查询视图;
无限保留指标;
组件的高可用性,包括 Prometheus;
Thanos
官方建议始终按照Prometheus
团队的建议运行Prometheus
:
将
Prometheus
放在同一个故障域中;使用永久性磁盘在
Prometheus
重新启动后保留数据;使用局部压缩以获得更长的保留时间;
不要更改最小
TSDB
块持续时间;除非必要,否则不要扩展 Prometheus,单个 Prometheus 非常高效;
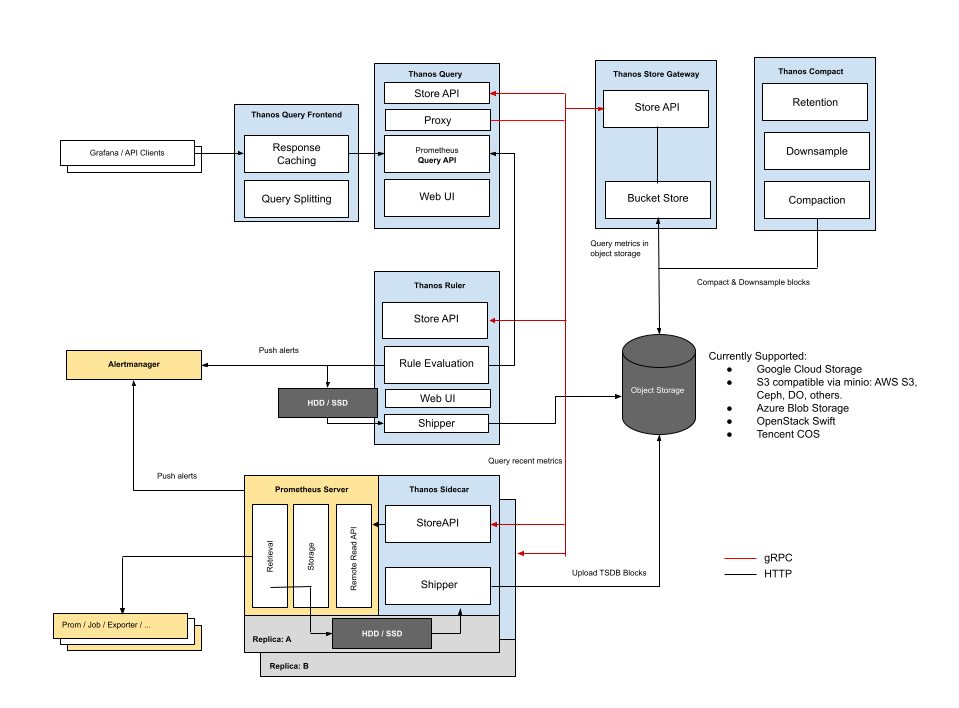
组件简介:
Sidecar
: 用来连接prometheus
,读将其上传给云存储件;Store Gateway
: 给云存储引擎提供指标;Compactor
: 对存储在云存储引擎中的数据进行压缩、下采样和应用保留;Receiver
: 从Prometheus
的远程写WAL
接收数据,将其暴露,或将其上传到云存储引擎;Ruler/Rule
: 针对Thanos
中的数据评估记录和警报规则进行展示或上传;Querier/Query
: 实现Prometheus
的v1 API
来聚合来自底层组件的数据;Query Frontend
: 实现Prometheus
的v1 API
将其代理到Query
,响应并实现按查询天数进行可选拆分;
Sidecar
https://github.com/thanos-io/thanos/blob/main/docs/components/sidecar.md
Sidecar
的目的是将Prometheus
数据备份到对象存储中,并允许查询者使用通用、高效的StoreAPI
查询Prometheus
数据。
具体来说:
它在 Prometheus
的远程读API
之上实现了Thanos
的Store API
;上传 TSDB
块给对象存储,使得Prometheus
服务器的历史数据通过对象存储变得持久和可查询;sidecar
能够reload
和查看Prometheus
规则和配置,解压缩和替换环境变量;
注意:
如果
crash
会导致两个小时的数据丢失,因为prometheus
两个小时生产一次block
;
Sidecar
模式需要确保激活了标志--web.enable-lifecycle
;使用对象存储需要激活
--objstore.* flags
;默认只能上传非压缩的块,激活压缩块得使用
--shipper.upload-compacted
;
样例:
prometheus \--storage.tsdb.max-block-duration=2h \--storage.tsdb.min-block-duration=2h \--web.enable-lifecyclethanos sidecar \--tsdb.path "/path/to/prometheus/data/dir" \--prometheus.url "http://localhost:9090" \--objstore.config-file "bucket.yml"
在sidecar
中激活grpc StoreAPI
:
thanos sidecar \--tsdb.path /var/prometheus \--objstore.config-file bucket_config.yaml \ # Bucket config file to send data to--prometheus.url http://localhost:9090 \ # Location of the Prometheus HTTP server--http-address 0.0.0.0:19191 \ # HTTP endpoint for collecting metrics on the Sidecar--grpc-address 0.0.0.0:19090 # GRPC endpoint for StoreAPI
Reciever
https://github.com/thanos-io/kube-thanos/blob/main/examples/all/manifests/thanos-receive-default-statefulSet.yaml
https://thanos.io/v0.23/201812-thanos-remote-receive.md/
Reciever
的特点跟sidecar
大相径庭,采用的是push
模式,部署为独立组件。
由于每两小时才将TSDB
数据块提交给对象存储,sidecar
模式下,查询器是无法做到实时查询最新数据的,因为数据总是落后于prometheus
的数据。
Reciever
作为远程数据接收者,接受来自prometheus
远程写,与现有Prometheus
服务器分离部署,实现了很有意思的功能。例如,长期存储和横向可扩展性,同时保持本地 Prometheus 对短期数据的警报可靠有用。
为了防止数据库级别的数据泄漏,每个租户都有一个单独的TSDB
实例,这意味着单个Recieve
可以管理多个TSDB
实例。
Reciever
部署后,需要将prometheus
远程写url
设置为Reciever
地址:
remote_write:
  - url: http://<thanos-receive-container-ip>:10908/api/v1/receive
我们看下具体架构图:
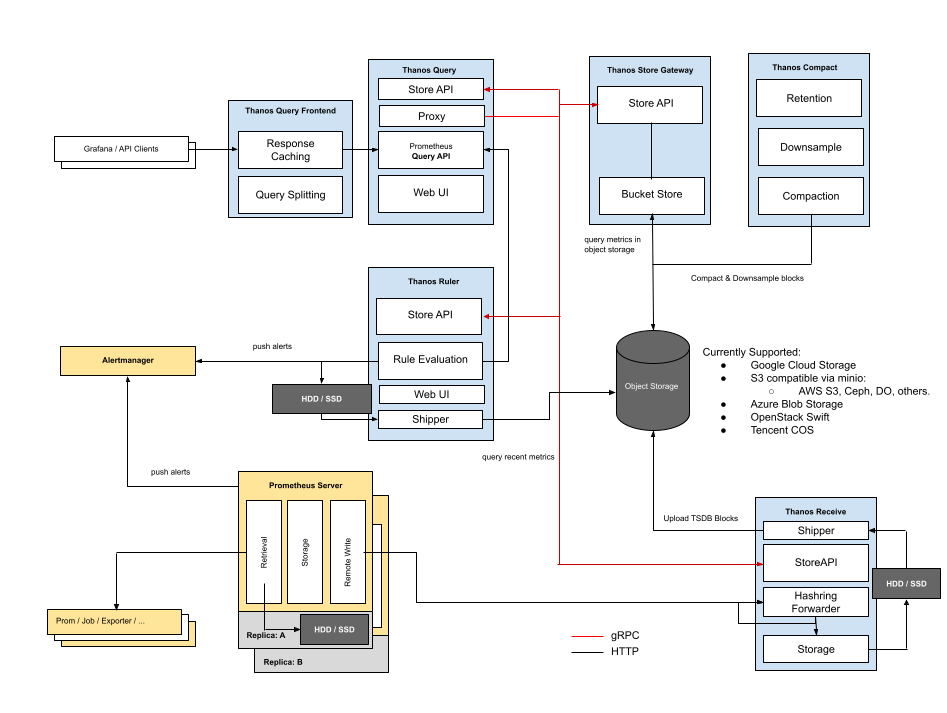
如上架构图,Thanos
通过一致性哈希来分发分布在所有Recievers
中的时间序列。
Recievers
通过外部系统(例如配置管理系统)配置了他们的唯一身份,从而确定了他们在散列中的位置,这决定它们接受和存储哪些时间序列。
当Reciever
将请求路由到节点时,会将负载随机分配到所有可用的Recievers
。
为确保具有公共标签的潜在大时间序列最终不分发到同一节点,租户的 ID 应包含在哈希中:
--receive.tenant-header=THANOS-TENANT
对应的hash
方式为:
hash(string(tenant_id) + sort(timeseries.labelset).join())
软硬多租户配置:
[{"hashring": "tenant-a","endpoints": ["tenant-a-1.metrics.local:19291/api/v1/receive", "tenant-a-2.metrics.local:19291/api/v1/receive"],"tenants": ["tenant-a"]},{"hashring": "tenants-b-c","endpoints": ["tenant-b-c-1.metrics.local:19291/api/v1/receive", "tenant-b-c-2.metrics.local:19291/api/v1/receive"],"tenants": ["tenant-b", "tenant-c"]},{"hashring": "soft-tenants","endpoints": ["http://soft-tenants-1.metrics.local:19291/api/v1/receive"]}]
Reicever
将使用租户ID
的精确匹配来分发接收端点的请求。收到请求后,将针对每个hashring的配置允许的租户来匹配请求中指定的租户,称为硬租户;反之,如果hashring没有指定明确的租户,则任何租户都被视为有效匹配,也就是所谓的软租户。如果没有找到,并且没有配置软租户,接收方会报错。
Querier/Query
https://github.com/thanos-io/thanos/blob/main/docs/quick-tutorial.md#querierquery
https://github.com/thanos-io/kube-thanos/blob/main/manifests/thanos-query-deployment.yaml
现在需要部署一个统一的查询层来对接store APIS
:
thanos query \--http-address 0.0.0.0:19192 \--store 1.2.3.4:19090 \--store 1.2.3.5:19090 \--store dnssrv+_grpc._tcp.thanos-store.monitoring.svc
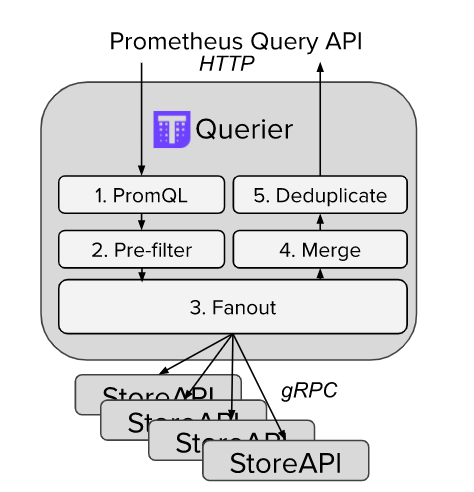
Querier/Query
是无感的和可扩展的,它不仅实现了Prometheus
的官方HTTP API
,可以与Grafana
等外部工具一起使用, 还能用于临时查询和存储状态。
下面看下去重查询是如何实现的。
prometheus
的去重基本上是通过配置global.external_labels
来实现的:
global:external_labels:region: eu-westmonitor: infrastructurereplica: A...
thanos
的去重查询可以根据replica
来实现:
thanos query \--http-address 0.0.0.0:19192 \--store 1.2.3.4:19090 \--store 1.2.3.5:19090 \--query.replica-label replica # Replica label for de-duplication--query.replica-label replicaX # Supports multiple replica labels for de-duplication
注意:
query
是可以和store
一起部署的;
DNS服务发现
https://github.com/thanos-io/thanos/blob/main/docs/service-discovery.md#dns-service-discovery
参见上面的文档,支持store API
的服务发现:
--store=dns+stores.thanos.mycompany.org:9090--store=dnssrv+_thanosstores._tcp.mycompany.org--store=dnssrv+_grpc._tcp.thanos-store.monitoring.svc--store=dnssrvnoa+_thanosstores._tcp.mycompany.org
Thanos Rule
Ruler
根据给定的Query
节点评估Prometheus
规则,暴露Store API
。https://github.com/thanos-io/kube-thanos/blob/main/examples/all/manifests/thanos-rule-statefulSet.yaml
https://zhuanlan.zhihu.com/p/137248127
thanos rule
命令根据所选查询API
来评估Prometheus
记录和警报规则。如果多个Querier
通过了,则执行round-robin
查询。
注意,thanos rule
是一个可选组件,原则上推荐尽量使用Prometheus
自带的rule
功能(生成新指标+告警),这个功能需要一些Prometheus
最新数据,直接使用Prometheus
本机rule
功能和数据,性能开销相比Thanos Rule
这种分布式方案小得多,并且几乎不会出错。
对于alert
类型的rule
,我们就需要用Thanos Rule
来做了,因为有关联的数据分散在多个Prometheus
上,用单机数据去做alert
计算是不准确的,可能会造成误告警或不告警。
Rule
的功能和Querier
基本一致,唯一的区别是它可以与Thanos
组件进行通信。
Compact
https://thanos.io/v0.23/compact.md/#compactor
https://github.com/thanos-io/kube-thanos/blob/main/examples/all/manifests/thanos-compact-statefulSet.yaml
compact
的目标是使用Prometheus 2.0
存储引擎来压缩对象存储中的块数据,以完成降采样。
所谓降采样,就是为时间间隔较大的(如数月或数年)的范围查询,提供快速获得结果的能力。
此外,Compactor
、Sidecar
、Receive
和Ruler
是唯一应该对对象存储具有写访问权限的Thanos
组件,只有Compactor
能够删除数据。
参考文献:
https://yunlzheng.gitbook.io/prometheus-book/parti-prometheus-ji-chu/quickstart/why-monitor
https://prometheus.io/docs
本文总结了完整的prometheus入门攻略,后续会持续更新,确实有点干~
如果有用,记得三连哦~
关注公众号玩转云原生,后台回复prometheus可获取完整pdf。
