


1. 前言
最近倒腾完了从prometheus联邦集群,到thanos方案的各种踩坑实践,于是抽空整理下这个踩坑过程分享一下。
先讲下背景,本次实践服务器位于台湾,涉及到谷歌云主机、谷歌对象存储、UCloud云主机。
第一阶段:用的prometheus+timesacledb方案。需要安装专门的适配器使prometheus与timesacledb对接。刚开始未考虑到数据压缩的需求,偏偏当时timesacledb不支持压缩,于是timesacledb所在服务器空间时常被塞爆,接入了百来台服务器后,运行了个把月,磁盘空间就多次扩容到了4T,苦timescaledb久矣,于是抛弃timesacledb,进入第二阶段。
第二阶段:使用influxdb代替timescaledb。influxdb挺轻量,prometheus也自带了适配器,比较明显的缺点是官方的高可用方案收费。在用了一段时间后发现了个关于底层的致命缺点,influxdb本身没出现瓶颈,服务器磁盘IO出现了瓶颈。众所周知,目前云商的磁盘基本上是云盘,云盘的IOPS跟吞吐量都不会太高,除非使用SSD,但是价格昂贵。运行了个把月后,因使用的普通云盘,在需要展示较长时间段的监控数据时,磁盘IO爆了,直接导致influxdb挂掉。更换了磁盘类型升级了IO后,还爆,这就让人不能忍受了。于是进入第三阶段。
第三阶段:使用对象存储代替数据库。使用对象存储有个好处,不需要维护influxdb之类的时序数据库,不需要担心什么时候需要扩容,不需要关注底层IO等性能问题,因为对象存储的IO绝对够大(可自行前往各云商官网查阅官方文档)。
Prometheus原生只支持本地文件系统存储,以及tsdb存储,默认使用的promethues内置的tsdb存储在本地。如需使用云商的对象存储则需要借助第三方解决方案,如cortex(更详细的可前往官网浏览https://prometheus.io/docs/operating/integrations/#remote-endpoints-and-storage)。经过对比后,thanos以轻量的架构,无侵入,易扩展的特点俘获了我。
2. thanos架构解析
thanos,一款以go语言开发的开源工具,支持云存储(腾讯、阿里、谷歌、aws等,详情可阅读官方文档https://github.com/thanos-io/thanos/blob/main/docs/storage.md)及本地文件系统存储。架构跟prometheus有些类似,也是由多组件构成,每个组件负责不同的工作。但不同的是thanos的多组件共用一个二进制程序,通过传入不同的参数来启动对应的组件。
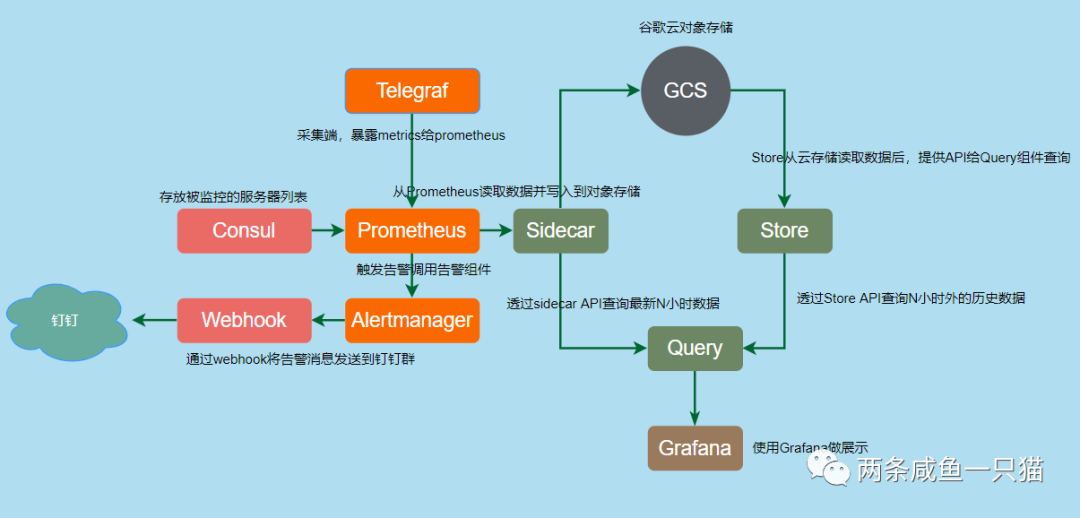
thanos由以下几个组件构成:sidecar、store、query、compactor、receiver、ruler。以下对各组件的作用做个简单描述:
sidecar:跟随prometheus节点部署,读取prometheus的本地数据并写入到对象存储,同时暴露一个API给query组件,用以查询本地数据。需要注意的是sidecar不实时将prometheus的数据写入对象存储,最近的N小时(取决启动参数的设定)数据只在prometheus本地,N小时后的才开始写入对象存储。
store:缓存对象存储的基本信息,从云存储读取数据并提供接口给query组件。因为可能要从对象存储加载大量历史数据,因此部署该组件的服务器带宽应尽可能大。
query:查询组件,prometheus v1 API的重新实现,跟prometheus的UI具有基本相当的功能。
compactor:根据官方文档描述,该组件负责数据压缩与降采样,优化查询速度,本文未对该组件进行实践。
receiver:功能与sidecar类似,除了可以将数据写入对象存储以外,还接收来自多个prometheus的写入,并暴露一个API给query组件供查询最新的数据。本文未对该组件进行实践。
3. 实践架构
为了便于理解,绘制了以下架构图,并列出各组件所在服务器。
| 服务器 | 组件 | 备注 |
192.168.1.10 | Prometheus | |
| Alertmanager | ||
| Prometheus-webhook-dingtalk | 让alertmanager对接钉钉webhook,用以下发告警消息 | |
| Consul | 存放被监控服务器的IP信息 | |
| Sidecar | ||
| Query | ||
| 192.168.1.11 | Store | 带宽300M。外网带宽需尽可能大。 |
| GCS | GCS | 谷歌云对象存储 |
注:由于本文服务器使用的UCloud机器,对象存储用的谷歌云,Store需走公网跟对象存储交互,所以Store的公网带宽需尽可能大,如果机器跟对象存储用同一家云商,可以走内网。
4. 部署
4.1 Alertmanager部署
部署过程
wget https://github.com/prometheus/alertmanager/releases/download/v0.21.0/alertmanager-0.21.0.linux-amd64.tar.gztar -zxvf alertmanager-0.21.0.linux-amd64.tar.gzmv alertmanager-0.21.0.linux-amd64 /opt/alertmanagerln -s /opt/alertmanager/alertmanager-0.21.0.linux-amd64 /usr/local/alertmanagerrm /data/src/* -rfmv /usr/local/alertmanager/alertmanager.yml /data/configs/alertmanagerecho 'PATH=$PATH:/usr/local/alertmanager' >> /etc/profilesource /etc/profile
/data/configs/alertmanager/alertmanger.yml
global:resolve_timeout: 5mroute:group_by: ['project']group_wait: 10sgroup_interval: 10srepeat_interval: 15mreceiver: 'platform'routes:- receiver: 'channel-dingtalk'continue: truematch_re:project: testreceivers:- name: 'channel-dingtalk'webhook_configs:- url: 'http://127.0.0.1:8060/dingtalk/platform/send'inhibit_rules:- source_match:severity: 'critical'target_match:severity: 'warning'equal: []
启动服务
nohup alertmanager --config.file=/data/configs/alertmanager/alertmanager.yml \--storage.path=/data/alertmanager \--web.external-url=http://192.168.1.10:9093 > /tmp/alertmanager.log 2>&1
alertmanager对用户提供了简易的WebUI,可进行一些维护时间设置之类的简易操作,可通过9093端口访问。如:http://192.168.1.10:9093
4.2 Consul部署
安装过程
wget https://releases.hashicorp.com/consul/1.7.1/consul_1.7.1_linux_amd64.zipunzip consul_1.7.1_linux_amd64.zipmkdir -p /opt/consul/consul-1.7.1mv consul /opt/consul/consul-1.7.1ln -s /opt/consul/consul-1.7.1 /usr/local/consulecho 'PATH=$PATH:/usr/local/consul' >> /etc/profilesource /etc/profile
启动单节点服务
nohup consul agent -server \-bootstrap-expect=1 \-data-dir=/data/consul \-node=192.168.1.10 \-bind=192.168.1.10 \-client=0.0.0.0 \-datacenter=tw \-ui > /tmp/consul.log 2>&1
consul提供了一个WebUI,可通过8500端口访问。如:http://192.168.1.10:8500
4.3 prometheus部署
以下为安装过程
wget https://github.com/prometheus/prometheus/releases/download/v2.25.0/prometheus-2.25.0.linux-amd64.tar.gztar -zxvf prometheus-2.25.0.linux-amd64.tar.gzmkdir -p /opt/prometheusmv prometheus-2.25.0.linux-amd64 /opt/prometheus/rm /data/src/* -rfln -s /opt/prometheus/prometheus-2.25.0.linux-amd64 /usr/local/prometheusmv /usr/local/prometheus/prometheus.yml /data/configs/prometheusecho 'PATH=$PATH:/usr/local/prometheus' >> /etc/profilesource /etc/profile
/data/configs/prometheus/prometheus.yml
global:scrape_interval: 15sevaluation_interval: 15sexternal_labels:region: 'tw'alerting:alertmanagers:- static_configs:- targets:- localhost:9093rule_files:- /data/configs/prometheus/rules/*.yamlscrape_configs:- job_name: 'telegraf'scrape_interval: 5mmetrics_path: /metricsconsul_sd_configs:- server: 'localhost:8500'services: ['hostlist']relabel_configs:- source_labels: [__meta_consul_service_address]target_label: instance- regex: __meta_consul_service_metadata_label_(.+)action: labelmap- source_labels: [__meta_consul_service_address,__meta_consul_service_metadata_telegraf]separator: ':'target_label: __address__
启动服务
nohup prometheus --web.listen-address="0.0.0.0:9090" \--storage.tsdb.max-block-duration=2h \--storage.tsdb.min-block-duration=2h \--storage.tsdb.retention.time=2h \--storage.tsdb.path=/data/prometheus-data \--web.enable-lifecycle \--web.enable-admin-api \--web.external-url=http://192.168.1.10:9090 \--config.file=/data/configs/prometheus/prometheus.yml > /tmp/prometheus.log 2>&1
在/data/configs/prometheus创建rules目录,配置响应的告警规则即可。本问展开描述。
Prometheus对用户提供了个具有简易功能的WebUI,可通过9090端口访问,如http://192.168.1.10:9090
4.4 Prometheus-webhook-dingtalk部署
安装过程
wget https://github.com/timonwong/prometheus-webhook-dingtalk/releases/download/v1.4.0/prometheus-webhook-dingtalk-1.4.0.linux-amd64.tar.gztar -zxvf prometheus-webhook-dingtalk-1.4.0.linux-amd64.tar.gzmv prometheus-webhook-dingtalk-1.4.0.linux-amd64 /opt/prometheus-webhook-dingtalkln -s /opt/prometheus-webhook-dingtalk/prometheus-webhook-dingtalk-1.4.0.linux-amd64 /usr/local/prometheus-webhook-dingtalkrm /data/src/* -rfcp /usr/local/prometheus-webhook-dingtalk/config.example.yml /data/configs/prometheus-webhook-dingtalk/config.ymlcp -av /usr/local/prometheus-webhook-dingtalk/contrib/templates/legacy/template.tmpl /data/configs/prometheus-webhook-dingtalk/templatesecho 'PATH=$PATH:/usr/local/prometheus-webhook-dingtalk' >> /etc/profilesource /etc/profile
/data/configs/prometheus-webhook-dingtalk/config.yml
timeout: 5stemplates:- /data/configs/prometheus-webhook-dingtalk/templates/template.tmpltargets:channel-dingtalk:url: https://oapi.dingtalk.com/robot/send?access_token=xxxxxxsecret: SECxxxxxxxxmessage:title: '{{ template "default.title" . }}'text: '{{ template "default.content" . }}'
启动服务
nohup prometheus-webhook-dingtalk --web.enable-ui \--config.file=/data/configs/prometheus-webhook-dingtalk/config.yml \--web.enable-lifecycle > /tmp/webhook.log 2>&1
prometheus-webhook-dingtalk为用户提供了个建议的WebUI,可通过8060端口访问,如 http://192.168.1.10:8060
4.5 thanos安装
thanos直接下载二进制包,传入对应的参数即可启动相关组件
wget https://github.com/thanos-io/thanos/releases/download/v0.18.0/thanos-0.18.0.linux-amd64.tar.gztar -zxvf thanos-0.18.0.linux-amd64.tar.gzmkdir -p /opt/thanosmv thanos-0.18.0.linux-amd64 /opt/thanos/ln -s /opt/thanos/thanos-0.18.0.linux-amd64 /usr/local/thanosrm /data/src/* -rfecho 'PATH=$PATH:/usr/local/thanos' >> /etc/profilesource /etc/profile
提前准备bucket.yml,用以操作对象存储。格式如下,具体的内容根据实际情况替换,这里以谷歌云对象存储为例:
type: GCSconfig:bucket: "xxxxxxx"service_account: |-{"type": "service_account","project_id": "xxxxxxxx","private_key_id": "xxxxxxxx","private_key": "xxxxxxxx","client_email": "xxxxx","client_id": "xxxxxx","auth_uri": "https://accounts.google.com/o/oauth2/auth","token_uri": "https://oauth2.googleapis.com/token","auth_provider_x509_cert_url": "https://www.googleapis.com/oauth2/v1/certs","client_x509_cert_url": "https://www.googleapis.com/robot/v1/metadata/x509/thanos%40gitpods.iam.gserviceaccount.com"}
4.5.1 启动Sidecar
nohup thanos sidecar --tsdb.path /data/prometheus-data \--objstore.config-file /data/configs/thanos/bucket.yaml \--prometheus.url http://127.0.0.1:1000 \--http-address 0.0.0.0:19191 \--grpc-address 0.0.0.0:19090 \--shipper.upload-compacted \--reloader.config-envsubst-file=/data/configs/prometheus/prometheus.yml > /tmp/sidecar.log 2>&1
4.5.2 启动Store组件
nohup thanos store --data-dir /data/thanos-data/store \--objstore.config-file /data/configs/thanos/bucket.yaml \--http-address 0.0.0.0:19191 \--grpc-address 0.0.0.0:19090 > /tmp/store.log 2>&1
4.5.3 启动Query组件
nouhp thanos query --http-address 0.0.0.0:2000 \--store 127.0.0.1:19090 \--store 192.168.1.11:19090 \--query.replica-label=replica > /tmp/query.log 2>&1
query组件需要指定sidecar及store的grpc端口进行通信, http-address设定的端口是为用户提供的WebUI入口,功能类似prometheus的WebUI。
4.8 Telegraf部署
Telegraf安装在被监控机上,用以采集数据,并暴露给prometheus。安装过程如下:
wget https://dl.influxdata.com/telegraf/releases/telegraf-1.17.0_static_linux_amd64.tar.gz; \tar -xvf telegraf-1.17.0_static_linux_amd64.tar.gz; \mv telegraf-1.17.0 /opt/telegraf/; \ln -sf /opt/telegraf/telegraf-1.17.0 /usr/local/telegraf; \rm -rf telegraf-1.17.0_static_linux_amd64.tar.gzecho 'PATH=$PATH:/usr/local/telegraf/usr/bin' >> /etc/profilesource /etc/profile
/data/configs/telegraf/telegraf.conf
#数据采集间隔interval = "10s"round_interval = truemetric_batch_size = 1000metric_buffer_limit = 10000collection_jitter = "0s"flush_interval = "10s"flush_jitter = "0s"precision = ""hostname = "${HOST_M}"omit_hostname = false#指标输出配置,这里配置为Prometheus_client模式,监控指标可通过 http://ip:1020/metrics 查看。[[outputs.prometheus_client]]listen = ":1020"#监控指标采集配置,其他监控指标可参考文档添加[[inputs.cpu]][[inputs.disk]]ignore_fs = ["tmpfs", "devtmpfs", "devfs", "iso9660", "overlay", "aufs", "squashfs"][[inputs.diskio]][[inputs.kernel]][[inputs.mem]][[inputs.processes]][[inputs.swap]][[inputs.system]][[inputs.net]][[inputs.netstat]]
启动服务
nohup /usr/local/telegraf/usr/bin/telegraf --config /data/configs/telegraf/telegraf.conf > /tmp/telegraf.log 2>&1
通过配置文件设定的1020端口,可访问telegraf收集到的数据,如http://192.168.1.10:1020/metrics
至此,整个prometheus+prometheus集群及搭建完毕。
尊重原创,如需转载请联系作者,微信号:opgaozhan 或识别以下二维码

