问题背景
Prometheus在抓取container的CPU/Mem等metric的时候,发现metric上没有带Pod的label,这导致一个问题,无法通过自定义的label查看其下的所有metric资源。
例如下面的一个a-custom-project, 带了一个project: a-custom-project label
apiVersion: v1kind: Podmetadata:labels:project: a-custom-projectname: a-custom-projectspec:containers:image: nginximagePullPolicy: Always
希望project: a-custom-project label过滤出其下的所有metic指标,下面是一个container_cpu_usage_seconds_total的metric
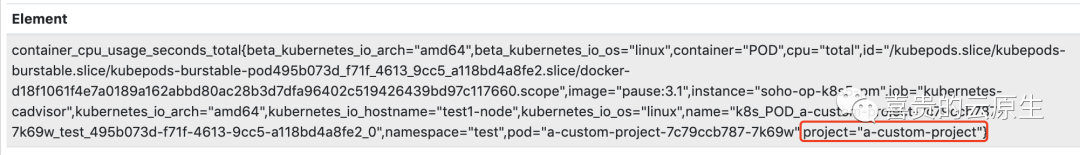
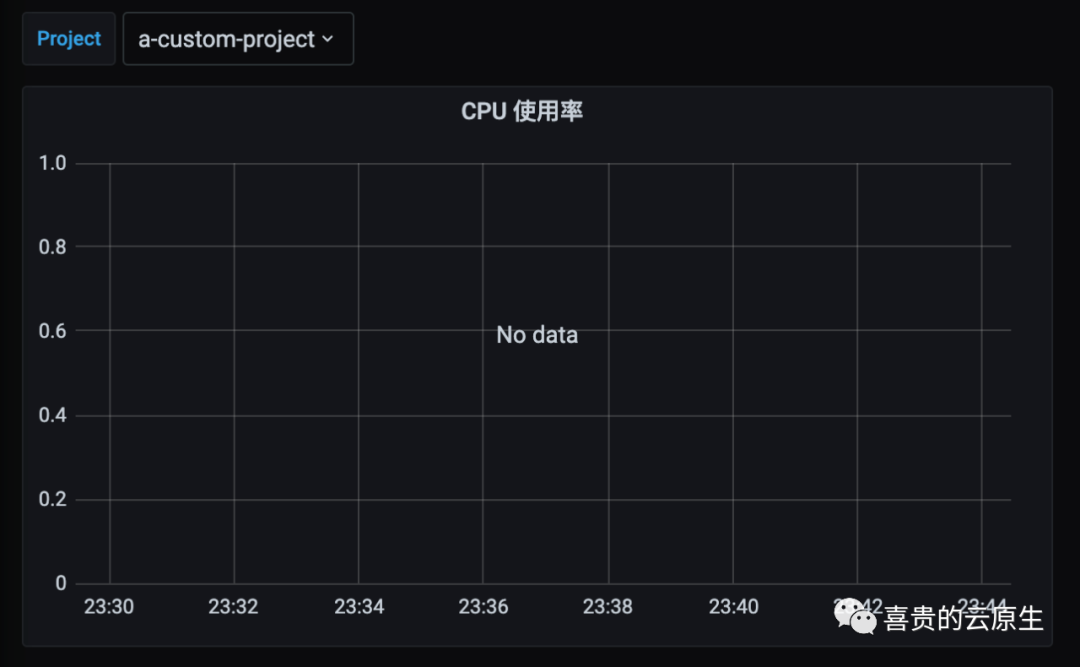
正常情况下是不会出现红色框中的label,因此在grafana上也无法通过下面的方式显示
问题分析
导致此问题的出现主要的原因是kubelet在调用kubeGenericRuntimeManager创建container的时候,过滤掉所有的自定义的label,只添加了固定的几个指标。
kubernetes/pkg/kubelet/kuberuntime/labels.go
// newContainerLabels creates container labels from v1.Container and v1.Pod.func newContainerLabels(container *v1.Container, pod *v1.Pod) map[string]string {labels := map[string]string{}labels[types.KubernetesPodNameLabel] = pod.Namelabels[types.KubernetesPodNamespaceLabel] = pod.Namespacelabels[types.KubernetesPodUIDLabel] = string(pod.UID)labels[types.KubernetesContainerNameLabel] = container.Namereturn labels}
并且kubelet会过滤容器上的label标签,只保留规定的KubernetesPodNameLabel / KubernetesPodNameSpaceLabel / KubernetesContainerNameLabel 等label
kubernetes/pkg/kubelet/server/server.go
func containerPrometheusLabelsFunc(s stats.Provider) metrics.ContainerLabelsFunc {// containerPrometheusLabels maps cAdvisor labels to prometheus labels.return func(c *cadvisorapi.ContainerInfo) map[string]string {// Prometheus requires that all metrics in the same family have the same labels,// so we arrange to supply blank strings for missing labelsvar name, image, podName, namespace, containerName stringif len(c.Aliases) > 0 {name = c.Aliases[0]}image = c.Spec.Imageif v, ok := c.Spec.Labels[kubelettypes.KubernetesPodNameLabel]; ok {podName = v}if v, ok := c.Spec.Labels[kubelettypes.KubernetesPodNamespaceLabel]; ok {namespace = v}if v, ok := c.Spec.Labels[kubelettypes.KubernetesContainerNameLabel]; ok {containerName = v}// Associate pod cgroup with pod so we have an accurate accounting of sandboxif podName == "" && namespace == "" {if pod, found := s.GetPodByCgroupfs(c.Name); found {podName = pod.Namenamespace = pod.Namespace}}set := map[string]string{metrics.LabelID: c.Name,metrics.LabelName: name,metrics.LabelImage: image,"pod": podName,"namespace": namespace,"container": containerName,}return set}}
此问题从2015年,k8s 1.1版本起就在社区开始有反馈,期间也不断有人issues,但是一直没有解决,社区主要考虑的有2点:
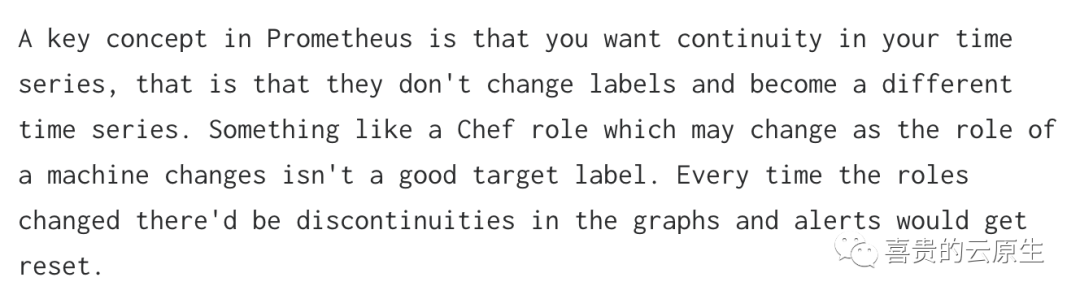
1)label是一个很易变的数据,变化后会导致图标不连续(详见:https://www.robustperception.io/how-to-have-labels-for-machine-roles)
2)过多的label会导致prometheus存储压力的增加,每个label都会创建一个timeseries,详见:https://github.com/kubernetes/kubernetes/issues/79702
references:https://github.com/kubernetes/kubernetes/issues/32326
影响范围
目前只影响cadvisor上指标,所有的container_*指标都存在此问题,例如fs / cpu / mem / net 等等容器指标。
解决方案一:联表聚合(社区方案)
社区的思想是减少容器的label,这块大大减轻prometheus的存储压力,并且认为label应该是恒定,在整个业务的生命周期中应该固定的,并且认为label是个易变,很容易导致业务的图标出现中断:
https://www.robustperception.io/target-labels-are-for-life-not-just-for-christmas https://www.robustperception.io/exposing-the-software-version-to-prometheus https://www.robustperception.io/how-to-have-labels-for-machine-roles
基于上面这个思想,社区提供一个联表聚合的方案,这个方案也是社区提供的唯一方案(详见:https://www.weave.works/blog/aggregating-pod-resource-cpu-memory-usage-arbitrary-labels-prometheus/)
大概的解决思路是:kube_state_metrics exporter提供一个kube_pod_labels的metric,这个metric里面有pod自定义的pod labels,然后和没有自定义label的metric进行联表聚合查询,从而实现了通过自定义label来过滤没有自定义label的metric的能力,由于是联表聚合查询,因此此能力是运行时的。
sum(irate(container_cpu_usage_seconds_total{image!=""}[1m])) by (namespace,pod)* on (namespace, pod) group_left(label_yfd_service)kube_pod_labels{label_yfd_service="tutor-live-subjective-question"}
缓解方案
1)通过sharding方式,但是此方式无法按时间段存储在不同的prometheus,因此这种方式对单个merric来说是无效的。在metric固定的情况下,增加prometheus是可以起到一些缓解作用
2)通过recording rule方式,此方式通过将聚合查询的结果记录为一张新表,可以实现和原生label相同的查询速度,但是此方式对计算和存储的资源消耗很大,但是也可以通过增加prometheus机器来缓解。配置成本高
解决方案二:修改kubelet源码方案
在社区有人提出通过白名单的给cadvisor添加label,但是社区没有下文(详见:https://github.com/google/cadvisor/issues/2380)。在社区搜了一下有很多人都在提这个问题,最近还有一个人提了PR,但是被拒绝了(详见:https://github.com/kubernetes/kubernetes/pull/95210)。
Demo实现:直接通过硬编码 project 关键字 label,检查此 label 并将其传递到container 的 label 上。kubelet 暴露给 prometheus 的接口处也添加了一个检查,会将此 label 加入到返回的 set 集中,从而实现 promethues 能获取到pod 的 label。
更优方案:通过设置一个白名单列表,通过命令参数传入,这样既可以避免过多的 label 影响prometheus的存储,也可以实现灵活的 label 配置。
kubernetes/pkg/kubelet/kuberuntime/labels.go
// newContainerLabels creates container labels from v1.Container and v1.Pod.func newContainerLabels(container *v1.Container, pod *v1.Pod) map[string]string {labels := map[string]string{}labels[types.KubernetesPodNameLabel] = pod.Namelabels[types.KubernetesPodNamespaceLabel] = pod.Namespacelabels[types.KubernetesPodUIDLabel] = string(pod.UID)labels[types.KubernetesContainerNameLabel] = container.Name// patch by zhaixiguifor labelName ,_ := range pod.ObjectMeta.GetLabels() {if labelName == "project" {labels[labelName] = pod.ObjectMeta.Labels[labelName]}}return labels
kubernetes/pkg/kubelet/server/server.go
func containerPrometheusLabelsFunc(s stats.Provider) metrics.ContainerLabelsFunc {// containerPrometheusLabels maps cAdvisor labels to prometheus labels.return func(c *cadvisorapi.ContainerInfo) map[string]string {// Prometheus requires that all metrics in the same family have the same labels,// so we arrange to supply blank strings for missing labelsvar name, image, podName, namespace, containerName stringif len(c.Aliases) > 0 {name = c.Aliases[0]}image = c.Spec.Imageif v, ok := c.Spec.Labels[kubelettypes.KubernetesPodNameLabel]; ok {podName = v}if v, ok := c.Spec.Labels[kubelettypes.KubernetesPodNamespaceLabel]; ok {namespace = v}if v, ok := c.Spec.Labels[kubelettypes.KubernetesContainerNameLabel]; ok {containerName = v}// Associate pod cgroup with pod so we have an accurate accounting of sandboxif podName == "" && namespace == "" {if pod, found := s.GetPodByCgroupfs(c.Name); found {podName = pod.Namenamespace = pod.Namespace}}set := map[string]string{metrics.LabelID: c.Name,metrics.LabelName: name,metrics.LabelImage: image,"pod": podName,"namespace": namespace,"container": containerName,}// patch by xiguifor labelName,labelValue := range c.Spec.Labels {if labelName == "project" {set[labelName] = labelValue}}return set}}
阿里云 - 大数据
解决方案三:阿里云 - 大数据
阿里云将 Promsql 查询时间小于2秒的用社区的 kube_pod_label 联表聚合的方案,而大于2秒的查询用大数据平台处理(类似Hbase),有大数据平台保证查询的响应时间。
独立安装cadvisor
解决方案三:独立安装cAdvisor
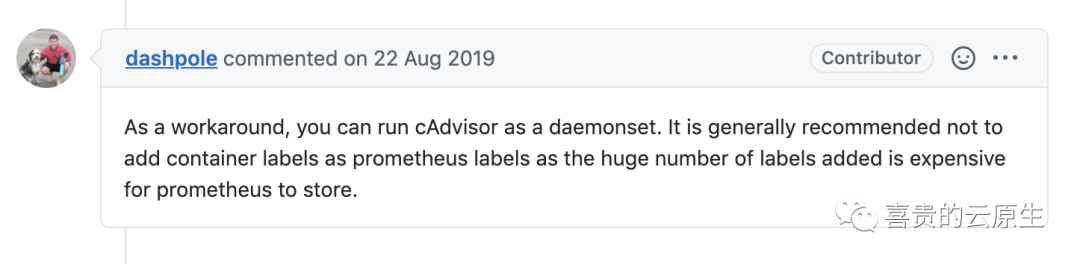
社区有 member 想将 cAdvisor 独立出来,为了解决 kubelet 的性能问题,但是最后也不了了之。(详解:https://github.com/kubernetes/kubernetes/issues/18770)。
另外有一个人将 cAdvisor 的部分统计信息放到了CRI里,试图将 kubelet 和 cadvisor 分离,但是此PR并不是解决 Pod 的 label 传递到 container 上的问题(详见:https://github.com/kubernetes/kubernetes/pull/45614),此方案没有最终的实现。
性能测试
prometheus查询container_cpu_usage_seconds_total metric,实例数5个,最大查询时间2天
1)联表查询(单位:毫秒)
sum(irate(container_cpu_usage_seconds_total{image!=""}[1m])) by (namespace,pod)* on (namespace, pod) group_left(label_yfd_service)kube_pod_labels{label_yfd_service="tutor-live-subjective-question"}
1h: 311, 396, 367, 365, 288
sum(irate(container_cpu_usage_seconds_total{image!="", yfd_service="tutor-live-subjective-question"}[1m])) by (namespace,pod)
对比:通过直接过滤label和kube_pod_labels连表查询的返回响应
方案对比
| 修改源码 | 联表聚合 | 大数据 | |
| 优点 | 简单,性能高 | 简单,符合社区方向 | 在不改源码的情况,解决了「联表聚合」性能问题 |
| 缺点 | 修改了kubelet源码 | 响应时间很慢,数据量大了很难处理 | 需要一个大数据平台,对维护和成本来说都是巨大的挑战 |
| 响应时间 | 快 | 很慢 | 中 |
| 架构复杂性 | 简单 | 简单 | 非常复杂 |
| 开发成本 | 低 | 无 | 高 |
| 资源要求 | 低 | 低 | 高 |
| 符合社区方向 | 不符合 | 符合 | - |
| 稳定性 | 高 | 高 | 低 |
大厂经验
| 公司 | 规模 | 选用方案 | 说明 |