在之前的文章
《spring-boot-actuator源码解析(上)【基于SB 2.X版本的实战】》
《spring-boot-actuator源码解析(中)【micrometer极大值BUG及源码层面优化Actuator内存溢出】》
《spring-boot-actuator 2.X源码解析(下)【Info藏地密码独家实战解密】》
中,我们已经搭建了基于SpringBoot 2.X的微服务并集成了Prometheus监控,本节我们补一下告警的实战内容。
Prometheus的配置准备工作
在之前的文章中,我们使用如下命令启动Prometheus
./prometheus --config.file=prometheus.yml
但是配置监控告警以后,我们最好启用如下命令来启动Prometheus,这样可以让Prometheus支持通过web端点动态更新配置
./prometheus --config.file=prometheus.yml --web.enable-lifecycle
我的MAC电脑Prometheus本地端口是9090,如下命令在开启web端点动态更新配置以后,可以动态更新Prometheus配置
curl -X POST http://localhost:9090/-/reload
可以通过Prometheus->Status的Configuration和Rules确认配置和告警设置生效。
如果启动Prometheus的时候发现如下问题,
level=error ts=2019-09-25T15:01:51.452103Z caller=main.go:717 err="error starting web server: listen tcp 0.0.0.0:9090: bind: address already in use"
这时的解决方式是,Mac查看并关闭某端口占用的方式,查看进程占用
lsof -i tcp:9090
该命令会显示占用9090端口的进程,有其 pid ,可以通过pid关掉该进程,杀死进程
sudo kill -9 pid
AlertManager.yml配置
alertmanager.yml配置文件,默认是不存在的,需要新建。这个文件主要是设置报警方式的,比如邮件、钉钉(webhook)、微信、pagerduty等方式。
钉钉接入方式需要使用Go语言编写或者采用开源的prometheus-webhook-dingtalk
email_config
hipchat_config
pagerduty_config
pushover_config
slack_config
opsgenie_config
victorops_config
我是126的邮箱,就用126邮箱来举这个例子
fatal: The remote end hung up unexpectedly
global:
  resolve_timeout: 5m

  smtp_smarthost: 'smtp.126.com:25'  # 邮箱smtp服务器代理
  smtp_from: '******@126.com' # 发送邮箱名称
  smtp_auth_username: '******@126.com' # 邮箱名称
  smtp_auth_password: '******' # 邮箱密码或授权码

route:
  group_by: ['alertname']
  group_wait: 10s
  group_interval: 10s
  repeat_interval: 1h
  receiver: 'mail-receiver'
receivers:
- name: 'mail-receiver'
  email_configs:
  - to: '******@126.com'
inhibit_rules:
  - source_match:
      severity: 'critical'
    target_match:
      severity: 'warning'
    equal: ['alertname', 'dev', 'instance']
然后使用如下命令启动alertmanager
./alertmanager --config.file=alertmanager.yml
Prometheus报警规则配置
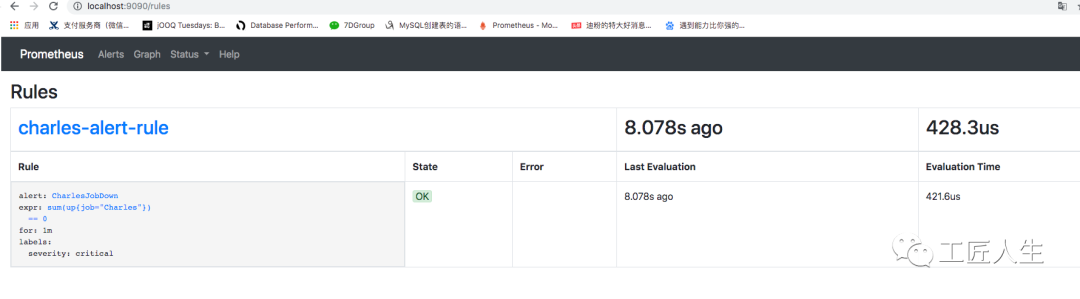
在Prometheus软件目录下新建rule.yml文件,该文件用于监控我们的微服务系统Charles是否存活
groups:
- name: charles-alert-rule
  rules:
  - alert: CharlesJobDown
    expr: sum(up{job="Charles"}) == 0
    for: 1m
    labels:
      severity: critical
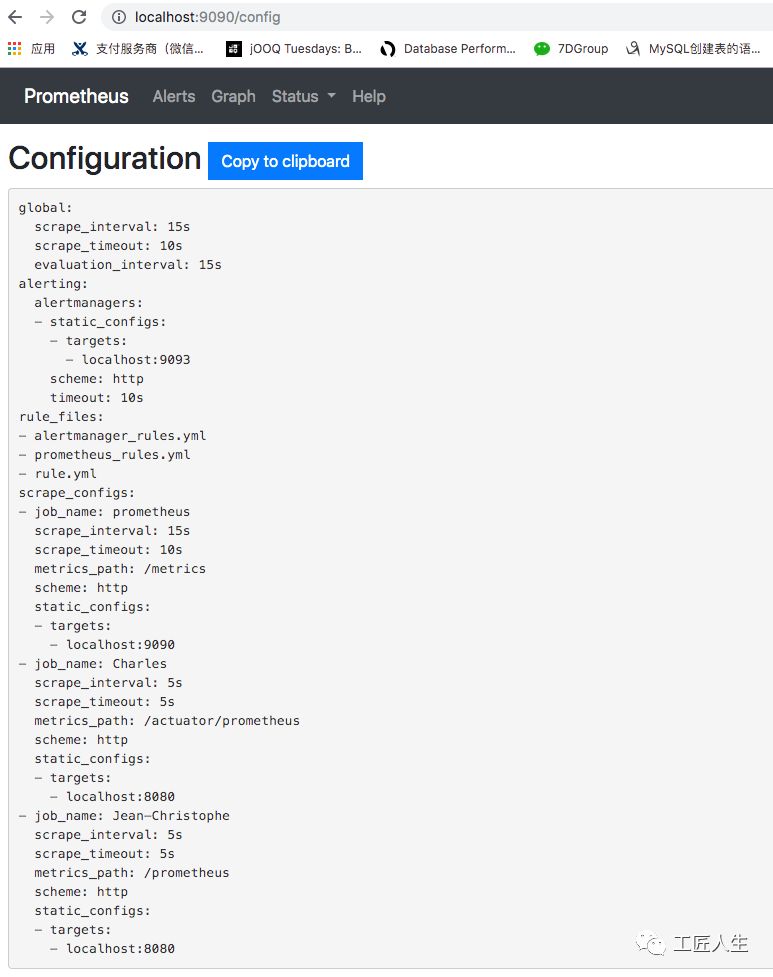
prometheus.yml文件调整如下,主要是增加alertmanagers的9093端口以及刚才配置的rule.yml文件:
# my global config
global:
  scrape_interval:     15s # Set the scrape interval to every 15 seconds. Default is every 1 minute.
  evaluation_interval: 15s # Evaluate rules every 15 seconds. The default is every 1 minute.
  # scrape_timeout is set to the global default (10s).

# Alertmanager configuration
alerting:
  alertmanagers:
  - static_configs:
    - targets:
       - localhost:9093

# Load rules once and periodically evaluate them according to the global 'evaluation_interval'.
rule_files:
  - "alertmanager_rules.yml"
  - "prometheus_rules.yml"
  - "rule.yml"
  # - "first_rules.yml"
  # - "second_rules.yml"

# A scrape configuration containing exactly one endpoint to scrape:
# Here it's Prometheus itself.
scrape_configs:
  # The job name is added as a label `job=<job_name>` to any timeseries scraped from this config.

  - job_name: 'prometheus'

    # metrics_path defaults to '/metrics'
    # scheme defaults to 'http'.

    static_configs:
    - targets: ['localhost:9090']


  - job_name: 'Charles'
    scrape_interval: 5s
    metrics_path: '/actuator/prometheus'
    static_configs:
    - targets: ['localhost:8080']

  - job_name: 'Jean-Christophe'
    scrape_interval: 5s
    metrics_path: '/prometheus'
    static_configs:
    - targets: ['localhost:8080']
如果之前没有启动Prometheus可以使用如下命令启动
./prometheus --config.file=prometheus.yml --web.enable-lifecycle
如果启动过,可以使用如下命令启动
curl -X POST http://localhost:9090/-/reload
可视化检查
配置完Prometheus以后,可以访问如下页面确认配置结果
http://localhost:9090/graph
Status->Configuration检查prometheus.yml的大致配置内容
Status->Rules检查刚才配置的报警信息rule.yml
测试邮件告警功能
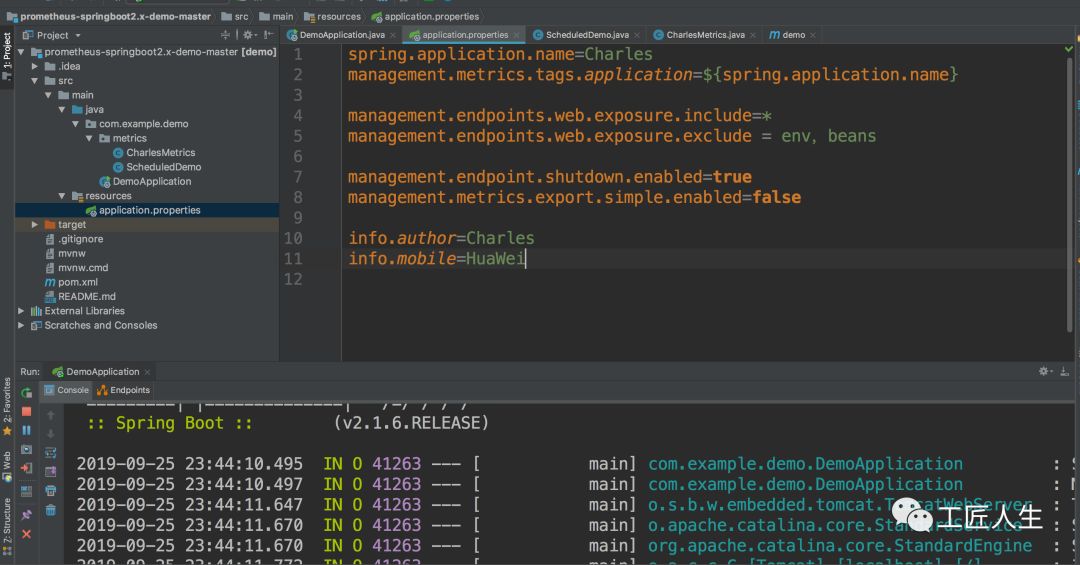
第一步、启动微服务
第二步、验证Prometheus
访问如下Prometheus页面可以看到告警信息已经录入
http://localhost:9090/alerts
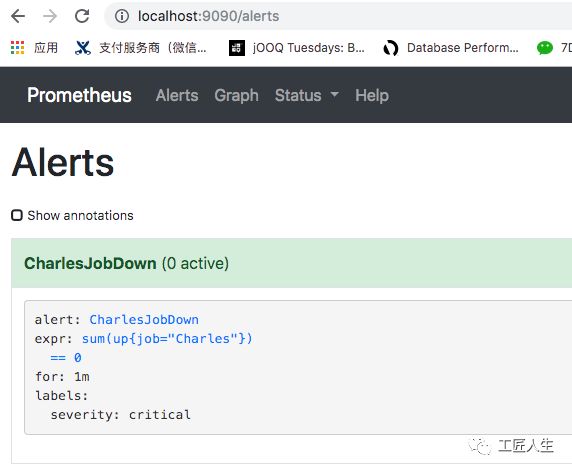
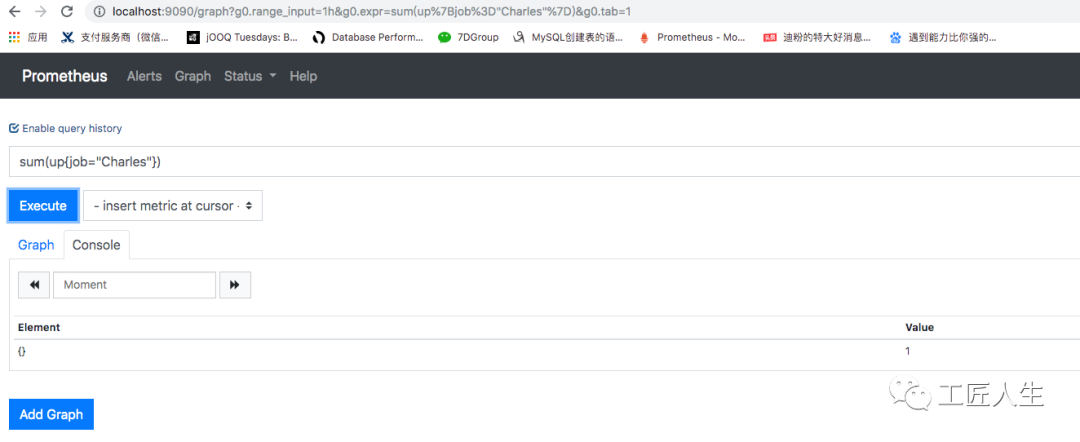
由于微服务是启动状态,在localhost:9090页面查询 sum(up{job="Charles"})结果是1
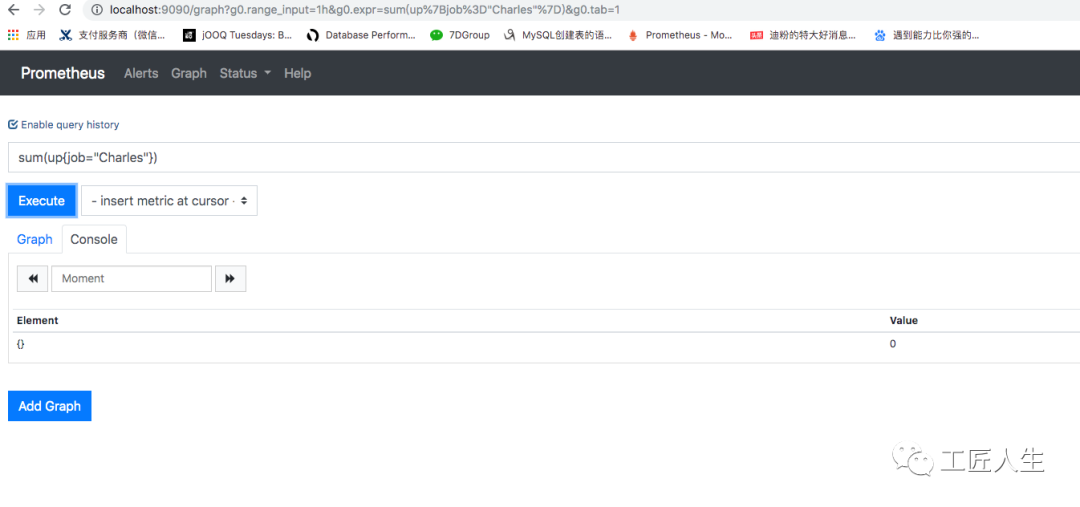
第三步、关闭微服务
关闭微服务以后,sum(up{job="Charles"})的值立马变为0
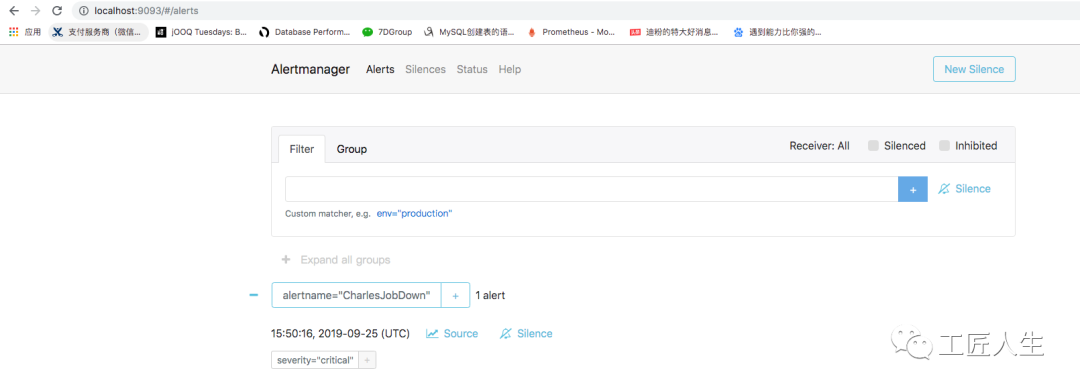
此时 http://localhost:9090/alerts 值变为 PENDING状态
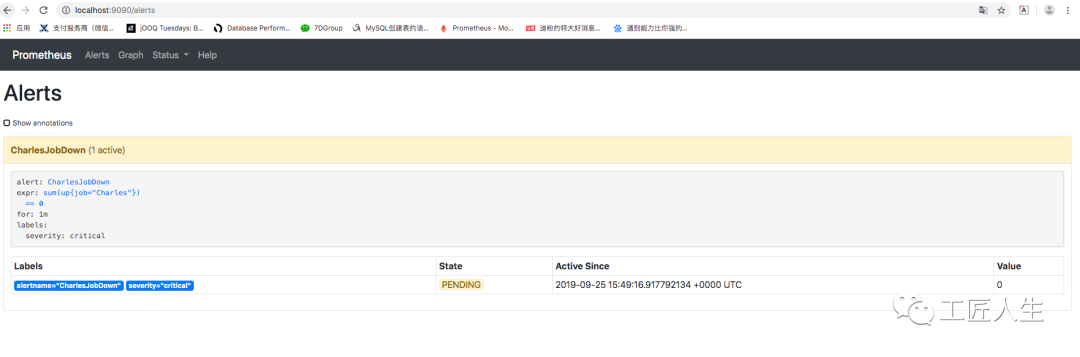
过一段时间刷新变成 FIRING状态
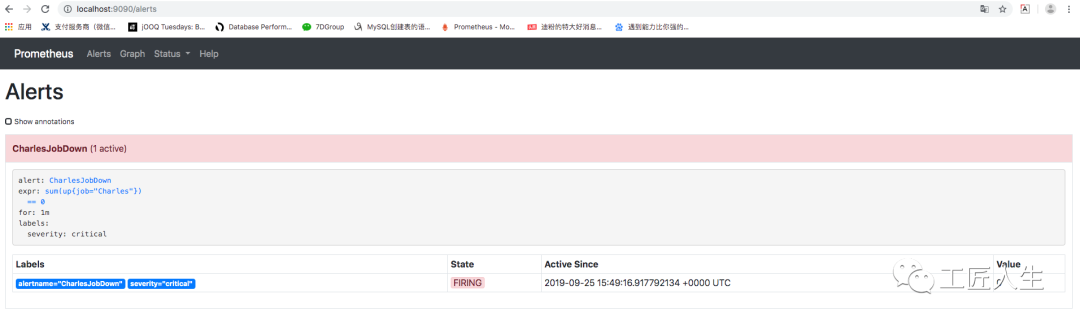
此时,我的邮箱也收到了邮件告警

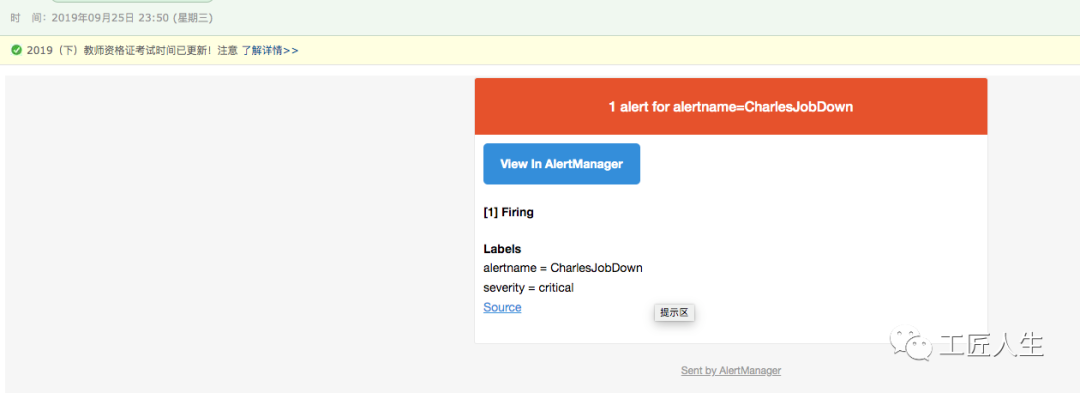
需要解释一下的是:
告警信息生命周期的3种状态
inactive:表示当前报警信息即不是firing状态也不是pending状态
pending:表示在设置的阈值时间范围内被激活的
firing:表示超过设置的阈值时间被激活的
绿色表示正常,红色状态为 PENDING表示alerts 还没有发送至 Alertmanager,PENDING 变为 FIRING,此时,prometheus才将告警发给alertmanager。
prometheus触发一条告警的过程:
prometheus--->触发阈值--->超出持续时间--->alertmanager--->分组|抑制|静默--->媒体类型--->邮件|钉钉|微信等。
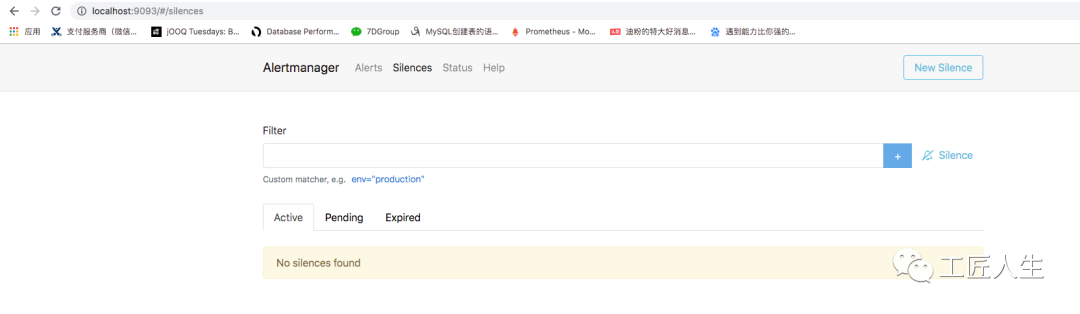
当然,在AlertManager页面
http://localhost:9093/#/silences
我们也可以看到很多Prometheus的这些告警数据:
后续文章计划
介绍完邮件的告警,后面我们会继续围绕如下几个方面继续介绍Prometheus
从分组(group)、抑制(inhibition)、静默(silences)谈Prometheus智能化报警流程避免邮件轰炸
Prometheus一条告警是怎么触发的
Prometheus如何接入钉钉告警
欢迎购买扫码购买我的新书:
欢迎加入我的知识星球,一起探讨架构,交流源码。加入方式,长按下方二维码噢: