


(一)环境准备:
1. CentOS7.x(下载地址:http://mirrors.cqu.edu.cn/CentOS/7/isos/x86_64/CentOS-7-x86_64-DVD-1708.iso)
2. Prometheus2.0.0(下载地址:https://github.com/prometheus/prometheus/releases/download/v2.0.0/prometheus-2.0.0.linux-amd64.tar.gz)
3. Node_exporter0.15.2(监控Linux系统指标)(下载地址: https://github.com/prometheus/node_exporter/releases/download/v0.15.2/node_exporter-0.15.2.linux-amd64.tar.gz)
(二)安装步骤:
VmWare虚拟机安装CentOS系统(参考链接:http://www.linuxidc.com/Linux/2014-10/108013.htm):
关闭CentOS防火墙:
systemctl disable firewalld.service
安装Prometheus:
1>.解压:tar -xvf prometheus-2.0.0.linux-amd64.tar.gz
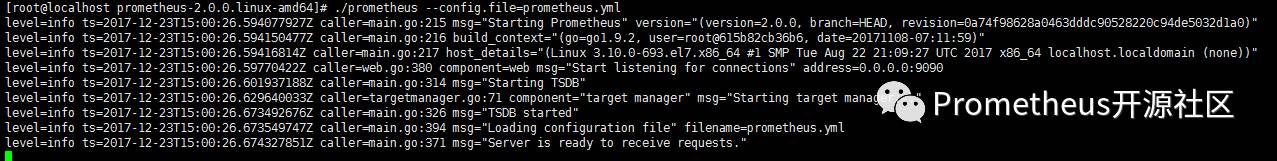
2>.启动Prometheus:
(1)cd prometheus-2.0.0.linux-amd64
(2)./prometheus -- config.file=prometheus.yml
如果有如下字样,说明已经启动成功。
安装node_exporter:
1>.解压:tar -xvf node_exporter-0.15.2.linux-amd64.tar.gz
2>.启动node_exporter:
(1)cd node_exporter-0.15.2.linux-amd64
(2)./node_exporter
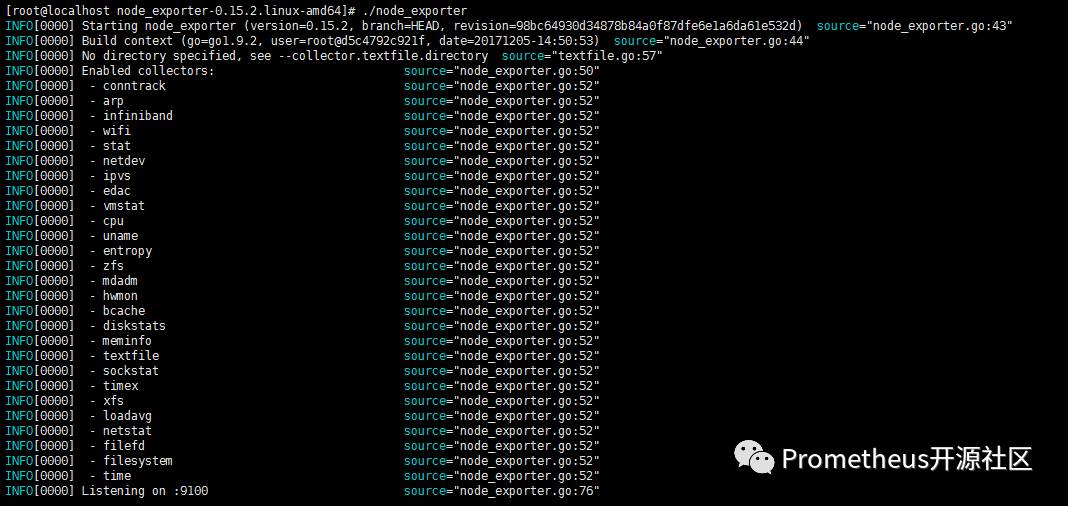
如果看见以上显示说明启动成功。
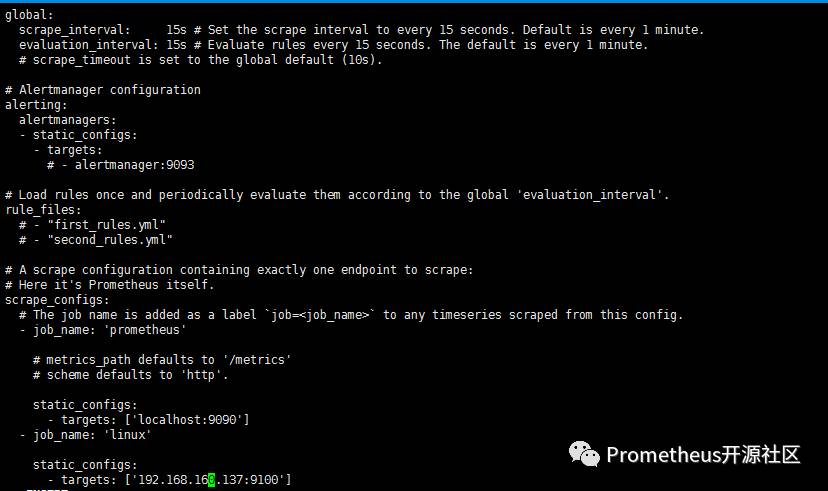
更改prometheus.yml配置文件如下来实现增加对Linux系统监控的功能:
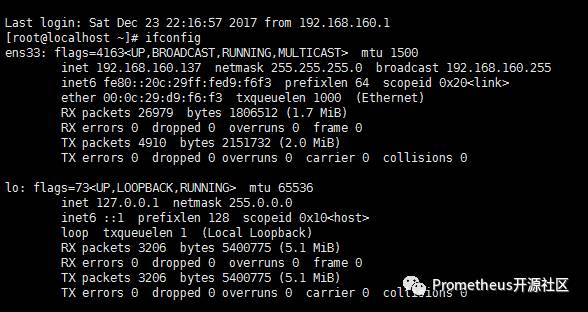
查看虚拟机ip地址:ifconfig
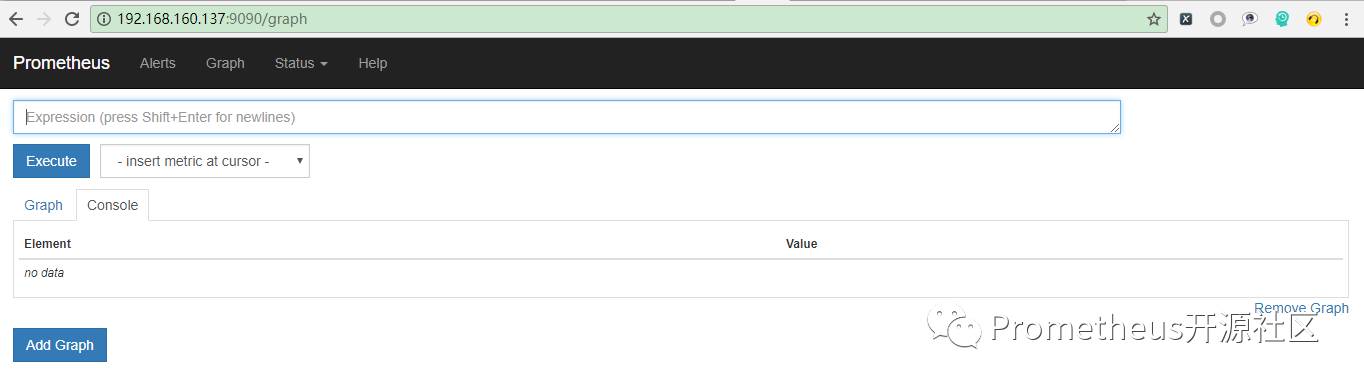
在浏览器输入http://192.168.160.137:9090打开prometheus页面:

点击Status---->点击Targets:

如果发现页面上的两个State都是UP,则证明已经处于监控状态(数据默认15s采集一次)。
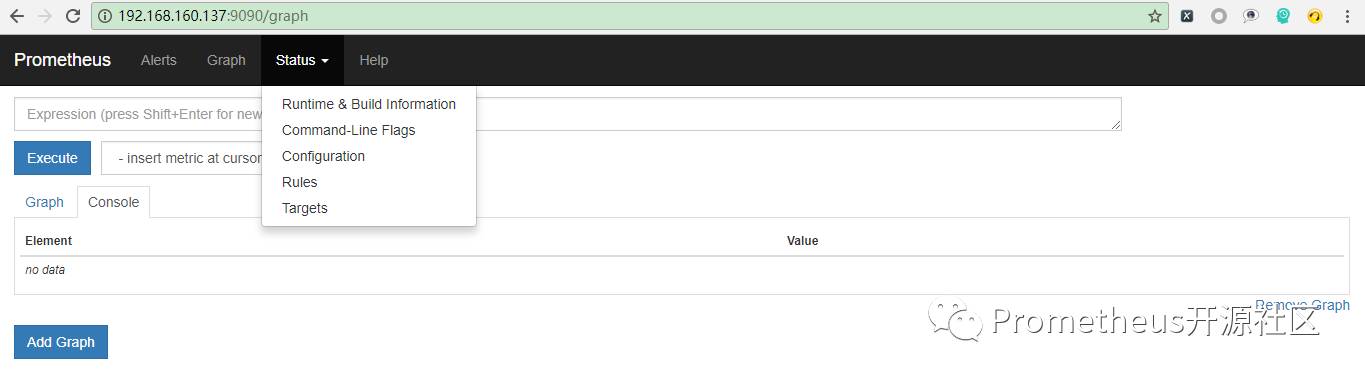
单击Prometheus进入各个指标的选择页面如下图:
单击Execute右边的下拉三角选择想要查看的指标(以查看请求总数为例):
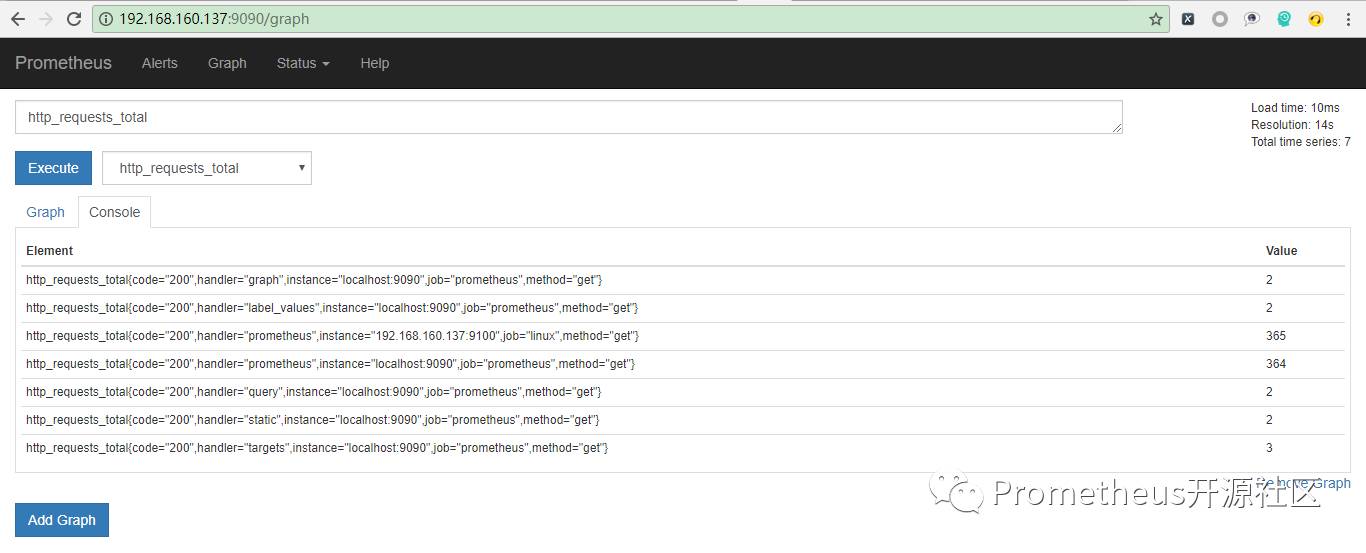
这里我们就可以看到http_requests_total指标的详细信息。其他指标也可以用此方法进行查询。
