


背景介绍: 以Spring boot 2.0.5, Spring cloud Finchley.RC2 版本为基础,构建笔记,全套系列已基本完成,示例代码,根据过程走完,是可执行的,计划每天更新一条,欢迎大家持续关注。
学习过程,主要参考 周立大神 的 《Spring Cloud 与Docker 微服务架构实战》 一书,同时参考其他博文,如有侵权,请联系我删除。本系列博文内容开源,但转载请注明 出处.
actuator2.*版本的介绍: 官方github地址:
https://github.com/spring-projects/spring-boot/tree/master/spring-boot-project/spring-boot-actuator
Spring Boot Actuator包含许多其他功能,可帮助您在应用程序投入生产时监控和管理它们。 您可以选择使用HTTP或JMX端点管理和监视应用程序。 审计,运行状况和指标收集可以自动应用于您的应用程序。
几个要点:
Endpoints
执行器端点(endpoints)可用于监控应用及与应用进行交互,Spring Boot包含很多内置的端点,你也可以添加自己的。例如,health端点提供了应用的基本健康信息。 每个端点都可以启用或禁用。这控制着端点是否被创建,并且它的bean是否存在于应用程序上下文中。要远程访问端点,还必须通过JMX或HTTP进行暴露,大部分应用选择HTTP,端点的ID映射到一个带/actuator前缀的URL。例如,health端点默认映射到/actuator/health。
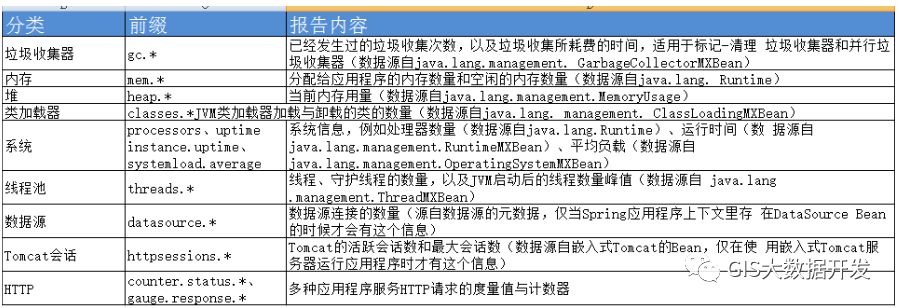
Metrics 查看应用的度量值
audit 审计
actuator 提供了一个灵活的审计框架,通过发布事件到AuditEventRepository。一旦Spring Security处于运行状态,它会默认自动发布身份验证事件。 这对于报告非常有用,并且还可以基于身份验证失败实施锁定策略。
应用actuator: 在pom.xml中添加依赖:
        <dependency>
	    <groupId>org.springframework.boot</groupId>
	    <artifactId>spring-boot-starter-actuator</artifactId>
	</dependency>
随后启动服务,访问:
http://127.0.0.1:8000/actuator
可看到结果:
{"_links":{"self":{"href":"http://127.0.0.1:8000/actuator","templated":false},"auditevents":{"href":"http://127.0.0.1:8000/actuator/auditevents","templated":false},"beans":{"href":"http://127.0.0.1:8000/actuator/beans","templated":false},"health":{"href":"http://127.0.0.1:8000/actuator/health","templated":false},"conditions":{"href":"http://127.0.0.1:8000/actuator/conditions","templated":false},"configprops":{"href":"http://127.0.0.1:8000/actuator/configprops","templated":false},"env":{"href":"http://127.0.0.1:8000/actuator/env","templated":false},"env-toMatch":{"href":"http://127.0.0.1:8000/actuator/env/{toMatch}","templated":true},"info":{"href":"http://127.0.0.1:8000/actuator/info","templated":false},"loggers":{"href":"http://127.0.0.1:8000/actuator/loggers","templated":false},"loggers-name":{"href":"http://127.0.0.1:8000/actuator/loggers/{name}","templated":true},"heapdump":{"href":"http://127.0.0.1:8000/actuator/heapdump","templated":false},"threaddump":{"href":"http://127.0.0.1:8000/actuator/threaddump","templated":false},"metrics":{"href":"http://127.0.0.1:8000/actuator/metrics","templated":false},"metrics-requiredMetricName":{"href":"http://127.0.0.1:8000/actuator/metrics/{requiredMetricName}","templated":true},"scheduledtasks":{"href":"http://127.0.0.1:8000/actuator/scheduledtasks","templated":false},"httptrace":{"href":"http://127.0.0.1:8000/actuator/httptrace","templated":false},"mappings":{"href":"http://127.0.0.1:8000/actuator/mappings","templated":false}}}
注意:
Spring Boot 2.0 的Actuator只暴露health和info 可在
application.properties
加入
management.endpoints.web.exposure.include=*
即可 暴露出其他节点。
