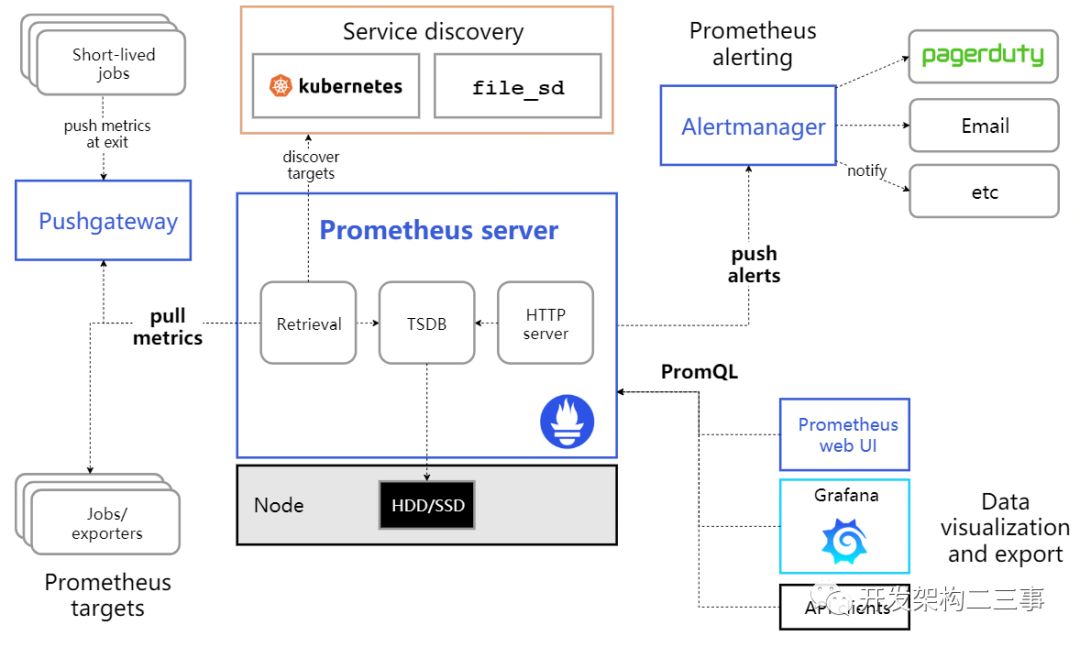
本文将使用prometheus及Grafana搭建一套监控系统来监控主机springboot应用及数据库(MySQL、Redis)
安装grafana可视化面板
Grafana是一个可视化面板(Dashboard),有着非常漂亮的图表和布局展示,功能齐全的度量仪表盘和图形编辑器,支持Graphite、zabbix、InfluxDB、Prometheus等数据源。
下载地址:https://grafana.com/grafana/download
本文主要介绍linux版本:
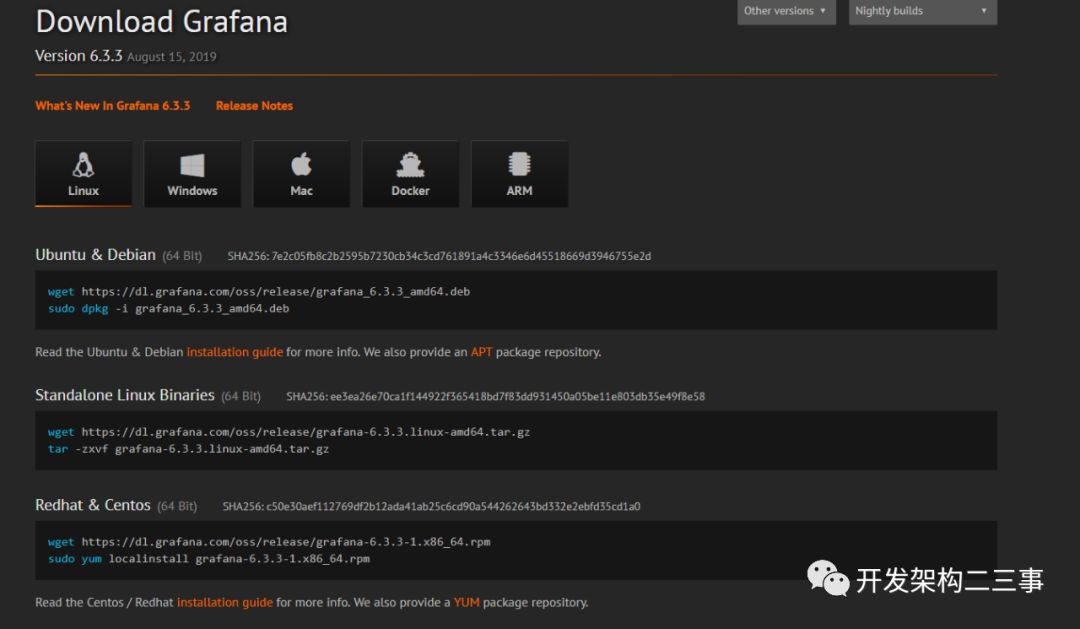
centos下安装命令为:
wget https://dl.grafana.com/oss/release/grafana-6.3.3-1.x86_64.rpm
sudo yum localinstall grafana-6.3.3-1.x86_64.rpm
配置
安装完成后,配置文件位于/etc/grafana/grafana.ini
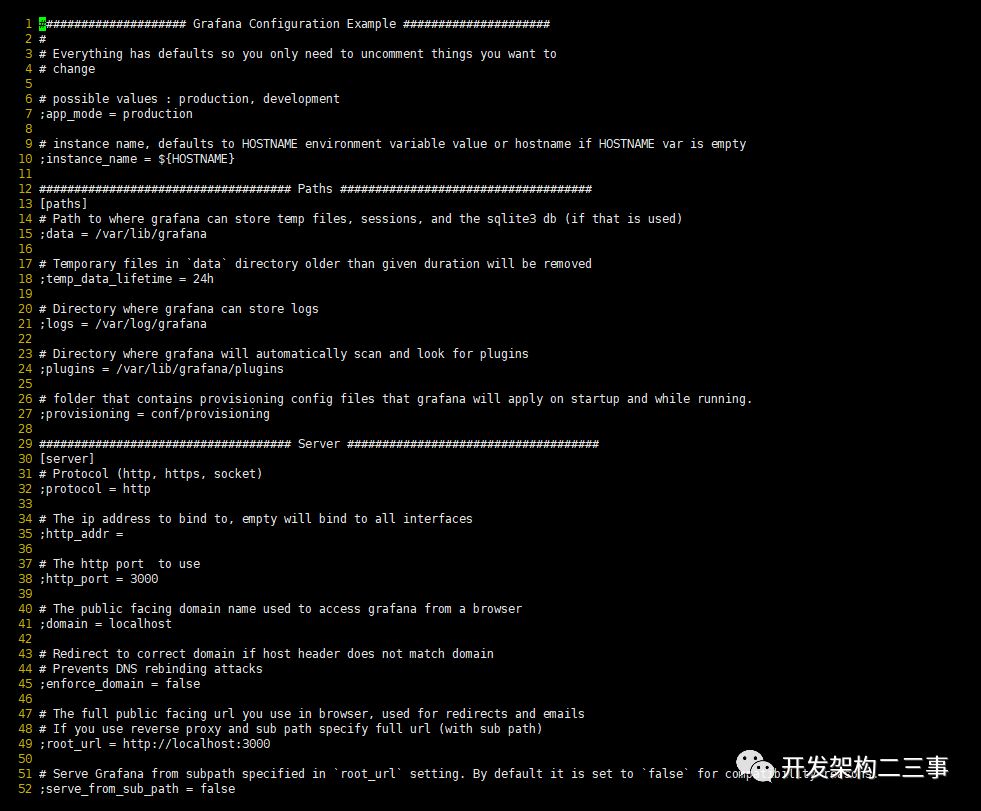
可以看到上面配置的http端口是3000
启动grafana
/etc/init.d/grafana-server start
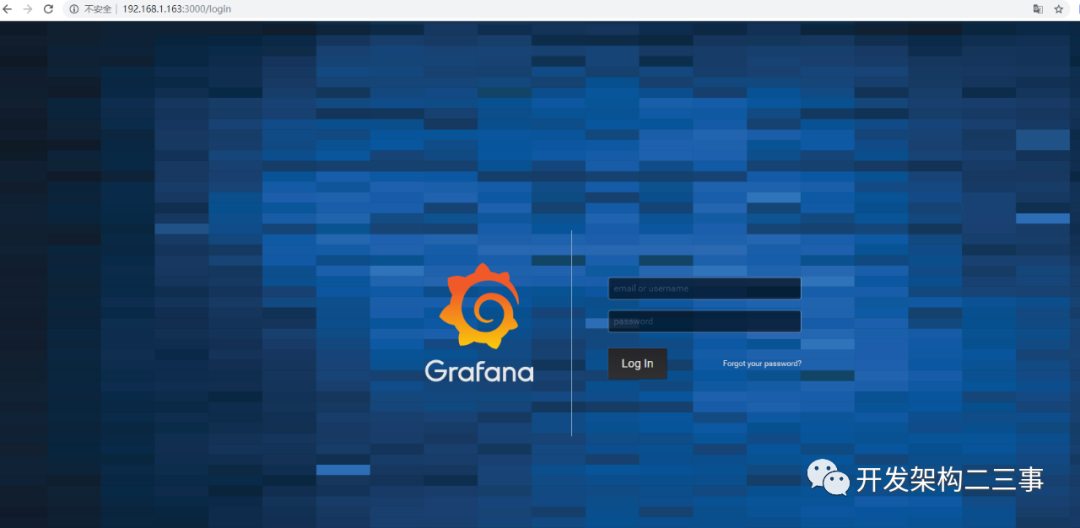
登录grafana
访问页面http://服务器IP:3000 ,默认账号、密码admin/admin 首次登录将提示修改密码,建议修改
安装Prometheus
Prometheus时序数据库结构:
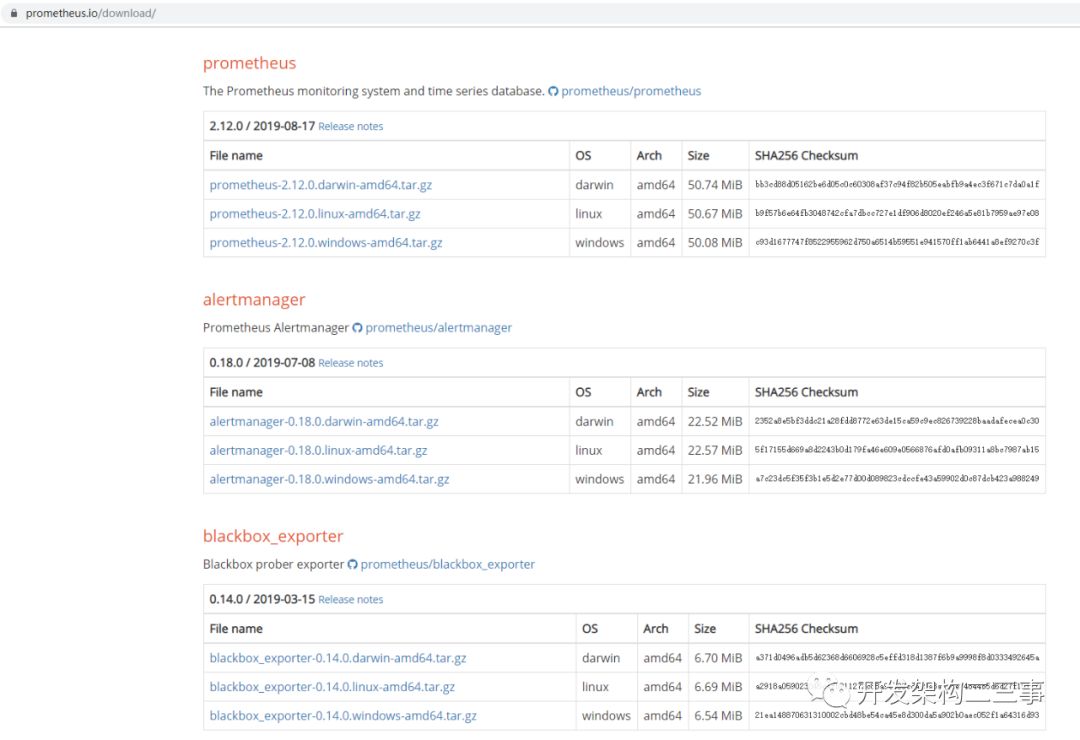
下载地址
https://prometheus.io/download/
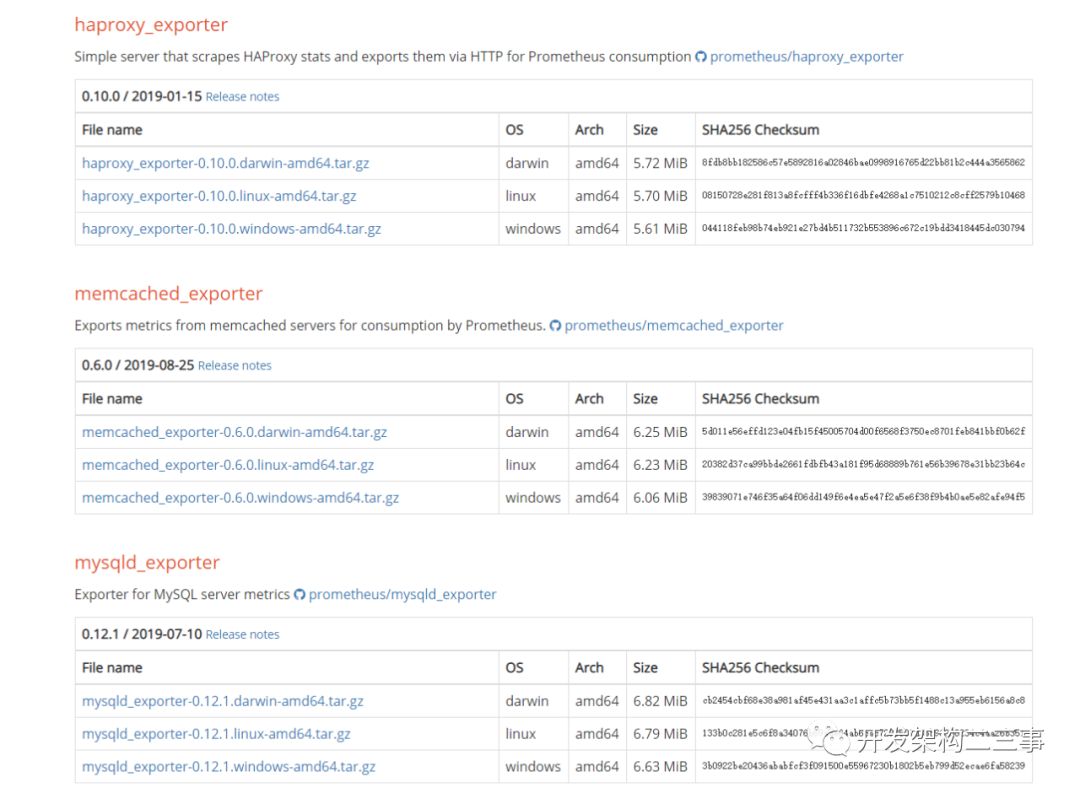
下载页面内有很多拓展包,如alertManager和mysqldexporter、haproxyexporter、memcache_exporter等exporter。
普通方式安装与启动
安装:
/**  下载*/
wget https://github.com/prometheus/prometheus/releases/download/v2.12.0/prometheus-2.12.0.linux-amd64.tar.gz
/**  解压*/
tar -zxvf prometheus-2.12.0.linux-amd64.tar.gz
启动
跳到目录内,然后执行
/** 生产环境启动*/
nohup ./prometheus --config.file=prometheus.yml --web.enable-lifecycle --storage.tsdb.retention.time=60d   &
/**
 --web.enable-lifecycle  加上此参数可以远程热加载配置文件,无需重启prometheus,调用指令是curl -X POST http://ip:9090/-/reload
-- storage.tsdb.retention.time 数据默认保存时间为15天,启动时加上此参数可以控制数据保存时间
*/
docker 方式安装(前提docker已经安装完毕)
创建目录和prometheus配置文件
mkdir /prometheus
vim /prometheus/prometheus.yml
拉取prometheus镜像
docker pull prom/prometheus
启动prometheus
docker run -d -p 9090:9090 --name prometheus -v /home/prometheus.yml:/etc/prometheus/prometheus.yml prom/prometheus
参数说明:
-d选项启动独立模式下的prometheus容器,这意味着容器将在后台启动,这种情况下只有stop docker才可以关闭prometheus,而不能执行ctrl+c
-p选择指定端口号映射,通过访问本机的9090端口,即可访问prometheus容器的9090端口
--name指定容器的名称
-v选项建立本机文件和docker内文件的映射
--config.file指定运行docker内prometheus的配置文件
prometheus配置文件的设定
书写要求
1. 大小写敏感
2. 使用缩进表示层级关系
3. 缩进时不允许使用Tab键,只允许使用空格。
4. 缩进的空格数目不重要,只要相同层级的元素左侧对齐即可
prometheus.yml的样例
将在多种组件组合在一起之后统一讲解
在需监控的机器上部署exporter
Alertmanager安装
源码安装:
git clone https://github.com/prometheus/alertmanager.git
cd alertmanager
make build
启动:
./alertmanager-config.file= alertmanager.yml #默认配置项为alertmanager.yml
官网下载安装启动:
wget https://github.com/prometheus/alertmanager/releases/download/v0.18.0/alertmanager-0.18.0.linux-amd64.tar.gz
tar  -zxvf alertmanager-0.18.0.linux-amd64.tar.gz
启动:
跳到目录里面然后执行
nohup ./alertmanager --config.file=alertmanager.yml &
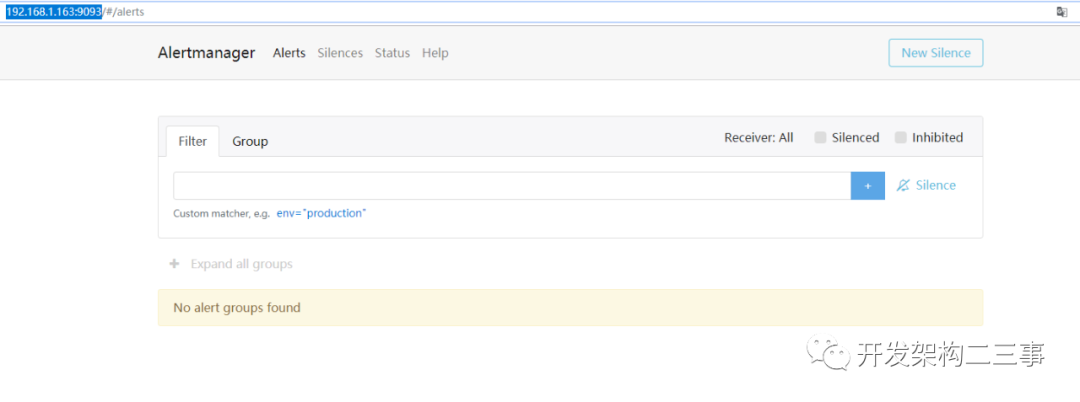
端口是:9093和9094
访问http://192.168.1.163:9093:
配置文件alertmanager.yml
# 全局配置项
global:
  resolve_timeout: 5m #处理超时时间,默认为5min
  smtp_smarthost: 'smtp.sina.com:25' # 邮箱smtp服务器代理
  smtp_from: '******@sina.com' # 发送邮箱名称
  smtp_auth_username: '******@sina.com' # 邮箱名称
  smtp_auth_password: '******' # 邮箱密码或授权码
  wechat_api_url: 'https://qyapi.weixin.qq.com/cgi-bin/' # 企业微信地址
# 定义模板信心
templates:
  - 'template/*.tmpl'
# 定义路由树信息
route:
  group_by: ['alertname'] # 报警分组依据
  group_wait: 10s # 最初即第一次等待多久时间发送一组警报的通知
  group_interval: 10s # 在发送新警报前的等待时间
  repeat_interval: 1m # 发送重复警报的周期 对于email配置中,此项不可以设置过低,否则将会由于邮件发送太多频繁,被smtp服务器拒绝
  receiver: 'email' # 发送警报的接收者的名称,以下receivers name的名称
# 定义警报接收者信息
receivers:
  - name: 'email' # 警报
    email_configs: # 邮箱配置
    - to: '******@163.com'  # 接收警报的email配置
      html: '{{ template "test.html" . }}' # 设定邮箱的内容模板
      headers: { Subject: "[WARN] 报警邮件"} # 接收邮件的标题
    webhook_configs: # webhook配置
    - url: 'http://127.0.0.1:5001'
    send_resolved: true
    wechat_configs: # 企业微信报警配置
    - send_resolved: true
      to_party: '1' # 接收组的id
      agent_id: '1000002' # (企业微信-->自定应用-->AgentId)
      corp_id: '******' # 企业信息(我的企业-->CorpId[在底部])
      api_secret: '******' # 企业微信(企业微信-->自定应用-->Secret)
      message: '{{ template "test_wechat.html" . }}' # 发送消息模板的设定
# 一个inhibition规则是在与另一组匹配器匹配的警报存在的条件下,使匹配一组匹配器的警报失效的规则。两个警报必须具有一组相同的标签。
inhibit_rules:
  - source_match:
     severity: 'critical'
    target_match:
     severity: 'warning'
    equal: ['alertname', 'dev', 'instance']
repeat_interval配置项,对于email来说,此项不可以设置过低,否则将会由于邮件发送太多频繁,被smtp服务器拒绝
企业微信注册地址:https://work.weixin.qq.com
上述配置的email、webhook和wechat三种报警方式。目前Alertmanager所有的报警方式有以下几个方面:
email_config
hipchat_config
pagerduty_config
pushover_config
slack_config
opsgenie_config
victorops_config
.tmpl模板的配置
test.tmpl
{{ define "test.html" }}
<table border="1">
        <tr>
                <td>报警项</td>
                <td>实例</td>
                <td>报警阀值</td>
                <td>开始时间</td>
        </tr>
        {{ range $i, $alert := .Alerts }}
                <tr>
                        <td>{{ index $alert.Labels "alertname" }}</td>
                        <td>{{ index $alert.Labels "instance" }}</td>
                        <td>{{ index $alert.Annotations "value" }}</td>
                        <td>{{ $alert.StartsAt }}</td>
                </tr>
        {{ end }}
</table>
{{ end }}
上述Labels项,表示prometheus里面的可选label项。annotation项表示报警规则中定义的annotation项的内容。
test_wechat.tmpl
{{ define "cdn_live_wechat.html" }}
  {{ range $i, $alert := .Alerts.Firing }}
    [报警项]:{{ index $alert.Labels "alertname" }}
    [实例]:{{ index $alert.Labels "instance" }}
    [报警阀值]:{{ index $alert.Annotations "value" }}
    [开始时间]:{{ $alert.StartsAt }}
  {{ end }}
{{ end }}
此处range遍历项与email模板中略有不同,只遍历当前没有处理的报警(Firing)。此项如果不设置,则在Alert中已经Resolved的报警项,也会被发送到企业微信。
在Prometheus模块定义告警规则
alertmanager_rules.yml样例配置文件(与prometheus同目录下)
groups:
 - name: test-rules
   rules:
   - alert: InstanceDown # 告警名称
     expr: up == 0 # 告警的判定条件,参考Prometheus高级查询来设定
     for: 2m # 满足告警条件持续时间多久后,才会发送告警
     labels: #标签项
      team: node
     annotations: # 解析项,详细解释告警信息
      summary: "{{$labels.instance}}: has been down"
      description: "{{$labels.instance}}: job {{$labels.job}} has been down "
      value: {{$value}}
告警信息生命周期三种状态
inactive:表示当前报警信息即不是firing状态也不是pending状态
pending:表示在设置的阈值时间范围内被激活的
firing:表示超过设置的阈值时间被激活的
通过钉钉发消息
地址:https://github.com/timonwong/prometheus-webhook-dingtalk 也可以使用docker安装。
You can deploy this tool using the Docker image from following registry:
DockerHub: https://hub.docker.com/r/timonwong/prometheus-webhook-dingtalk/
Quay.io: https://quay.io/repository/timonwong/prometheus-webhook-dingtalk
源码安装:
yum install git
git clone https://github.com/timonwong/prometheus-webhook-dingtalk.git
cd prometheus-webhook-dingtalk
make
prometheus-webhook-dingtalk发送钉钉告警模版文件就是src/github.com/timonwong/prometheus-webhook-dingtalk/template/default.tmpl,可以根据需要进行更改。
启动prometheus-webhook-dingtalk:
nohup ./prometheus-webhook-dingtalk --ding.profile=“ops_dingding=https://oapi.dingtalk.com/robot/send?access_token=xxx” 2>&1 1>dingding.log &
端口是8060
如果不想每次都把机器人加上可以在/etc/systemd/system/prometheus-webhook-dingtalk.service 文件中添加机器人的url。
添加机器人url的方法见:https://www.jianshu.com/p/a3c62eb71ae3 也可以添加多个:
prometheus-webhook-dingtalk \
    --ding.profile="webhook1=https://oapi.dingtalk.com/robot/send?access_token=xxxxxxxxxxxx" \
    --ding.profile="webhook2=https://oapi.dingtalk.com/robot/send?access_token=yyyyyyyyyyy"
这里就定义了两个 WebHook,一个 webhook1,一个 webhook2,用来往不同的钉钉组发送报警消息,见:https://theo.im/blog/2017/10/16/release-prometheus-alertmanager-webhook-for-dingtalk/
此时在alertmanager.yml中要加上webhook的配置:
global:
  resolve_timeout: 5m
route:
  receiver: webhook
  group_wait: 3s
  group_interval: 5s
  repeat_interval: 5m
  group_by: [alertname]
  routes:
  - receiver: webhook
    group_wait: 10s
    match:
      team: node
receivers:
- name: webhook
  webhook_configs:
  - url: http://localhost:8060/dingtalk/ops_dingding/send
    send_resolved: true
监控linux主机安装
下载:
/**  下载  */
wget https://github.com/prometheus/node_exporter/releases/download/v0.18.1/node_exporter-0.18.1.linux-amd64.tar.gz
/**  解压  */
tar  -zxvf node_exporter-0.18.1.linux-amd64.tar.gz
安装启动:
/** 启动 node_exporter*/
cd  node_exporter-0.18.1.linux-amd64
nohup ./node_exporter  &
/**
默认端口9100
*/
监控mysql
下载监控MySQL的mysqld_exporter,依旧从官网下载:
/**  下载  */
wget  https://github.com/prometheus/mysqld_exporter/releases/download/v0.12.1/mysqld_exporter-0.12.1.linux-amd64.tar.gz
/**  解压  */
tar -zxvf  mysqld_exporter-0.12.1.linux-amd64.tar.gz
监控账号及修改文件配置:
/**  创建账号  */
mysql> create user 'mysql_monitor'@'localhost' identified by 'aA&12345';
或者mysql> create user 'mysql_monitor_user'@'192.168.1.%' identified by 'aA&12345';
/** 授权 */
mysql> GRANT REPLICATION CLIENT, PROCESS ON *.* TO 'mysql_monitor'@'localhost';
mysql> GRANT SELECT ON performance_schema.* TO 'mysql_monitor'@'localhost';
mysql> flush privileges;
/**
注意,不同版本对权限要求不一致,启动时注意查看日志,如权限不足则继续授权或创建对应的账号
*/
配置文件修改:
cd mysqld_exporter-0.12.0.linux-amd64
vim .my.cnf
/**  添加如下配置 */
[client]
port=3306
user=mysql_monitor
password=aA&12345
启动:
nohup ./mysqld_exporter --config.my-cnf=.my.cnf &
实际使用中用的是root用户,但是在nohup.out日志中报了:Host '127.0.0.1' is not allowed to connect to this MySQL server" 解决办法:
mysql> show databases;
+--------------------+
| Database           |
+--------------------+
| information_schema |
| infosys_login      |
| infosys_test       |
| mms                |
| mysql              |
| performance_schema |
| sys                |
| test               |
| zabbix             |
| zm_doc             |
+--------------------+
10 rows in set (0.00 sec)
mysql> use mysql
Reading table information for completion of table and column names
You can turn off this feature to get a quicker startup with -A
Database changed
mysql> select host,user form mysql
    -> ;
ERROR 1064 (42000): You have an error in your SQL syntax; check the manual that corresponds to your MySQL server version for the right syntax to use near 'mysql' at line 1
mysql> show tables;
+---------------------------+
| Tables_in_mysql           |
+---------------------------+
| columns_priv              |
| db                        |
| engine_cost               |
| event                     |
| func                      |
| general_log               |
| gtid_executed             |
| help_category             |
| help_keyword              |
| help_relation             |
| help_topic                |
| innodb_index_stats        |
| innodb_table_stats        |
| ndb_binlog_index          |
| plugin                    |
| proc                      |
| procs_priv                |
| proxies_priv              |
| server_cost               |
| servers                   |
| slave_master_info         |
| slave_relay_log_info      |
| slave_worker_info         |
| slow_log                  |
| tables_priv               |
| time_zone                 |
| time_zone_leap_second     |
| time_zone_name            |
| time_zone_transition      |
| time_zone_transition_type |
| user                      |
+---------------------------+
31 rows in set (0.00 sec)
mysql> select Host, User,Password from user;
ERROR 1054 (42S22): Unknown column 'Password' in 'field list'
mysql> select Host, User from user;
+---------------------+--------------------+
| Host                | User               |
+---------------------+--------------------+
| 192.168.1.%         | infosys_test       |
| 192.168.1.%         | mysql_monitor_user |
| 192.168.1.%         | root               |
| 192.168.1.163       | test1664           |
| 192.168.1.164       | host164            |
| 192.168.1.164       | test123            |
| 192.168.1.164       | test14             |
| 192.168.1.164       | test1669           |
| localhost           | mysql.session      |
| localhost           | mysql.sys          |
| localhost           | mysql_monitor      |
| localhost           | root               |
| ‘192.168.1.164’     | test14             |
+---------------------+--------------------+
13 rows in set (0.00 sec)
mysql>  grant all privileges on *.* to root@"127.0.0.1" identified by "123423$*MD7369qwezxc" with grant option;
Query OK, 0 rows affected, 1 warning (0.00 sec)
mysql> flush privileges;
Query OK, 0 rows affected (0.00 sec)
问题解决
监控redis
官网上没有redis_exporter, 可以从github上获取,另外redis插件无需放在redis机器上也可以:
/**  下载  */
wget https://github.com/oliver006/redis_exporter/releases/download/v0.30.0/redis_exporter-v0.30.0.linux-amd64.tar.gz
/**  解压  */
tar -zxvf  redis_exporter-v0.30.0.linux-amd64.tar.gz
启动:
/**  redis无密码 */
nohup  ./redis_exporter -redis.addr=192.168.56.118:6379 -web.listen-address 0.0.0.0:9121  &
/**  redis有密码  */
nohup  ./redis_exporter -redis.addr=192.168.1.136:6379 -redis.password reRedis123   -web.listen-address 0.0.0.0:9122 &
/**
 -web.listen-address  可以自定义监控端口
*/
监控springboot程序
先添加 pom 依赖
springboot1:
        <dependency>
            <groupId>io.prometheus</groupId>
            <artifactId>simpleclient_spring_boot</artifactId>
            <version>0.1.0</version>
        </dependency>
springboot2:
 <dependency>
        <groupId>org.springframework.boot</groupId>
        <artifactId>spring-boot-starter-actuator</artifactId>
  </dependency>
 <dependency>
        <groupId>io.micrometer</groupId>
         <artifactId>micrometer-core</artifactId>
 </dependency>
 <dependency>
        <groupId>io.micrometer</groupId>
        <artifactId>micrometer-registry-prometheus</artifactId>
 </dependency>
需要自定义metrics.
启动类添加注解
springboot1:
@EnablePrometheusEndpoint
@EnableSpringBootMetricsCollector
配置文件添加
springboot1:
# 默认账号密码
managment.security.enabled=false
spring.application.name=microservice-prometheus
springboot2参考:https://segmentfault.com/a/1190000018642077
配置prometheus配置文件
添加各监控项
# Prometheus全局配置项
global:
  scrape_interval:     15s # 设定抓取数据的周期,默认为1min
  evaluation_interval: 15s # 设定更新rules文件的周期,默认为1min
  scrape_timeout: 15s # 设定抓取数据的超时时间,默认为10s
  external_labels: # 额外的属性,会添加到拉取得数据并存到数据库中
   monitor: 'codelab_monitor'
# Alertmanager配置
alerting:
 alertmanagers:
 - static_configs:
   - targets: ["localhost:9093"] # 设定alertmanager和prometheus交互的接口,即alertmanager监听的ip地址和端口
# rule配置,首次读取默认加载,之后根据evaluation_interval设定的周期加载
rule_files:
 - "alertmanager_rules.yml"
 - "prometheus_rules.yml"
# scape配置
scrape_configs:
- job_name: 'prometheus' # job_name默认写入timeseries的labels中,可以用于查询使用
  scrape_interval: 15s # 抓取周期,默认采用global配置
  static_configs: # 静态配置
  - targets: ['localhost:9090'] # prometheus所要抓取数据的地址,即instance实例项
- job_name: 'OS'
  static_configs:
  - targets: ['localhost:9100']
        labels:
            instance:'192.168.1.163'
   - targets: ['192.168.56.116:9100']
        labels:
            instance: '192.168.56.116'
   - targets: ['192.168.56.117:9100']
        labels:
            instance: '192.168.56.117'
  ##  上述job单独做主机监控,每台主机的instance不同
- job_name: 'mysql'
    # metrics_path defaults to '/metrics'
    # scheme defaults to 'http'.
    static_configs:
    - targets: ['192.168.56.116:9104']
      labels:
          instance: '192.168.56.116'
    - targets: ['192.168.56.117:9104']
      labels:
          instance: '192.168.56.117'
  ## 以上是监控mysql的,instance和主机的instance的相同
- job_name: 'redis'
    # metrics_path defaults to '/metrics'
    # scheme defaults to 'http'.
    static_configs:
    - targets: ['192.168.56.118:9121','192.168.56.118:9122']
      labels:
          instance: '192.168.56.118'
    - targets: ['192.168.56.118:9100']
      labels:
          instance: '192.168.56.118'
#   可以类似上述这种,redis的主机及各redis监控项组合在一起,instance使用相同的
prometheus_rule.yml:
groups:
- name: example
  rules:
  - record:cpu_utilization_ratio  //新的规则名
    expr: 100 - (avg by (instance) (irate(node_cpu_seconds_total[5m])) * 100)   //规则表达式
alertmanager_rules.yml:
groups:
 - name: test-rules
   rules:
   - alert: InstanceDown # 告警名称
     expr: up == 0 # 告警的判定条件,参考Prometheus高级查询来设定
     for: 2m # 满足告警条件持续时间多久后,才会发送告警
     labels: #标签项
      team: node
     annotations: # 解析项,详细解释告警信息
      summary: "{{$labels.instance}}: has been down"
      description: "{{$labels.instance}}: job {{$labels.job}} has been down "
      value: {{$value}}
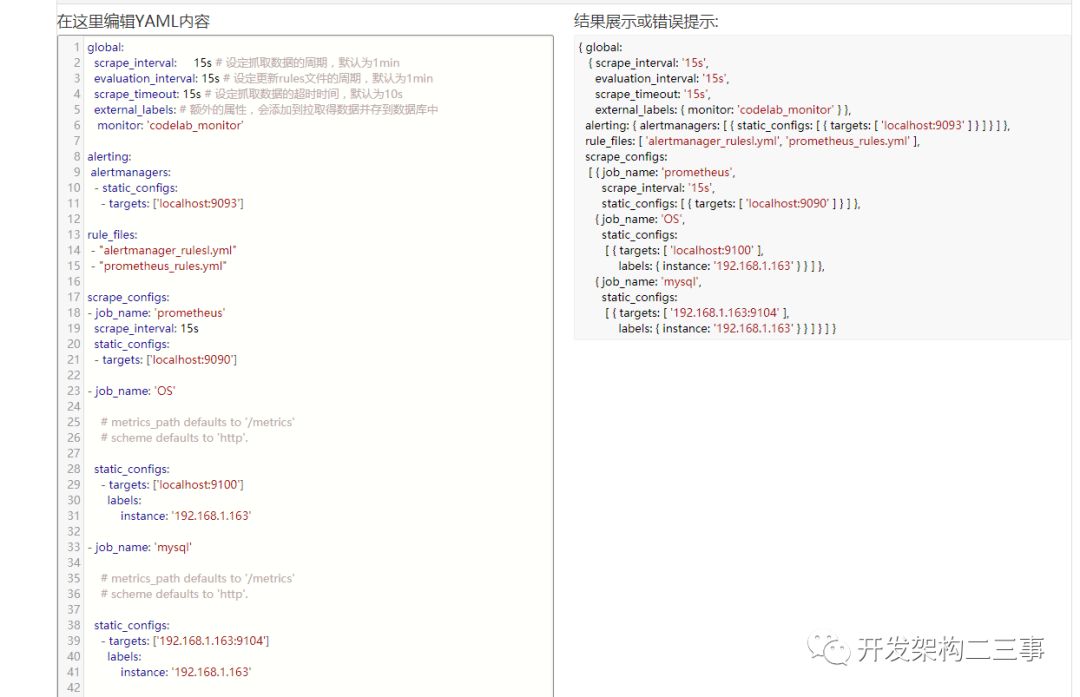
格式化之后:
global:
  scrape_interval:     15s # 设定抓取数据的周期,默认为1min
  evaluation_interval: 15s # 设定更新rules文件的周期,默认为1min
  scrape_timeout: 15s # 设定抓取数据的超时时间,默认为10s
  external_labels: # 额外的属性,会添加到拉取得数据并存到数据库中
   monitor: 'codelab_monitor'
alerting:
 alertmanagers:
  - static_configs:
    - targets: ['localhost:9093']
rule_files:
 - "alertmanager_rulesl.yml"
 - "prometheus_rules.yml"
scrape_configs:
- job_name: 'prometheus'
  scrape_interval: 15s
  static_configs:
  - targets: ['localhost:9090']
- job_name: 'OS'
    # metrics_path defaults to '/metrics'
    # scheme defaults to 'http'.
  static_configs:
    - targets: ['localhost:9100']
      labels:
          instance: '192.168.1.163'
    - targets: ['192.168.1.164:9100']
      labels:
         instance: '192.168.1.164'
- job_name: 'mysql'
    # metrics_path defaults to '/metrics'
    # scheme defaults to 'http'.
  static_configs:
    - targets: ['192.168.1.163:9104']
      labels:
          instance: '192.168.1.163'
    - targets: ['192.168.1.164:9104']
      labels:
          instance: '192.168.1.164'
- job_name: spring-boot
  static_configs:
   - targets: ['192.168.1.208:8080']
- job_name: 'redis'
  static_configs:
    - targets: ['192.168.1.136:9122']
      labels:
          instance: '192.168.1.136'
在http://www.bejson.com/validators/yaml_editor/中:
启动或热加载prometheus
/**  启动  */
nohup ./prometheus --config.file=prometheus.yml --web.enable-lifecycle --storage.tsdb.retention.time=60d   &
/**
-- storage.tsdb.retention.time 数据默认保存时间为15天,启动时加上此参数可以控制数据保存时间
*/
/**  热加载  */
curl -X POST http://ip:9090/-/reload
/**
热加载的前提是启动时加了--web.enable-lifecycle
*/
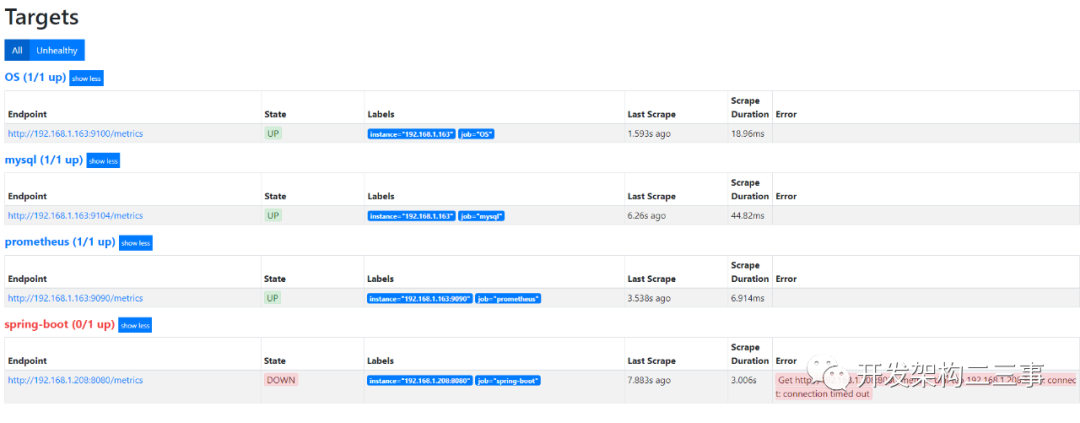
浏览器上打开http://192.168.1.163:9090/targets:
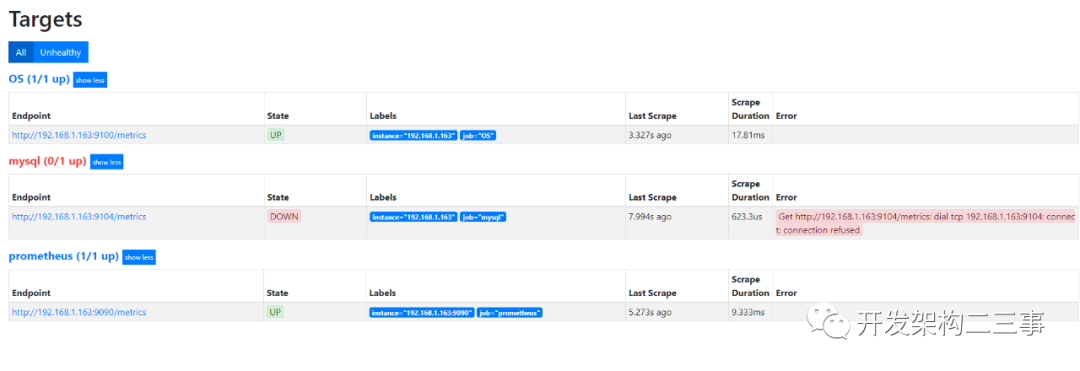
关掉mysql exporter之后:
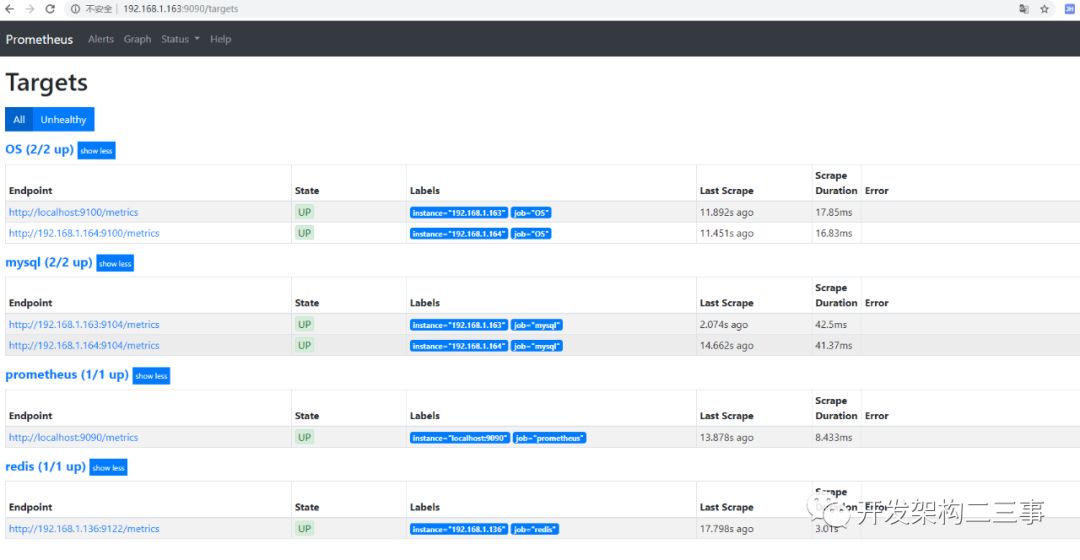
多添加了几台之后:
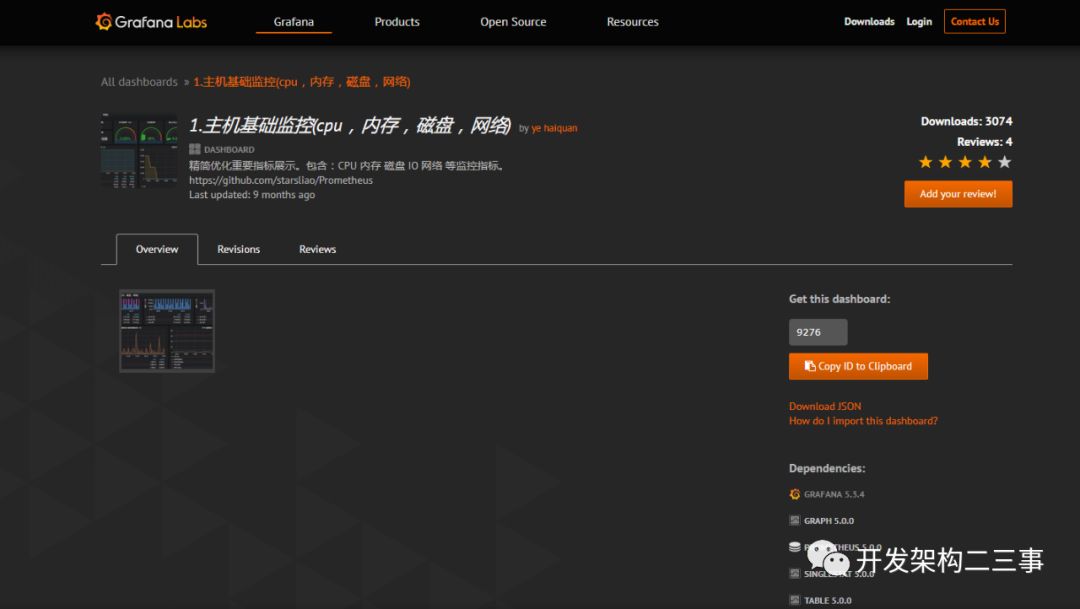
下载各监控仪表盘
下载地址:
https://grafana.com/grafana/dashboards
流程
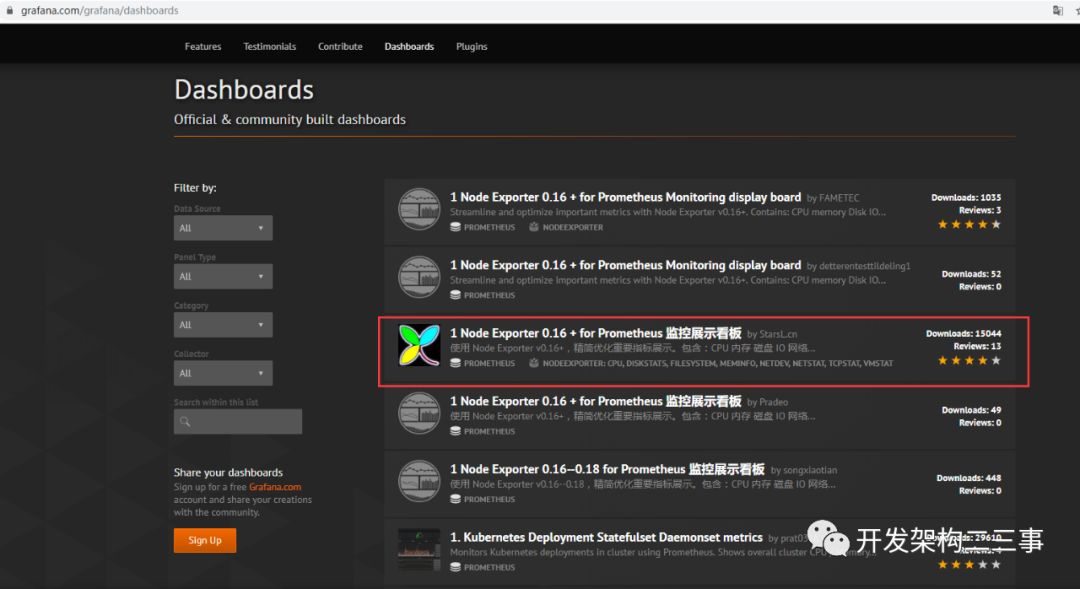
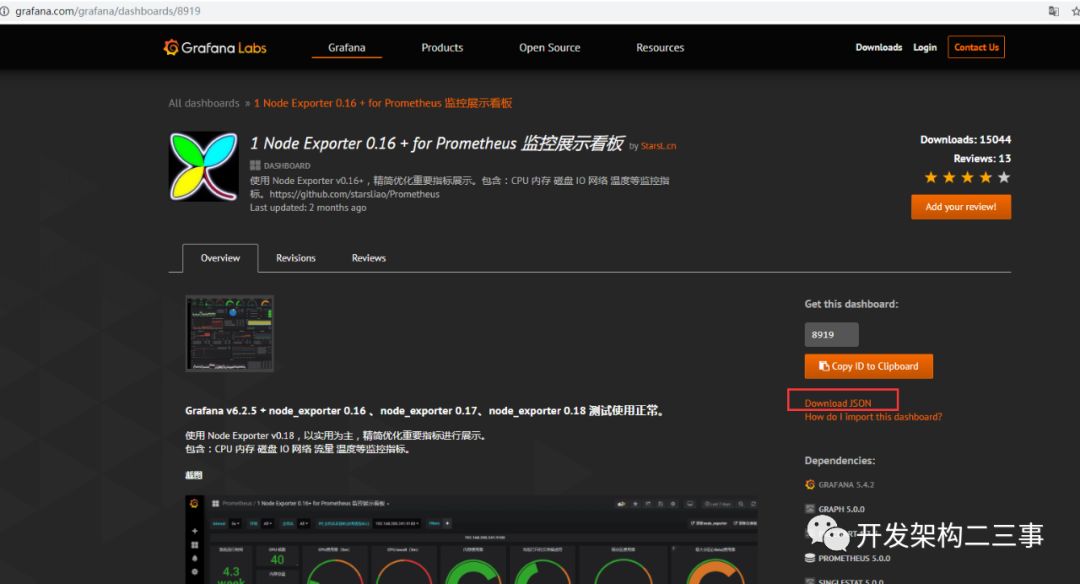
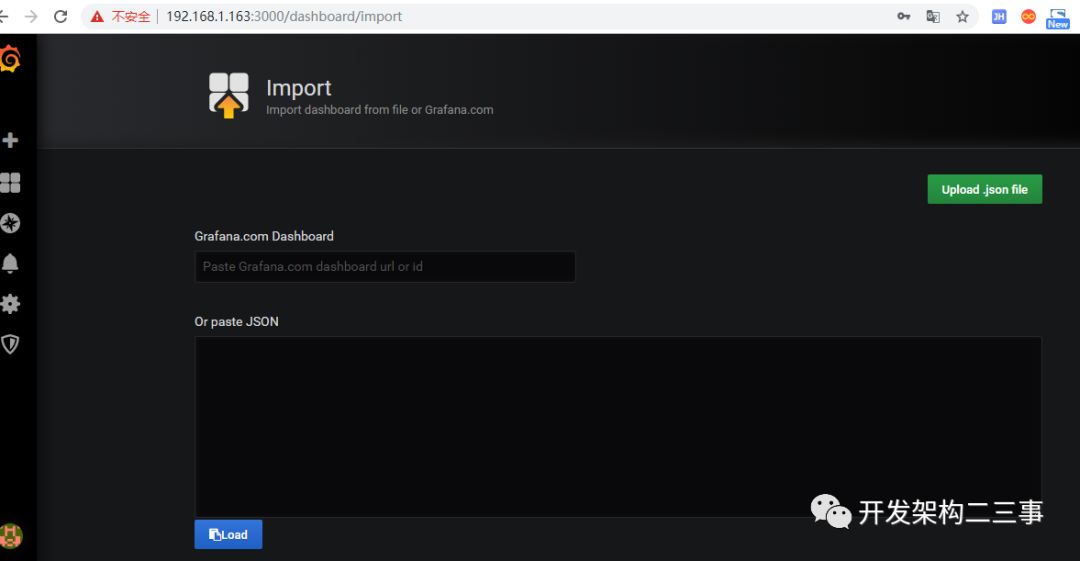
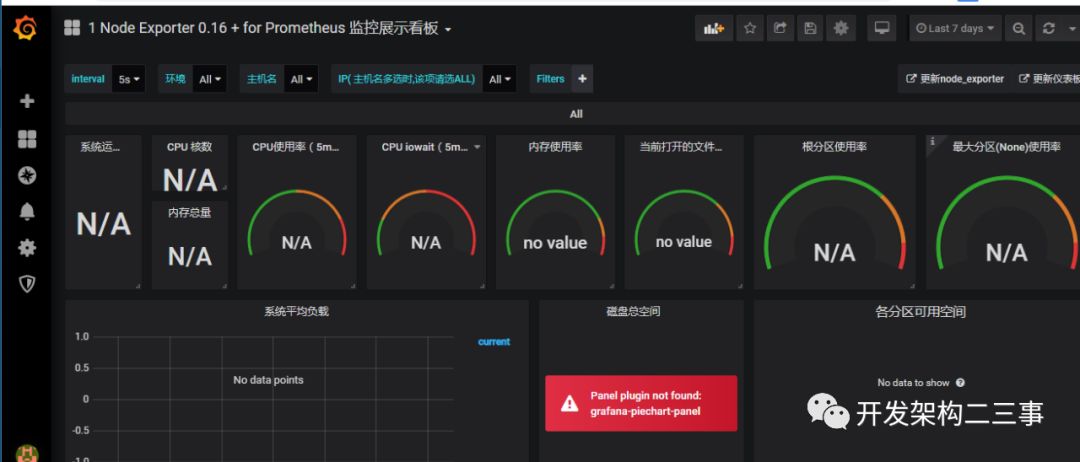
关于dashboards,主机监控我选用的是9276:
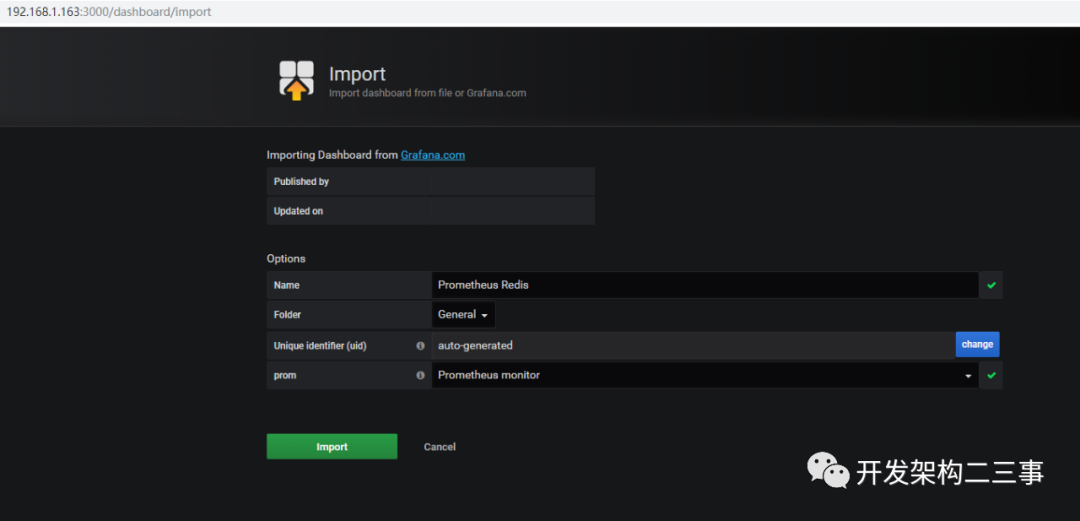
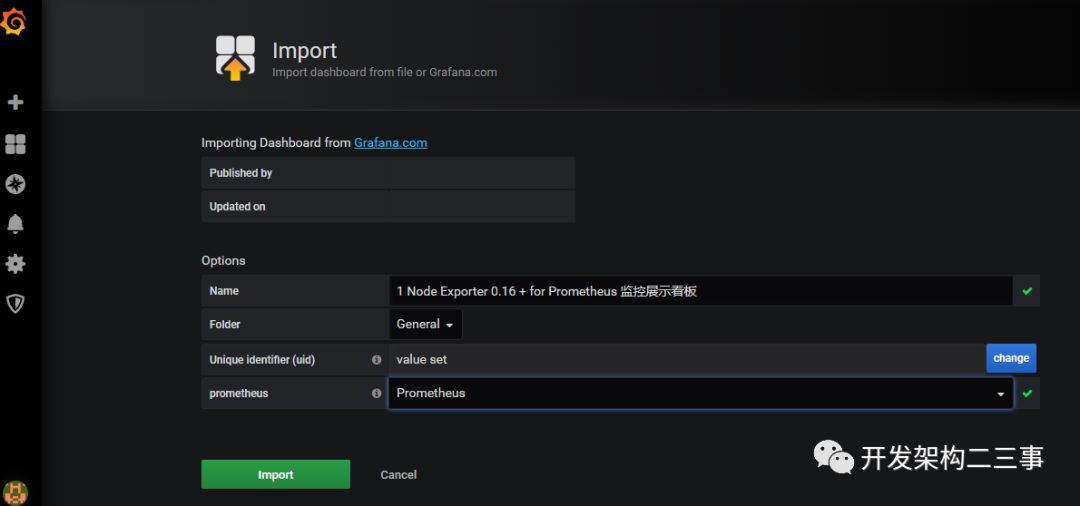
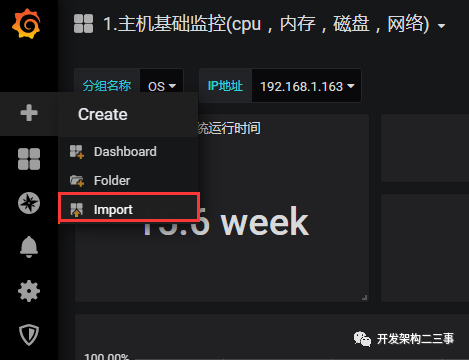
import:
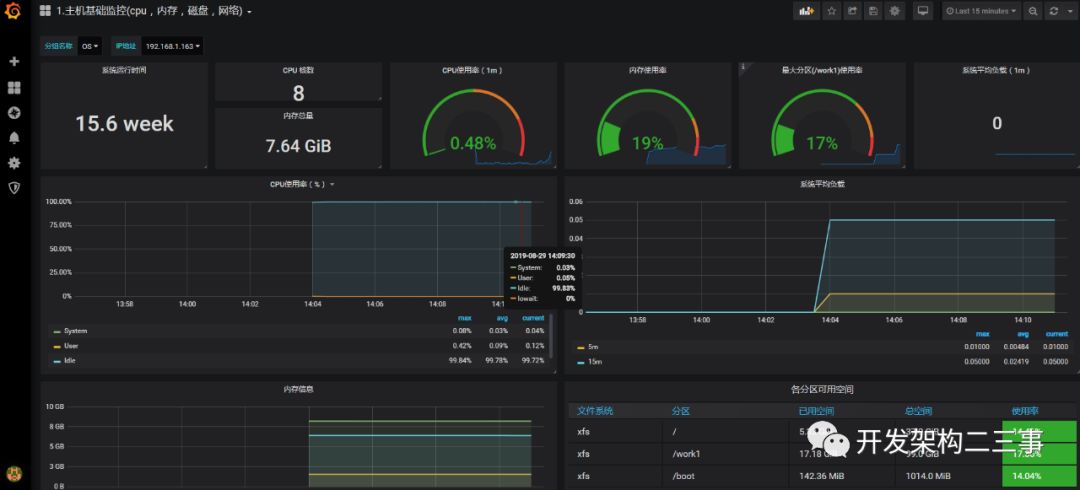
import之后:
也可以选用:https://github.com/percona/grafana-dashboards/blob/master/dashboards/System_Overview.json
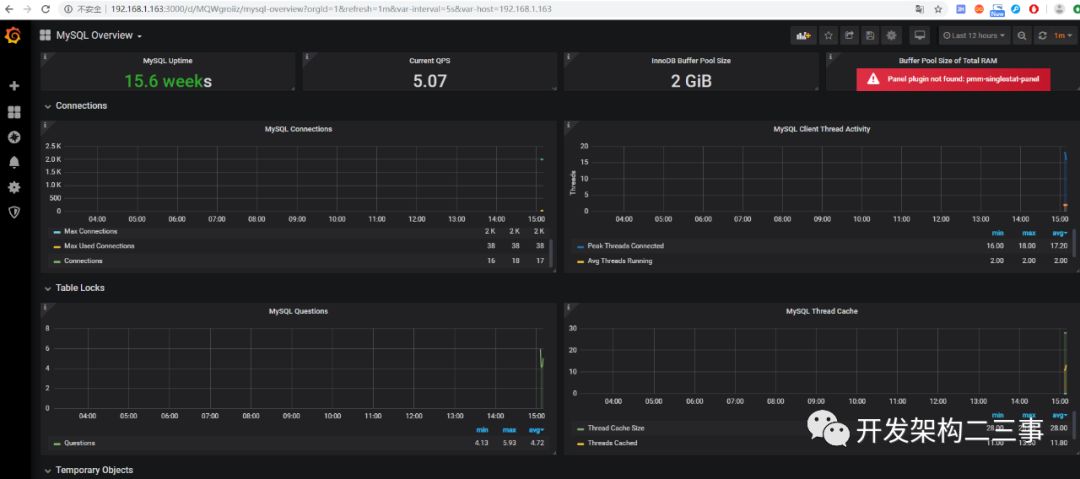
mysql dashboards
选用的是:https://github.com/percona/grafana-dashboards/blob/master/dashboards/MySQL_Overview.json
redis dashboards
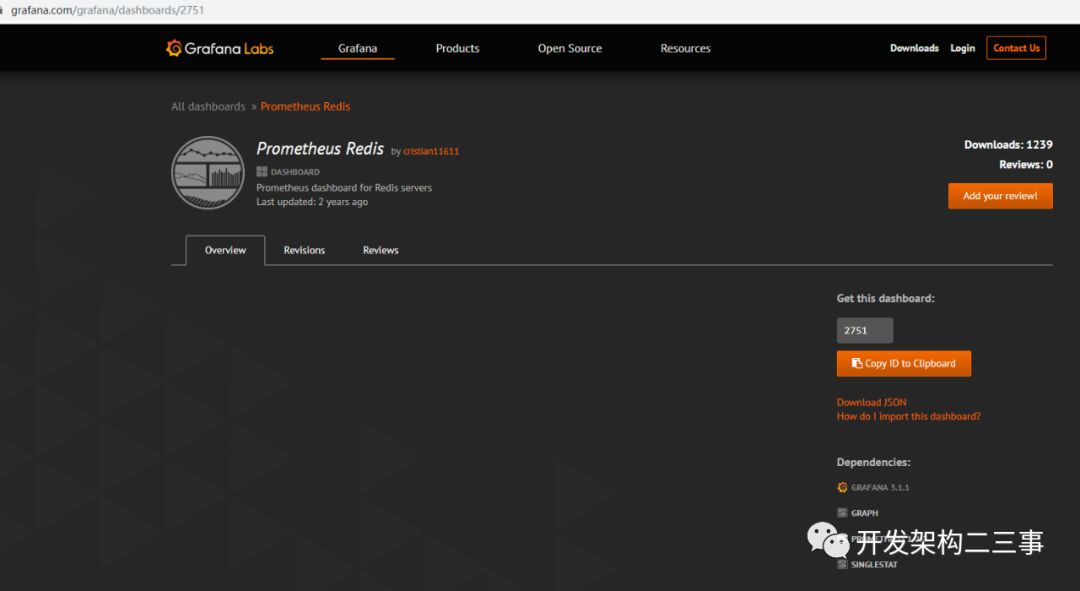
根据版本,也可选用:https://grafana.com/grafana/dashboards/763 import: