


作者:Andrew Udell
翻译:王闯(Chuck)
校对:廖倩颖
本文约2200字,建议阅读8分钟
作者基于Kaggle上的Wish数据集,用Python演示了随机森林回归预测商品销量的方法,对于读者分析和解决此类问题是很好的借鉴。

照片来源rupixen.com
数据集
数据导入和清理
import pandas aspdimport numpy as np# import the data saved as a csvdf = pd.read_csv("Summer_Sales_08.2020.csv")
df["has_urgency_banner"] = df["has_urgency_banner"].fillna(0)df["discount"] = (df["retail_price"] - df["price"])/df["retail_price"]
df [“ rating_five_percent”] = df [“ rating_five_count”] / df [“ rating_count”]df [“ rating_four_percent”] = df [“ rating_four_count”] / df [“ rating_count”]df [“ rating_three_percent”] = df [“ rating_three_count“] / df [” rating_count“]df [” rating_two_percent“] = df [” rating_two_count“] / df [” rating_count“]df [” rating_one_percent“] = df [” rating_one_count“] / df [” rating_count“]
ratings = ["rating_five_percent","rating_four_percent","rating_three_percent","rating_two_percent","rating_one_percent"]for rating in ratings:df[rating] = df[rating].apply(lambda x: x if x>= 0 and x<= 1 else 0)
数据探索
import seaborn as sns# Distribution plot on pricesns.distplot(df['price'])
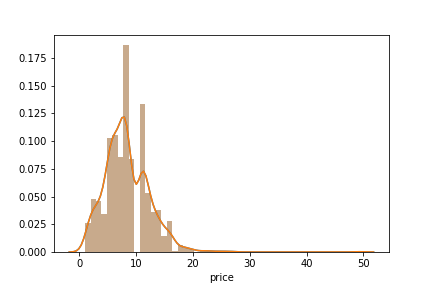
价格分布图,由本文作者制作。
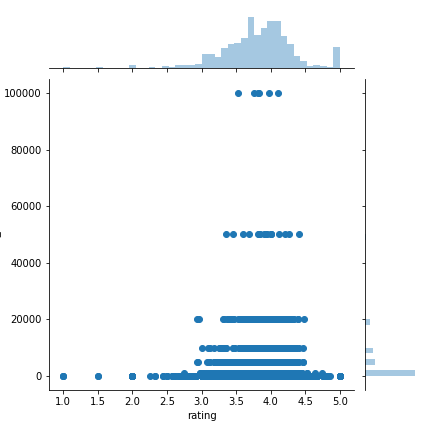
sns.jointplot(x =“ rating”,y =“ units_sold”,data = df,kind =“ scatter”)
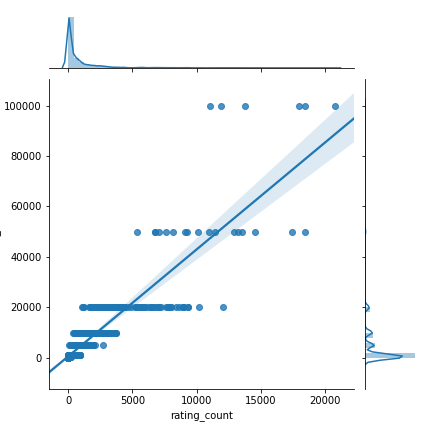
sns.jointplot(x =“ rating_count”,y =“ units_sold”,data = df,kind =“ reg”)
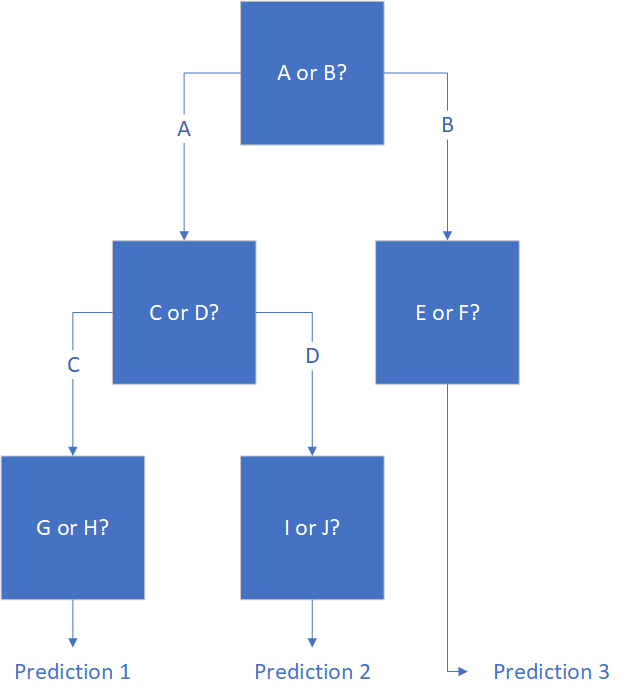
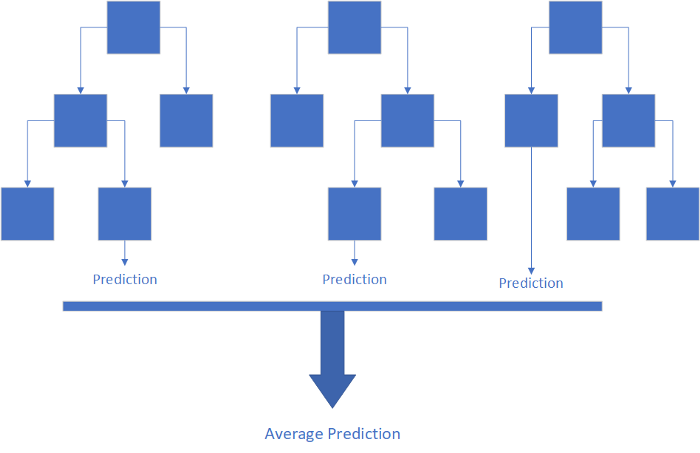
什么是随机森林回归?
随机森林回归的实现
from sklearn.model_selection import train_test_splitfrom sklearn.ensemble import RandomForestRegressor# Divide the data between units sold and influencing factorsX = df.filter(["price","discount","uses_ad_boosts","rating","rating_count","rating_five_percent","rating_four_percent","rating_three_percent","rating_two_percent","rating_one_percent","has_urgency_banner","merchant_rating","merchant_rating_count","merchant_has_profile_picture"])Y = df["units_sold"]# Split the data into training and testing setsX_train, X_test, Y_train, Y_test = train_test_split(X, Y, test_size=0.33, random_state = 42)
# Set up and run the modelRFRegressor = RandomForestRegressor(n_estimators = 20)RFRegressor.fit(X_train, Y_train)
# Set up and run the modelRFRegressor = RandomForestRegressor(n_estimators = 20)RFRegressor.fit(X_train, Y_train)
总结
校对:龚力
译者简介

王闯(Chuck),台湾清华大学资讯工程硕士。曾任奥浦诺管理咨询公司数据分析主管,现任尼尔森市场研究公司数据科学经理。很荣幸有机会通过数据派THU微信公众平台和各位老师、同学以及同行前辈们交流学习。
翻译组招募信息
工作内容:需要一颗细致的心,将选取好的外文文章翻译成流畅的中文。如果你是数据科学/统计学/计算机类的留学生,或在海外从事相关工作,或对自己外语水平有信心的朋友欢迎加入翻译小组。
你能得到:定期的翻译培训提高志愿者的翻译水平,提高对于数据科学前沿的认知,海外的朋友可以和国内技术应用发展保持联系,THU数据派产学研的背景为志愿者带来好的发展机遇。
其他福利:来自于名企的数据科学工作者,北大清华以及海外等名校学生他们都将成为你在翻译小组的伙伴。
点击文末“阅读原文”加入数据派团队~
转载须知
如需转载,请在开篇显著位置注明作者和出处(转自:数据派ID:DatapiTHU),并在文章结尾放置数据派醒目二维码。有原创标识文章,请发送【文章名称-待授权公众号名称及ID】至联系邮箱,申请白名单授权并按要求编辑。
发布后请将链接反馈至联系邮箱(见下方)。未经许可的转载以及改编者,我们将依法追究其法律责任。

点击“阅读原文”拥抱组织
文章转载自数据派THU,如果涉嫌侵权,请发送邮件至:contact@modb.pro进行举报,并提供相关证据,一经查实,墨天轮将立刻删除相关内容。
