


作者:Mohit Sharma
翻译:王闯(Chuck)
校对:王可汗

什么是时间序列?
如何在Python中绘制时间序列数据?
时间序列的要素是什么?
如何分解时间序列?
经典分解法
如何获得季节性调整值?
STL分解法
时间序列预测的基本方法:
Python中的简单移动平均(SMA)
为什么使用简单移动平均?
Python中的加权移动平均(WMA)
Python中的指数移动平均(EMA)
什么是时间序列?
如何在PYTHON中绘制时间序列数据?
#Reading Time Series DataAirpassenger = pd.read_csv("AirPassengers.csv")Airpassenger.head(3)
Airpassenger = Airpassenger.set_index('date')pyplot.rcParams["figure.figsize"] = (12,6)Airpassenger.plot()pyplot.show()
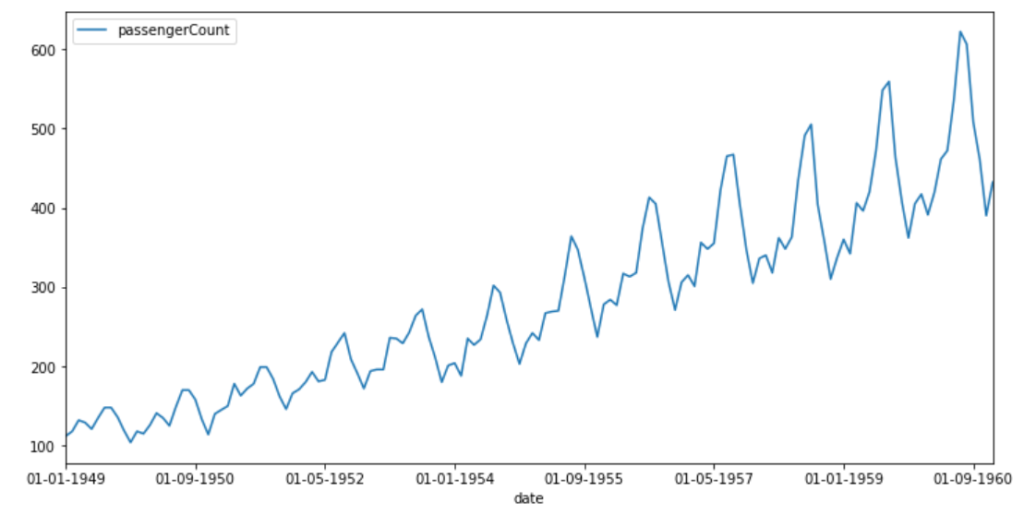
航空旅客人数
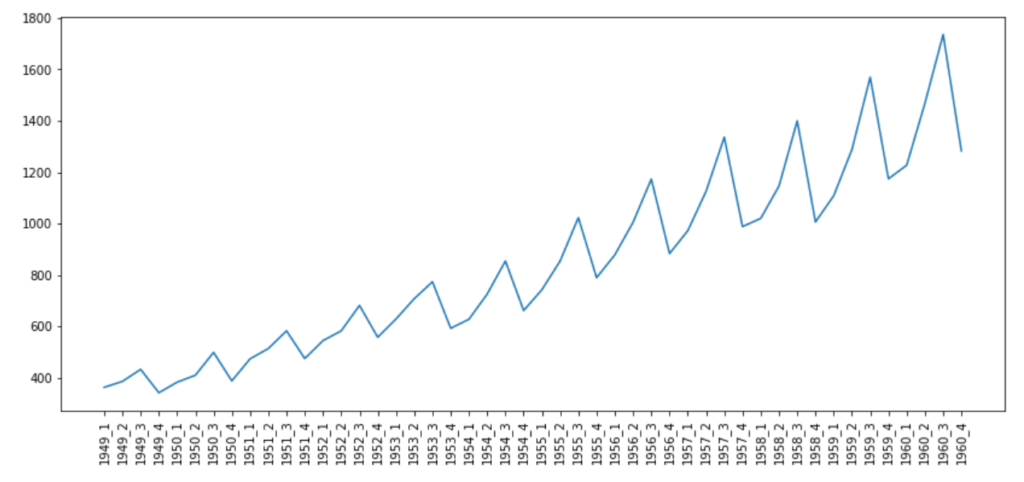
from datetime import datetime# Airpassenger["date"] = Airpassenger["date"].apply(lambda x: datetime.strptime(x, "%d-%m-%Y"))Airpassenger["year"] = Airpassenger["date"].apply(lambda x: x.year)Airpassenger["qtr"] = Airpassenger["date"].apply(lambda x: x.quarter)Airpassenger["yearQtr"]=Airpassenger['year'].astype(str)+'_'+Airpassenger['qtr'].astype(str)airPassengerByQtr=Airpassenger[["passengerCount", "yearQtr"]].groupby(["yearQtr"]).sum()
pyplot.rcParams["figure.figsize"] = (14,6)pyplot.plot(airPassengerByQtr)pyplot.xticks(airPassengerByQtr.index, rotation='vertical')
时间序列的要素是什么?
如何分解时间序列?
时间序列不必具有所有要素。
弄清该时间序列是可加的还是可乘的。
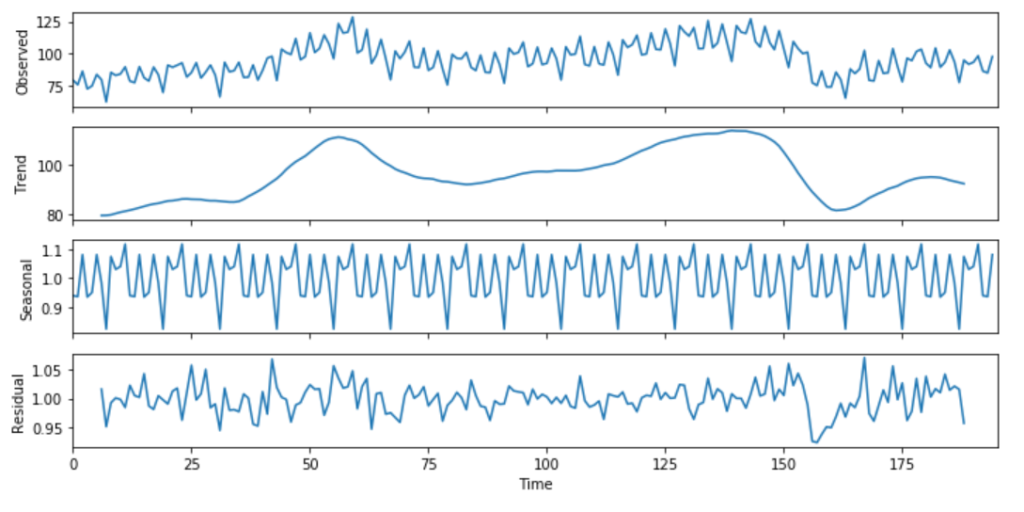
经典分解法
该方法起源于1920年,是诸多方法的鼻祖。经典分解法有两种形式:加法和乘法。Python中的statsmodels库中的函数season_decompose()提供了经典分解法的实现。在经典分解法中,需要你指出时间序列是可加的还是可乘的。你可以在此处(https://otexts.com/fpp2/classical-decomposition.html)了解有关加法和乘法分解的更多信息。
import numpy as npfrom pandas import read_csvimport matplotlib.pyplot as pltfrom statsmodels.tsa.seasonal import seasonal_decomposefrom pylab import rcParamselecequip = read_csv(r"C:/Users/datas/python/data/elecequip.csv")result = seasonal_decompose(np.array(elecequip), model='multiplicative', freq=4)rcParams['figure.figsize'] = 10, 5result.plot()pyplot.figure(figsize=(40,10))pyplot.show()
如何获得季节性调整值?
该技术对异常值不可靠。
它倾向于使时间序列数据中的突然上升和下降过度平滑。
假设季节性因素每年只重复一次。
对于前几次和最后几次观察,该方法都不会产生趋势周期估计。
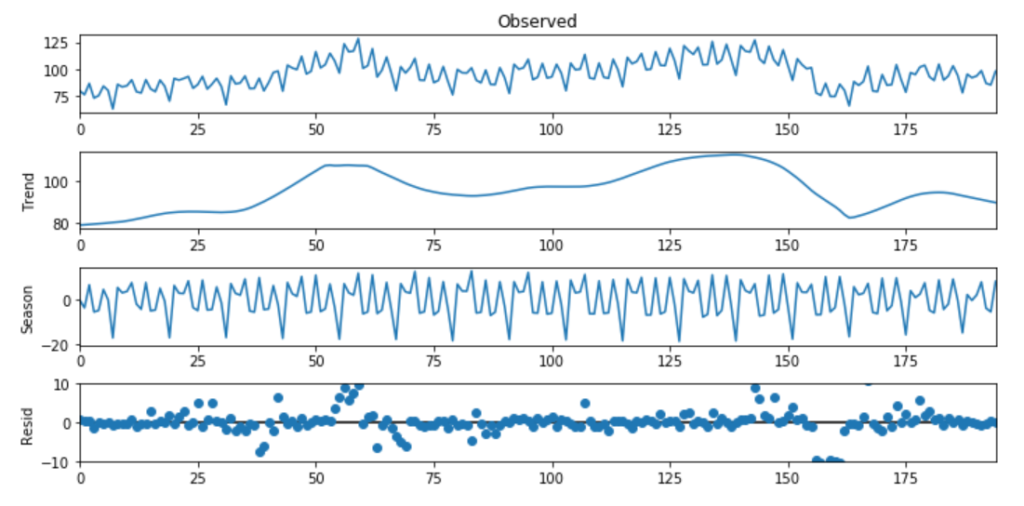
STL分解法
趋势周期平滑度
季节性变化率
可以控制对用户异常值或异常值的鲁棒性。这样你就可以控制离群值对季节性和趋势性的影响。
Import pandas as pdImport seaborn as snsImport matplotlib.pyplot as pltFrom statsmodels.tsa.seasonal import STLelecequip =read_csv(r"C:/Users/datas/python/data/elecequip.csv")stl = STL(elecequip, period=12, robust=True)res_robust = stl.fit()fig = res_robust.plot()
时间序列预测的基本方法
PYTHON中的简单移动平均(SMA)
为什么使用简单移动平均?
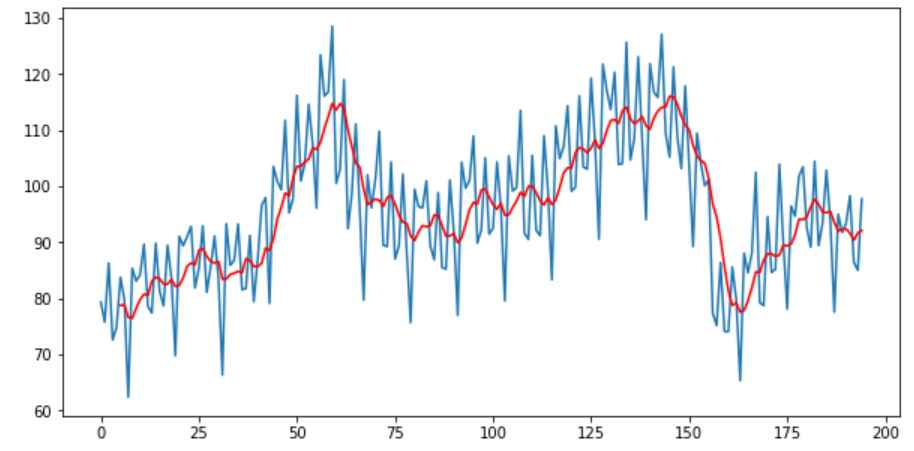
Import pandas as pdfrom matplotlib import pyplotelecequip = pd.read_csv(r"C:/Users/datas/python/data/elecequip.csv")# Taking moving average of last 6 obsrolling = elecequip.rolling(window=6)rolling_mean = rolling.mean()# plot the two seriespyplot.plot(elecequip)pyplot.plot(rolling_mean, color='red')pyplot.show()
elecequip["x"].rolling(window=3, center=True).mean()
PYTHON中的加权移动平均(WMA)
import randomrand = [random.randint(1, i) for i in range(100,110)]data = {}data["Sales"] = randdf = pd.DataFrame(data)weights = np.array([0.5, 0.25, 0.10])sum_weights = np.sum(weights)df['WMA']=(df['Sales'].rolling(window=3, center=True).apply(lambda x: np.sum(weights*x)/sum_weights, raw=False))print(df['WMA'])
PYTHON中的指数移动平均(EMA)
import numpy as npimport pandas as pdimport matplotlib.pyplot as pltfrom statsmodels.tsa.api import ExponentialSmoothingEMA_fit = ExponentialSmoothing(elecequip, seasonal_periods=12, trend='add', seasonal='add').fit(use_boxcox=True)fcast3 = EMA_fit.forecast(12)ax = elecequip.plot(figsize=(10,6), marker='o', color='black', title="Forecasts from Exponential Smoothing" )ax.set_ylabel("Electrical Equipment")ax.set_xlabel("Index")# For plotting fitted values# EMA_fit.fittedvalues.plot(ax=ax, style='--', color='red')EMA_fit.forecast(12).rename('EMS Forecast').plot(ax=ax, style='--',marker='o', color='blue', legend=True)
1 2 3 4 | import numpy as np import pandas as pd import matplotlib.pyplot as plt from statsmodels.tsa.api import SimpleExpSmoothing, Holt |
什么是时间序列数据?
如何可视化和更深入地识别数据模式(如果有)?
介绍了可加性和可乘性时间序列模型。
研究了Python中分解时间序列的不同方法。
最后,我们学习了如何在Python中运行一些非常基本的方法,例如移动平均(MA),加权移动平均(WMA),指数平滑模型(ESM)及其变体,例如SESM和Hotl。
原文标题:
TIME SERIES FORECAST AND DECOMPOSITION – 101 GUIDE PYTHON
原文链接:
https://datasciencebeginners.com/2020/11/25/time-series-forecast-and-decomposition-101-guide-python/
译者简介

王闯(Chuck),台湾清华大学资讯工程硕士。曾任奥浦诺管理咨询公司数据分析主管,现任尼尔森市场研究公司数据科学经理。很荣幸有机会通过数据派THU公众号平台和各位老师、同学及同行前辈们交流学习。
翻译组招募信息
工作内容:需要一颗细致的心,将选取好的外文文章翻译成流畅的中文。如果你是数据科学/统计学/计算机类的留学生,或在海外从事相关工作,或对自己外语水平有信心的朋友欢迎加入翻译小组。
你能得到:定期的翻译培训提高志愿者的翻译水平,提高对于数据科学前沿的认知,海外的朋友可以和国内技术应用发展保持联系,THU数据派产学研的背景为志愿者带来好的发展机遇。
其他福利:来自于名企的数据科学工作者,北大清华以及海外等名校学生他们都将成为你在翻译小组的伙伴。
点击文末“阅读原文”加入数据派团队~
转载须知
如需转载,请在开篇显著位置注明作者和出处(转自:数据派ID:DatapiTHU),并在文章结尾放置数据派醒目二维码。有原创标识文章,请发送【文章名称-待授权公众号名称及ID】至联系邮箱,申请白名单授权并按要求编辑。
发布后请将链接反馈至联系邮箱(见下方)。未经许可的转载以及改编者,我们将依法追究其法律责任。

点击“阅读原文”拥抱组织
