


本文为大家介绍了如何在Python中使用由Facebook开发的Prophet库进行自动化的时间序列预测,以及如何评估一个由Prophet库所搭建的时间序列预测模型的性能。
Prophet是一个由Facebook开发的开源库,专为单变量时间序列数据的自动化预测而设计;
如何拟合Prophet模型,并使用模型进行样本内及样本外预测;
如何使用通过留出法所划分出的不参与训练的数据集来评估Prophet模型的性能。
Prophet预测库介绍
汽车销量数据集
加载数据并进行统计描述
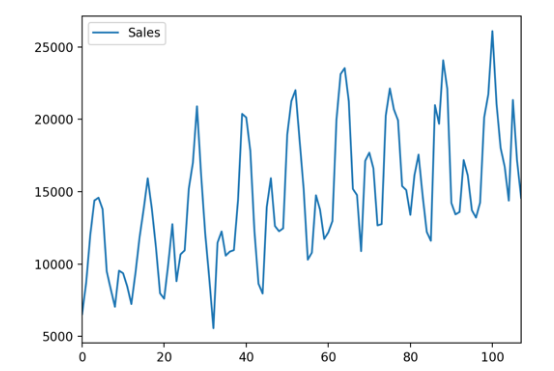
加载数据并进行图表绘制
使用Prophet进行汽车销量预测
拟合Prophet模型
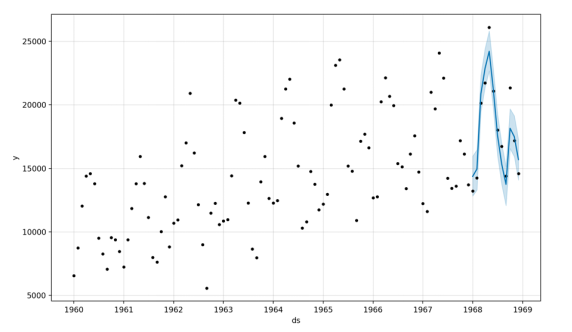
进行样本内预测
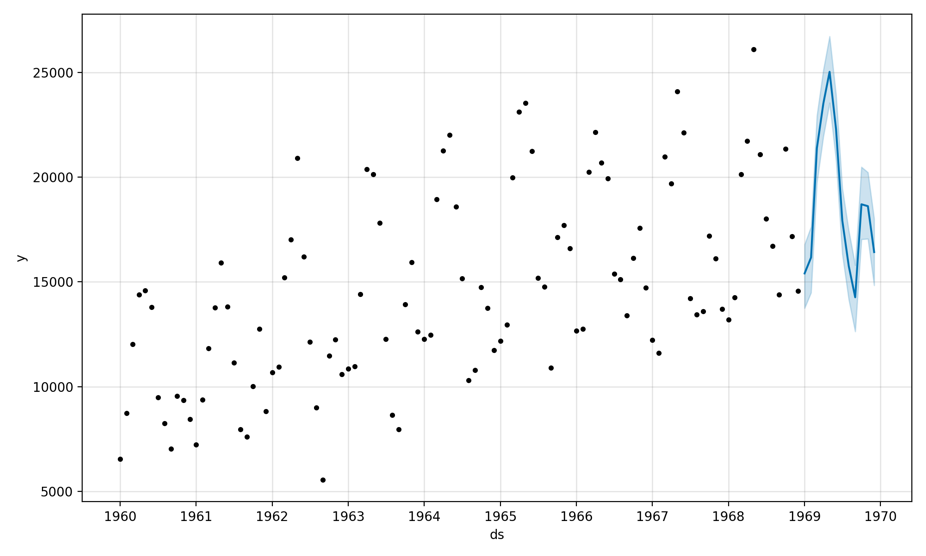
进行样本外预测
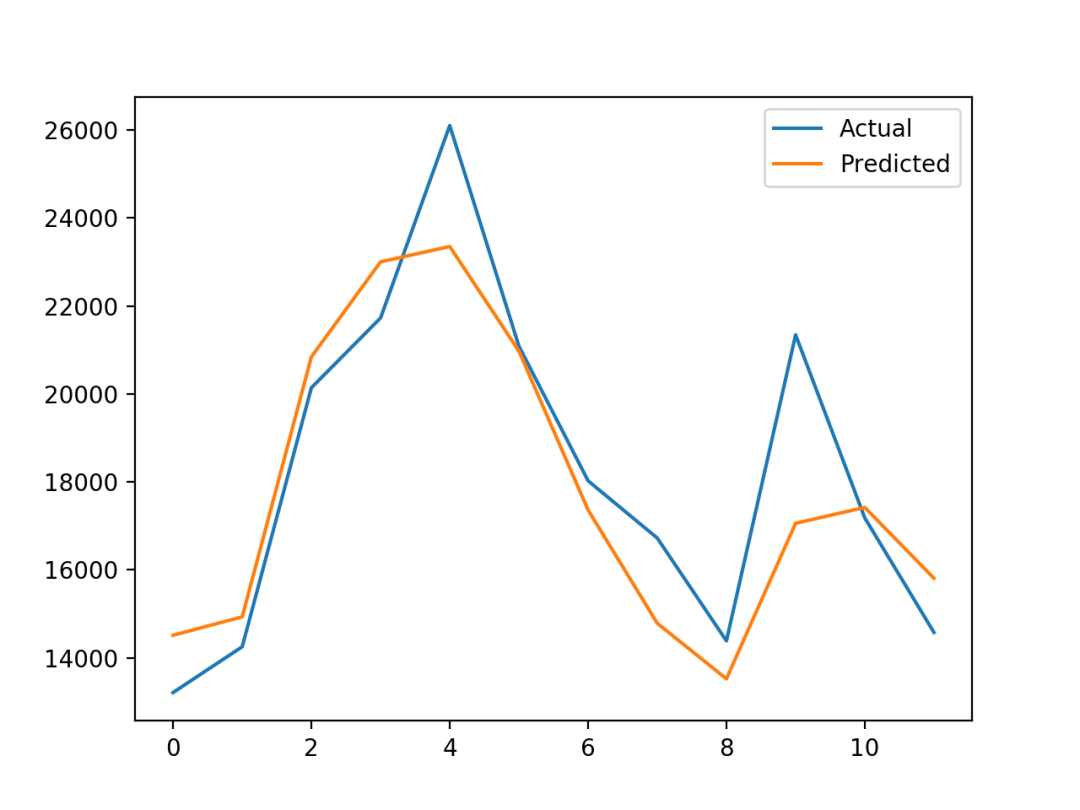
手动对预测模型进行性能评估
sudo pip install fbprophet
# check prophet versionimport fbprophet# print version numberprint('Prophet %s' % fbprophet.__version__)
Prophet 0.5
Monthly Car Sales Dataset (csv)
https://raw.githubusercontent.com/jbrownlee/Datasets/master/monthly-car-sales.csv
Monthly Car Sales Dataset Description
https://raw.githubusercontent.com/jbrownlee/Datasets/master/monthly-car-sales.names
# load the car sales datasetfrom pandas import read_csv# load datapath = 'https://raw.githubusercontent.com/jbrownlee/Datasets/master/monthly-car-sales.csv'df = read_csv(path, header=0)# summarize shapeprint(df.shape)# show first few rowsprint(df.head())
(108, 2)Month Sales0 1960-01 65501 1960-02 87282 1960-03 120263 1960-04 143954 1960-05 14587
# load and plot the car sales datasetfrom pandas import read_csvfrom matplotlib import pyplot# load datapath = 'https://raw.githubusercontent.com/jbrownlee/Datasets/master/monthly-car-sales.csv'df = read_csv(path, header=0)# plot the time seriesdf.plot()pyplot.show()
...# prepare expected column namesdf.columns = ['ds', 'y']df['ds']= to_datetime(df['ds'])
# fit prophet model on the car sales datasetfrom pandas import read_csvfrom pandas import to_datetimefrom fbprophet import Prophet# load datapath = 'https://raw.githubusercontent.com/jbrownlee/Datasets/master/monthly-car-sales.csv'df = read_csv(path, header=0)# prepare expected column namesdf.columns = ['ds', 'y']df['ds']= to_datetime(df['ds'])# define the modelmodel = Prophet()# fit the modelmodel.fit(df)
INFO:fbprophet:Disabling weekly seasonality. Run prophet with weekly_seasonality=True to override this.INFO:fbprophet:Disabling daily seasonality. Run prophet with daily_seasonality=True to override this.Initial log joint probability = -4.39613Iter log prob ||dx|| ||grad|| alpha alpha0 # evals Notes99 270.121 0.00413718 75.7289 1 1 120Iter log prob ||dx|| ||grad|| alpha alpha0 # evals Notes179 270.265 0.00019681 84.1622 2.169e-06 0.001 273 LS failed, Hessian reset199 270.283 1.38947e-05 87.8642 0.3402 1 299Iter log prob ||dx|| ||grad|| alpha alpha0 # evals Notes240 270.296 1.6343e-05 89.9117 1.953e-07 0.001 381 LS failed, Hessian reset299 270.3 4.73573e-08 74.9719 0.3914 1 455Iter log prob ||dx|| ||grad|| alpha alpha0 # evals Notes300 270.3 8.25604e-09 74.4478 0.3522 0.3522 456Optimization terminated normally:Convergence detected: absolute parameter change was below tolerance
...# define the period for which we want a predictionfuture = list()for i in range(1, 13):date = '1968-%02d' % ifuture.append([date])future = DataFrame(future)future.columns = ['ds']future['ds']= to_datetime(future['ds'])
...# summarize the forecastprint(forecast[['ds', 'yhat', 'yhat_lower', 'yhat_upper']].head())
...print(forecast[['ds', 'yhat', 'yhat_lower', 'yhat_upper']].head())# plot forecastmodel.plot(forecast)pyplot.show()
# make an in-sample forecastfrom pandas import read_csvfrom pandas import to_datetimefrom pandas import DataFramefrom fbprophet import Prophetfrom matplotlib import pyplot# load datapath = 'https://raw.githubusercontent.com/jbrownlee/Datasets/master/monthly-car-sales.csv'df = read_csv(path, header=0)# prepare expected column namesdf.columns = ['ds', 'y']df['ds']= to_datetime(df['ds'])# define the modelmodel = Prophet()# fit the modelmodel.fit(df)# define the period for which we want a predictionfuture = list()for i in range(1, 13):date = '1968-%02d' % ifuture.append([date])future = DataFrame(future)future.columns = ['ds']future['ds']= to_datetime(future['ds'])# use the model to make a forecastforecast = model.predict(future)# summarize the forecastprint(forecast[['ds', 'yhat', 'yhat_lower', 'yhat_upper']].head())# plot forecastmodel.plot(forecast)pyplot.show()
ds yhat yhat_lower yhat_upper0 1968-01-01 14364.866157 12816.266184 15956.5554091 1968-02-01 14940.687225 13299.473640 16463.8116582 1968-03-01 20858.282598 19439.403787 22345.7478213 1968-04-01 22893.610396 21417.399440 24454.6425884 1968-05-01 24212.079727 22667.146433 25816.191457
...# define the period for which we want a predictionfuture = list()for i in range(1, 13):date = '1969-%02d' % ifuture.append([date])future = DataFrame(future)future.columns = ['ds']future['ds']= to_datetime(future['ds'])
# make an out-of-sample forecastfrom pandas import read_csvfrom pandas import to_datetimefrom pandas import DataFramefrom fbprophet import Prophetfrom matplotlib import pyplot# load datapath = 'https://raw.githubusercontent.com/jbrownlee/Datasets/master/monthly-car-sales.csv'df = read_csv(path, header=0)# prepare expected column namesdf.columns = ['ds', 'y']df['ds']= to_datetime(df['ds'])# define the modelmodel = Prophet()# fit the modelmodel.fit(df)# define the period for which we want a predictionfuture = list()for i in range(1, 13):date = '1969-%02d' % ifuture.append([date])future = DataFrame(future)future.columns = ['ds']future['ds']= to_datetime(future['ds'])# use the model to make a forecastforecast = model.predict(future)# summarize the forecastprint(forecast[['ds', 'yhat', 'yhat_lower', 'yhat_upper']].head())# plot forecastmodel.plot(forecast)pyplot.show()
ds yhat yhat_lower yhat_upper0 1969-01-01 15406.401318 13751.534121 16789.9697801 1969-02-01 16165.737458 14486.887740 17634.9531322 1969-03-01 21384.120631 19738.950363 22926.8575393 1969-04-01 23512.464086 21939.204670 25105.3414784 1969-05-01 25026.039276 23544.081762 26718.820580
...# create test dataset, remove last 12 monthstrain = df.drop(df.index[-12:])print(train.tail())
...# calculate MAE between expected and predicted values for decembery_true = df['y'][-12:].valuesy_pred = forecast['yhat'].valuesmae = mean_absolute_error(y_true, y_pred)print('MAE: %.3f' % mae)
...# plot expected vs actualpyplot.plot(y_true, label='Actual')pyplot.plot(y_pred, label='Predicted')pyplot.legend()pyplot.show()
# evaluate prophet time series forecasting model on hold out datasetfrom pandas import read_csvfrom pandas import to_datetimefrom pandas import DataFramefrom fbprophet import Prophetfrom sklearn.metrics import mean_absolute_errorfrom matplotlib import pyplot# load datapath = 'https://raw.githubusercontent.com/jbrownlee/Datasets/master/monthly-car-sales.csv'df = read_csv(path, header=0)# prepare expected column namesdf.columns = ['ds', 'y']df['ds']= to_datetime(df['ds'])# create test dataset, remove last 12 monthstrain = df.drop(df.index[-12:])print(train.tail())# define the modelmodel = Prophet()# fit the modelmodel.fit(train)# define the period for which we want a predictionfuture = list()for i in range(1, 13):date = '1968-%02d' % ifuture.append([date])future = DataFrame(future)future.columns = ['ds']future['ds'] = to_datetime(future['ds'])# use the model to make a forecastforecast = model.predict(future)# calculate MAE between expected and predicted values for decembery_true = df['y'][-12:].valuesy_pred = forecast['yhat'].valuesmae = mean_absolute_error(y_true, y_pred)print('MAE: %.3f' % mae)# plot expected vs actualpyplot.plot(y_true, label='Actual')pyplot.plot(y_pred, label='Predicted')pyplot.legend()pyplot.show()
ds y91 1967-08-01 1343492 1967-09-01 1359893 1967-10-01 1718794 1967-11-01 1611995 1967-12-01 13713
MAE: 1336.814
Prophet Homepage
https://facebook.github.io/prophet/
Prophet GitHub Project
https://github.com/facebook/prophet
Prophet API Documentation
https://facebook.github.io/prophet/docs/
Prophet: forecasting at scale, 2017
https://research.fb.com/blog/2017/02/prophet-forecasting-at-scale/
Forecasting at scale, 2017
https://peerj.com/preprints/3190/
Car Sales Dataset
https://raw.githubusercontent.com/jbrownlee/Datasets/master/monthly-car-sales.csv
Package ‘prophet’, R Documentation
https://cran.r-project.org/web/packages/prophet/prophet.pdf
Prophet是一个由Facebook开发的开源库,专为单变量时间序列数据的自动化预测而设计;
如何拟合Prophet模型,并使用模型进行样本内及样本外预测;
如何使用通过留出法所划分出的不参与训练的数据集来评估Prophet模型的性能。
原文标题:
Time Series Forecasting With Prophet in Python
原文链接:
https://machinelearningmastery.com/time-series-forecasting-with-prophet-in-python/
译者简介

殷之涵(Jane),研究生毕业于康奈尔大学生物统计与数据科学专业,本科毕业于普渡大学精算与应用统计专业。目前在腾讯担任数据科学家,主要负责腾讯视频用户增长&市场营销数据科学方面的工作;此前在京东任数据分析师一年半,负责通过指标体系搭建、统计分析、数据挖掘和机器学习建模来驱动决策、制定并落地亿级用户的精细化运营策略。对数据科学充满兴趣和热情,希望通过多年勤恳深耕成长为真正的领域专家。
翻译组招募信息
工作内容:需要一颗细致的心,将选取好的外文文章翻译成流畅的中文。如果你是数据科学/统计学/计算机类的留学生,或在海外从事相关工作,或对自己外语水平有信心的朋友欢迎加入翻译小组。
你能得到:定期的翻译培训提高志愿者的翻译水平,提高对于数据科学前沿的认知,海外的朋友可以和国内技术应用发展保持联系,THU数据派产学研的背景为志愿者带来好的发展机遇。
其他福利:来自于名企的数据科学工作者,北大清华以及海外等名校学生他们都将成为你在翻译小组的伙伴。
点击文末“阅读原文”加入数据派团队~
转载须知
如需转载,请在开篇显著位置注明作者和出处(转自:数据派ID:DatapiTHU),并在文章结尾放置数据派醒目二维码。有原创标识文章,请发送【文章名称-待授权公众号名称及ID】至联系邮箱,申请白名单授权并按要求编辑。
发布后请将链接反馈至联系邮箱(见下方)。未经许可的转载以及改编者,我们将依法追究其法律责任。

点击“阅读原文”拥抱组织
