参考资料:
Hystrix GitHub 官方文档
https://github.com/Netflix/hystrixHystrix Wiki 文档
https://github.com/Netflix/Hystrix/wikispring Cloud 文档
https://cloud.spring.io/spring-cloud-static/Greenwich.SR1/single/spring-cloud.html#_circuit_breaker_hystrix_dashboard
Hystrix Dashboard
Hystrix Dashboard 界面
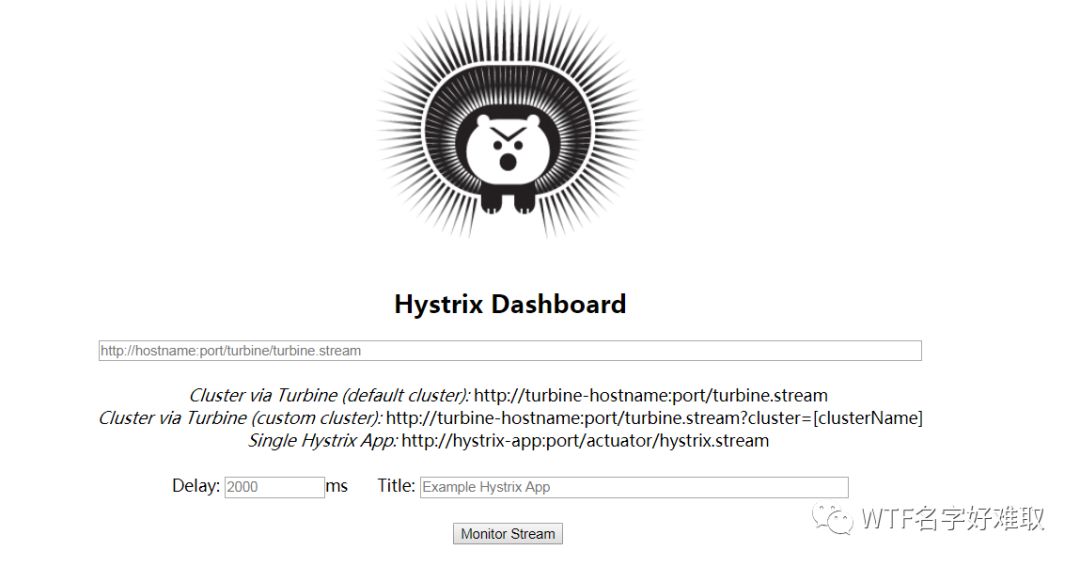
在 Hystrix Dashboard 界面中,我们能够知道有三种输入方式获取 Hystrix 监控信息
默认集群监控
Cluster via Turbine (default cluster): http://turbine-hostname:port/turbine.stream自定义集群监控
Cluster via Turbine (custom cluster): http://turbine-hostname:port/turbine.stream?cluster=[clusterName]单个Hystrix应用监控
Single Hystrix App: http://hystrix-app:port/actuator/hystrix.stream
Hystrix Dashboard 相关监控指标
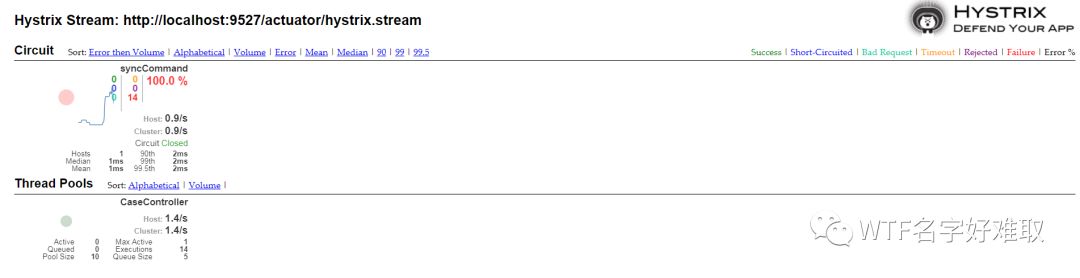
上图是 Hystrix Dashboard 监控的所有指标数据。这些指标数据分为两类: circuit 性能指标,Thread Pool 性能指标。
Circuit 性能指标
circuit 是针对接口级别的 Hystrix 监控数据。
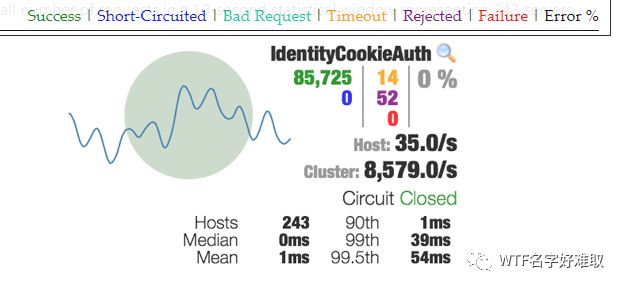
图中左上角的曲线和带有颜色的圆。
曲线代表的是 2分钟内的流量变化趋势。
带颜色的圆表示的是流量请求的健康程度。有:绿色,黄色,橙色,红色。根据颜色排列流量非成功次数越来越多。
图中右侧的数字信息在右上角有相应的解释,颜色也是一一对应。
Success 请求成功数
Short-Circuited 熔断数
Bad Request 错误请求数
Timeout 超时请求数
Rejected 线程池拒绝数
Failure 失败请求数
Error % 最近10s秒内错误比例
其他的指标信息
Host 机器的请求频率
Cluster 集群的请求频率
circuit 熔断器开启状态,open or closed
Hosts 集群主机数
Median 集群延迟中位数
Mean 集群延迟平均数
90th 百分之90 请求延迟
99th 百分之99 请求延迟
99.5th 百分之99.5 请求延迟
Thread Pool性能指标
线程指标:核心线程数,队列大小等。
搭建支持单应用 Hystrix 监控 Hystrix Dashboard 平台
搭建 Hystrix Dashboard 监控服务
step1、基于 spring boot 2.1.5 ,spring cloud Greenwich.SR1创建应用
step2、引入 Hystrix Dashboard 依赖
<dependency><groupId>org.springframework.cloud</groupId><artifactId>spring-cloud-starter-netflix-hystrix-dashboard</artifactId></dependency>
step3、启动类增加注解 @EnableHystrixDashboard
step4、application.properties 可以自定义其他的配置,如:端口信息等。
通过访问:http://localhost:{port}/hystrix 进入 Hystrix Dashboard 界面。
被监控服务配置
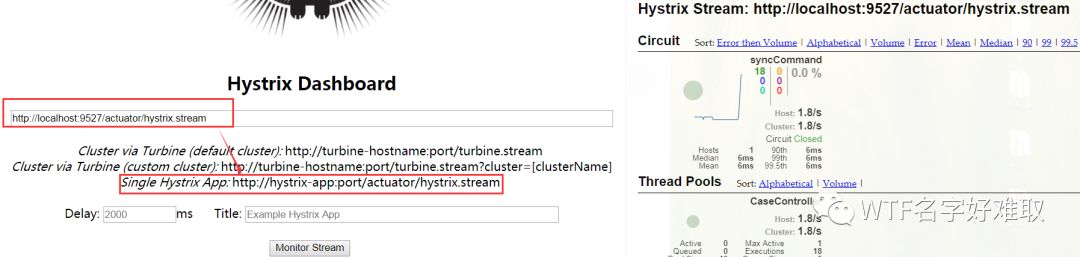
Hystrix Dashboard 工作原理是监听服务 http://localhost:port/actuator/hystrix.stream 监控信息流获取信息,然后根据获取信息进行图形化。所以被监控服务需要保证 actuator/hystrix.stream 接口能够正常提供访问。
step1、引入依赖
<dependency><groupId>org.springframework.boot</groupId><artifactId>spring-boot-starter-actuator</artifactId></dependency>
step2、application.properties 配置开启 hystrix.stream 端口访问
## web 端点访问 hystrix.stream
management.endpoints.web.exposure.include = hystrix.stream
启动 Hystrix Dashboard 和被监控服务,进入 Hystrix Dashboard 界面查看监控信息
Turbine 为 Hystrix Dashboard 提供聚合能力
简单使用 Hystrix Dash 只能够支持 单个应用的 actuator/hystrix.stream 接口数据监测获取与数据展示。无法满足分布式应用场景的应用。
为了能够满足分布式的场景,需要使用到 Turbine 。通过 Turbine 聚合多个 actuator/hystrix.stream 传递的数据并进行展示。
使用 Turbine 为 Hystrix Dashboard 提供聚合能力之后,Hystrix Dashboard 能够提供无论是单应用还是集群应用的 Hystrix 监控展示。
注意: Turbine 默认使用 Eureka 进行服务实例的获取。
搭建项目
step1、项目搭建过程,同上面的 Hystrix Dashboard 一样。在其的基础上,增加新的依赖
<!-- turbine  -->
<dependency>
    <groupId>org.springframework.cloud</groupId>
    <artifactId>spring-cloud-starter-netflix-turbine</artifactId>
</dependency>
step2、准备两个集成 hystrix 的应用。分别为:应用1 和 应用2。
应用1:turbine 相关配置
spring.application.name=hystrix-in-common-use-config
eureka.instance.metadata-map.cluster = SINGLE_HYSTRIX
应用2:turbine 相关配置
spring.application.name = consumer
eureka.instance.metadata-map.cluster = FEIGN_HYSTRIX
step3、hystrix dashboard turbine 相关配置
turbine.aggregator.cluster-config = FEIGN_HYSTRIX,SINGLE_HYSTRIX
turbine.app-config                = hystrix-in-common-use-config,consumer
turbine.cluster-name-expression   = metadata['cluster']
step4、测试
测试准备: 启动四个 Hystrix 服务实例,提供 Hystrix 监控信息。
实例一:启动应用1,端口号 9527
实例二:启动应用1,端口号 9528
实例三:启动应用2,端口号 9529
实例四:修改应用2配置,修改 eureka.instance.metadata-map.cluster = FEIGN_HYSTRIX 为 eureka.instance.metadata-map.cluster = SINGLE_HYSTRIX 。然后启动一个实例,端口号 9530。
表格:提供 Hystrix 监控信息的服务实例,以及 Hystrix 监控集群信息配置
| 端口号 | 从属 Hystrix 监控集群 | 项目实例 | |
|---|---|---|---|
| 实例一 | 9527 | SINGLE_HYSTRIX | 应用1 |
| 实例二 | 9528 | SINGLE_HYSTRIX | 应用1 |
| 实例三 | 9529 | FEIGN_HYSTRIX | 应用2 |
| 实例四 | 9530 | SINGLE_HYSTRIX | 应用2 |
表格:应用存在的 Hystrix 方法调用
| Hystrix调用方法 | |
|---|---|
| 应用1 | UserClient#saveUser、UserClient#queryUserByUserId、FeignHystrixController#feignDemo |
| 应用2 | CaseController#syncCommand |
测试一、查看SINGLE_HYSTRIX集群监控数据
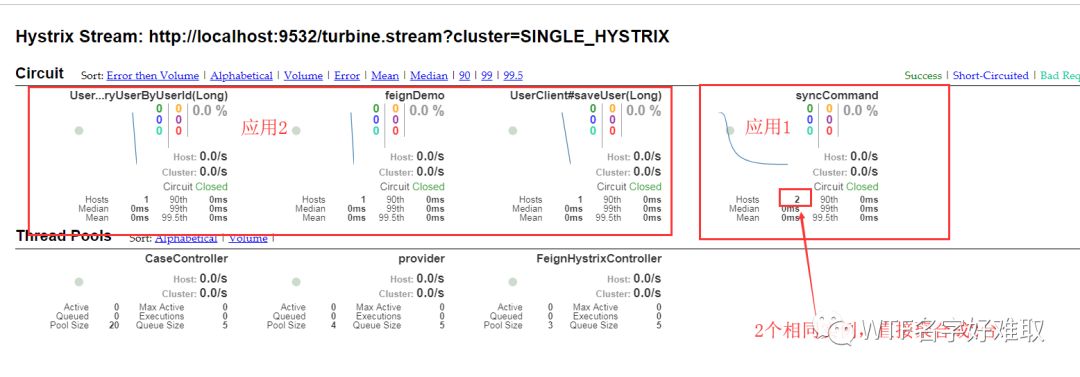
通过查看 SINGLE_HYSTRIX 能够得到
1、多个提供不同服务的应用,指定相同的 turbine 集群名称, Hystrix board 能够针对应用的不同接口进行整合展示。如:应用 1和 应用 2
2、多个提供统一服务的应用,指定相同的 turbine 集群名称, Hystrix board 会将应用的数据聚合成 1个数据进行展示。如:应用 1
测试二、查看 FEIGN_HYSTRIX 集群监控数据
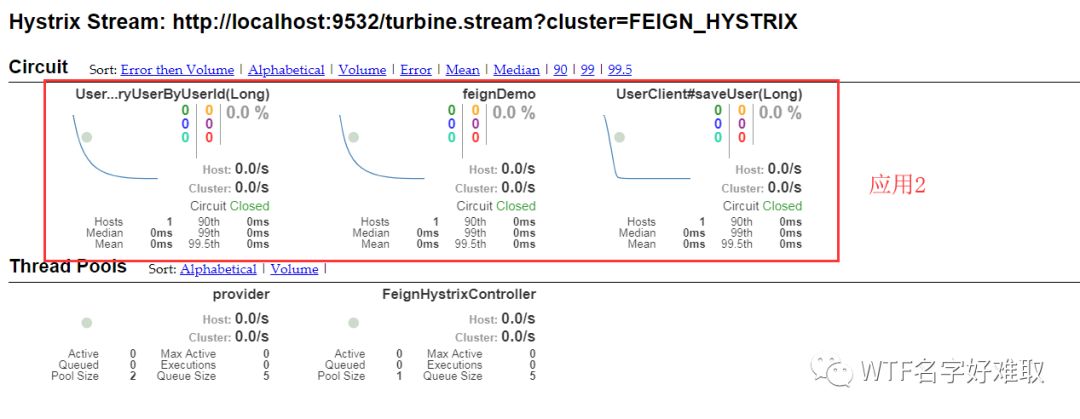
通过查看 FEIGN_HYSTRIX 能够得到
单机机器,只要给其指定一个 turbine 专用的集群名称,就能够实现单机的监测。且在后期进行水平扩容的时候,能够直接进行数据聚合展示。
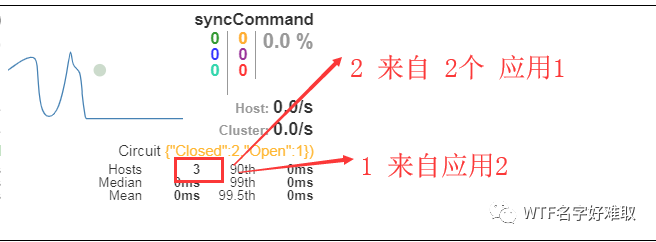
Hystrix Dashboard 是通过 API 接口方法名进行数据汇总展示。
多个应用定义了相同的请求方法名,这几个应用 Hystrix Dashboard 聚合查看,不同的应用相同的方法名,会被聚合成一个统计信息。所以在开发中,需要尽量避免简单方法命名,尽量根据业务场景进行命名。
-- END --

长按二维码 ▲
关注 [ WTF名字好难取 ] 公众号
往期回顾