


这是一则来自客户现场的真实案例,客户现场人员在通过PL/SQL Developer客户端工具创建索引时出现ORA-04030错误,导致索引创建失败。但是通过SQL*Plus重新执行创建索引语句却能够成功。为什么会出现这种错误和执行差异呢?请跟随我们的思路来一步步地了解这个案例的解析过程。
1 聚集数据的信息采集和分析
首先,了解ORA-04030错误的原因。ORA-04030错误引起的原因大概有以下几种情况。
(1)是否有足够的可用内存?
查看操作系统内存使用情况。
+-topas_nmon--r=Resources--------Host=gisdata2-------Refresh=2 secs---10:03.50------------+
| Memory ---------------------------------------------------------------------------|
|          Physical  PageSpace |        pages/sec  In     Out | FileSystemCache           |
|% Used       87.7%      2.6%  | to Paging Space   0.5    0.0 | (numperm)  4.6%           |
|% Free       12.3%     97.4%  | to File System    0.0    0.0 | Process   66.1%           |
|MB Used   55450.2MB   523.7MB | Page Scans        0.0        | System    17.0%           |
|MB Free    7781.6MB 19956.3MB | Page Cycles       0.0        | Free      12.3%           |
|Total(MB) 63231.9MB 20480.0MB | Page Steals       0.0        |           ------          |
|                                 | Page Faults    2110.3        | Total    100.0%            |
|--------------------------------------------------------- | numclient  4.6%          |
|Min/Maxperm     3065MB(  5%)  9195MB( 15%) <--% of RAM       | maxclient 15.0%         |
|Min/Maxfree    3000   4000       Total Virtual   81.7GB      | User      67.7%            |
|Min/Maxpgahead    2      8    Accessed Virtual   50.8GB 62.2%| Pinned    19.8%          |
|                                                             | lruable pages   15692064.0|
|-----------------------------------------------------------------------------------|
查看当时出故障的服务器资源,可以看到剩余内存还有7.7GB左右,说明在操作系统层面还有足够多的可用内存。
(2)是否设置了Oracle的限制?
查看数据库中与PGA相关的设置。
SQL> show parameter PGA
NAME                                 TYPE                             VALUE
------------------------------------ ----------------- ------------------------------
pga_aggregate_target                 big integer                      8400M
SQL> select * from v$pgastat;
NAME                                                                  VALUE UNIT
------------------------------------------------------------- ---------- ------------
aggregate PGA target parameter                                   8808038400 bytes
aggregate PGA auto target                                        7288095744 bytes
global memory bound                                               880803840 bytes
total PGA inuse                                                   720201728 bytes
total PGA allocated                                               985562112 bytes
maximum PGA allocated                                            2692780032 bytes   ---实际分配最大内存  2568.03516MB
total freeable PGA memory                                         163905536 bytes
process count                                                           414
max processes count                                                     529
PGA memory freed back to OS                                      2.4854E+11 bytes
total PGA used for auto workareas                                  10177536 bytes
maximum PGA used for auto workareas                               642154496 bytes
total PGA used for manual workareas                                       0 bytes
maximum PGA used for manual workareas                                537600 bytes
over allocation count                                                     0
bytes processed                                                  5.7321E+11 bytes
extra bytes read/written                                         2125827072 bytes
cache hit percentage                                                  99.63 percent
recompute count (total)                                               61401
SQL> SELECT x.ksppinm NAME, y.ksppstvl VALUE, x.ksppdesc describ
  2  FROM SYS.x$ksppi x, SYS.x$ksppcv y
  3  WHERE x.indx = y.indx
  4  AND x.ksppinm LIKE '%_pga_max_size%';
NAME                           VALUE                DESCRIB
------------------------------  -----------------------------------------------------
_pga_max_size         1761607680       Maximum size of the PGA memory for one process
SQL> SELECT x.ksppinm NAME, y.ksppstvl VALUE, x.ksppdesc describ
  2  FROM SYS.x$ksppi x, SYS.x$ksppcv y
  3  WHERE x.indx = y.indx
  4  AND x.ksppinm LIKE '%_smm_max_size%';
NAME                           VALUE                DESCRIB
------------------------------ ------ ------------------------------------------------
_smm_max_size                860160              maximum work area size in auto mode (serial)
从上面的内容可以看到PGA设置的大小为8400M,根据单个会话使用PGA的期望尺寸(也可以认为是实际分配的最大尺寸)计算公式是:min(5%pga_aggregate_target,50%_pga_max_size, _smm_max_size),可以简单计算下min(5%*8400M,50%1680M,840M)=420M(其中_pga_max_size的单位为bytes,_smm_max_size的单位为kb),即单个会话能使用PGA的期望尺寸为420M,那报错的会话是否超过了该限制呢?
查看ORA-04030报错的trace文件如下所示。
TOP 10 MEMORY USES FOR THIS PROCESS
---------------------------------------
98%  109 MB, 1797 chunks: "permanent memory          "  SQL
         sort subheap    ds=1108b67f0  dsprt=11048a508
 1% 1493 KB, 1779 chunks: "free memory               "
         session heap    ds=11047a818  dsprt=11019eae0
 0%  193 KB,  26 chunks: "permanent memory          "
         pga heap        ds=110072eb0  dsprt=0
 0%   82 KB,   6 chunks: "frame segment             "  SQL
         kxs-heap-f      ds=11048a8c8  dsprt=11047a818
 0%   45 KB,   4 chunks: "permanent memory          "
         session heap    ds=11047a818  dsprt=11019eae0
 0%   35 KB,  11 chunks: "kzctxhugi2                "
         session heap    ds=11047a818  dsprt=11019eae0
 0%   33 KB,   1 chunk : "free memory               "
         top call heap   ds=11019e8c0  dsprt=0
 0%   24 KB,  11 chunks: "koh-kghu session heap     "
         session heap    ds=11047a818  dsprt=11019eae0
 0%   22 KB,   1 chunk : "Fixed Uga                 "
         pga heap        ds=110072eb0  dsprt=0
 0%   20 KB,   5 chunks: "kxsFrame4kPage            "
         session heap    ds=11047a818  dsprt=11019eae0

=======================================
PRIVATE MEMORY SUMMARY FOR THIS PROCESS
---------------------------------------
******************************************************
PRIVATE HEAP SUMMARY DUMP
111 MB total:
   111 MB commented, 194 KB permanent
    45 KB free (0 KB in empty extents),
     111 MB,   1 heap:    "session heap   "
------------------------------------------------------
Summary of subheaps at depth 1
111 MB total:
   109 MB commented, 55 KB permanent
  1513 KB free (1 KB in empty extents),
     2 KB uncommented freeable with mark,      110 MB,   1 heap:    "kxs-heap-w    "    1490 KB free held
------------------------------------------------------
Summary of subheaps at depth 2
109 MB total:
   109 MB commented, 10 KB permanent
    14 KB free (4 KB in empty extents),
     0 KB uncommented freeable with mark,      109 MB,   1 heap:    "sort subheap   "
------------------------------------------------------
Summary of subheaps at depth 3
109 MB total:
     0 KB commented, 109 MB permanent
     2 KB free (0 KB in empty extents),
==========================================
INSTANCE-WIDE PRIVATE MEMORY USAGE SUMMARY
-------------------------
Top 10 processes:
-------------------------
(percentage is of 693 MB total allocated memory)
16% pid 168: 111 MB used of 111 MB allocated  <= CURRENT PROC
 6% pid 3: 43 MB used of 43 MB allocated
 2% pid 24: 402 KB used of 12 MB allocated (12 MB freeable)
 2% pid 33: 532 KB used of 12 MB allocated (11 MB freeable)
 2% pid 7: 11 MB used of 11 MB allocated
 2% pid 8: 11 MB used of 11 MB allocated
 2% pid 9: 11 MB used of 11 MB allocated
 2% pid 10: 11 MB used of 11 MB allocated
 2% pid 11: 11 MB used of 11 MB allocated
 2% pid 12: 11 MB used of 11 MB allocated
从以上的trace文件中可以看到,报错的进程实际分配的进程只有111MB,远远未达到420MB,说明并非是由于Oracle自身的限制引起的ORA-04030报错。
(3)哪个进程需要的内存过多?
上一个是否是由于Oracle自身限制引起的解释中,已经可以从trace文件中看到,消耗最多内存的进程就是报ORA-04030的进程,消耗的内存为110MB,并未发现其他更消耗内存的进程。
(4)是否设置了操作系统限制?
查看操作系统限制,Oracle用户的限制。
$ ulimit -a
time(seconds)        unlimited
file(blocks)         unlimited
data(kbytes)         unlimited
stack(kbytes)        4194304
memory(kbytes)       unlimited
coredump(blocks)     unlimited
nofiles(descriptors) unlimited
threads(per process) unlimited
processes(per user)  unlimited

root用户的限制。
gisdata2@root[/]ulimit -a
time(seconds)        unlimited
file(blocks)         unlimited
data(kbytes)         131072
stack(kbytes)        32768
memory(kbytes)       unlimited
coredump(blocks)     unlimited
nofiles(descriptors) unlimited
threads(per process) unlimited
processes(per user)  unlimited
从上面root和oracle的limit限制来看,root用户的data(kbytes)的限定值得关注,该属性的意义是soft data segment size in blocks(进程数据段大小限制)。
2 聚焦疑点的跟踪测试与验证
现在做一个反向测试:利用SQL*Plus工具创建索引,创建成功。
问题来了,为何SQL*Plus会成功,PL/SQL Developer却会失败?
通过PL/SQL Developer工具创建索引时报ORA-04030错误,但是通过SQLPlus创建却能成功,两者除了使用的工具不同,还有就是连接的方式不同(PL/SQL Developer是通过监听程序建立的进程连接,而SQLPlus是在数据库服务器上直接创建创建的连接,绕过了监听程序建立的进程)。
从连接工具和方式的不同得到了不一样的结果,如何来验证到底是连接工具的问题还是连接方式的引起的报错?
由于PL/SQL Developer只能通过监听的方式进行连接,但是SQL*Plus可以通过监听或则直接连接两种方式进行,所以先对连接方式进行测试。
通过SQL*Plus以tnsnames.ora标签名的方式通过监听进行连接,并执行创建索引报错的语句,发现错误依然存在,但是如果不通过监听而直接连接是不会报错的,说明跟是否通过监听进行连接有很大的关系。
为何会受监听的影响?
在Oracle RAC环境中,由于crs的启停是通过root用户进行的。
gisdata2@root[/]ps -ef|grep init
    root         1        0    0   Aug 31      - 18:24 /etc/init
    root  5046686        1    0   Jul 18      -  0:00 /bin/sh /etc/init.crsd run
    root  5702082 27066830   0   Jul 18      -  0:00 /bin/sh /etc/init.cssd oclsomon
    root  6554098 27066830   0   Jul 18      -  0:00 /bin/sh /etc/init.cssd daemon
    root 24969600        1    0   Jul 18      -  0:00 /bin/sh /etc/init.evmd run
    root 27066830        1   1   Jul 18      -  8:07 /bin/sh /etc/init.cssd fatal
    root 40108312 18940178   0 10:57:45  pts/1  0:00 grep init
所以在crs会继承root用户的limit属性,当通过crs或则srvctl命令启动监听时,也会继承root用户相应的limit属性,即data(kbytes)为131072。如何验证该推断?
现在通过监听的形式进行连接。
$ SQLplus sys/password@gissc2 as sysdba
SQL*Plus: Release 10.2.0.5.0 - Production on Mon Jul 20 17:20:02 2015
Copyright (c) 1982, 2010, Oracle.  All Rights Reserved.

SQL> select * from v$mystat where rownum<2;
       SID STATISTIC#      VALUE
---------- ---------- ----------
      1427          0          1
SQL> select spid from v$process where addr =(select paddr from v$session where sid=1427);
SPID
------------
10158446                 -----该连接的操作系统进程号
通过dbx工具查看该进程的limit信息:
$ dbx -a 10158446
Waiting to attach to process 10158446 ...
Successfully attached to oracle.
warning: Directory containing oracle could not be determined.
Apply 'use' command to initialize source path.

Type 'help' for help.
reading symbolic information ...
stopped in read at 0x90000000002e294 ($t1)
0x90000000002e294 (read+0x274) e8410028          ld   r2,0x28(r1)
 (dbx) proc rlimit
rlimit name:          rlimit_cur               rlimit_max       (units)
 RLIMIT_CPU:         (unlimited)             (unlimited)        sec
 RLIMIT_FSIZE:       (unlimited)             (unlimited)        bytes
 RLIMIT_DATA:          134217728             (unlimited)        bytes
 RLIMIT_STACK:          33554432              4294967296        bytes
 RLIMIT_CORE:        (unlimited)             (unlimited)        bytes
 RLIMIT_RSS:         (unlimited)             (unlimited)        bytes
 RLIMIT_AS:          (unlimited)             (unlimited)        bytes
 RLIMIT_NOFILE:            65534                   65536        descriptors
 RLIMIT_THREADS:     (unlimited)             (unlimited)        per process
 RLIMIT_NPROC:       (unlimited)             (unlimited)        per user
(dbx) quit
从上面的内容可以看到data属性的limit值为134217728 bytes即131072 kbytes与root的data(kbytes) 131072值完全吻合(stack的33554432 bytes即32768也与root的stack(kbytes) 32768一致),说明是通过监听建立连接进程的limit继承于root用户。
不通过监听进行连接:
$ SQLplus / as sysdba
SQL*Plus: Release 10.2.0.5.0 - Production on Mon Jul 20 17:16:09 2015
Copyright (c) 1982, 2010, Oracle.  All Rights Reserved.
SQL> select * from v$mystat where rownum<2;
       SID STATISTIC#      VALUE
---------- ---------- ----------
      1375          0          1
SQL> select spid from v$process where addr =(select paddr from v$session where sid=1375);
SPID
------------
47710432
跟踪这个服务器进程。
$ dbx -a 47710432
Waiting to attach to process 47710432 ...
Successfully attached to oracle.
warning: Directory containing oracle could not be determined.
Apply 'use' command to initialize source path.

Type 'help' for help.
reading symbolic information ...
stopped in read at 0x90000000002e294 ($t1)
0x90000000002e294 (read+0x274) e8410028          ld   r2,0x28(r1)
(dbx) proc rlimit
rlimit name:          rlimit_cur               rlimit_max       (units)
 RLIMIT_CPU:         (unlimited)             (unlimited)        sec
 RLIMIT_FSIZE:       (unlimited)             (unlimited)        bytes
 RLIMIT_DATA:        (unlimited)             (unlimited)        bytes
 RLIMIT_STACK:          33554432              4294967296        bytes
 RLIMIT_CORE:        (unlimited)             (unlimited)        bytes
 RLIMIT_RSS:         (unlimited)             (unlimited)        bytes
 RLIMIT_AS:          (unlimited)             (unlimited)        bytes
 RLIMIT_NOFILE:            65534             (unlimited)        descriptors
 RLIMIT_THREADS:     (unlimited)             (unlimited)        per process
 RLIMIT_NPROC:       (unlimited)             (unlimited)        per user
(dbx) quit
$
从上面的内容可以看到,如果不通过监听连接数据库创建的进程,它的data限制为unlimited的即无限制。
最后查看crs中监听的启动日志:
(/u01/oracle/product/10.2.0/db_1/log/gisdata2/racg中的日志文件ora.gisdata2.LISTENER_GISDATA2.lsnr.log)。
2015-07-18 14:16:54.676: [    RACG][1] [28508196][1][ora.gisdata2.LISTENER_GISDATA2.lsnr]: The command completed successfully

2015-07-18 14:47:09.078: [    RACG][1] [29950132][1][ora.gisdata2.LISTENER_GISDATA2.lsnr]:
LSNRCTL for IBM/AIX RISC System/6000: Version 10.2.0.5.0 - Production on 18-JUL-2015 14:47:08

Copyright (c) 1991, 2010, Oracle.  All rights reserved.
Starting /u01/oracle/product/10.2.0/db_1/bin/tnslsnr: please wait...
2015-07-18 14:47:09.079: [    RACG][1] [29950132][1][ora.gisdata2.LISTENER_GISDATA2.lsnr]: TNSLSNR for IBM/AIX RISC System/6000: Version 10.2.0.5.0 - Production
System parameter file is /u01/oracle/product/10.2.0/db_1/network/admin/listener.ora
Log messages written to /u01/oracle/product/10.2.0/db_1/network/log/listener_gisdata2.log

2015-07-18 14:47:09.079: [    RACG][1] [29950132][1][ora.gisdata2.LISTENER_GISDATA2.lsnr]: Listening on: (DESCRIPTION=(ADDRESS=(PROTOCOL=tcp)(HOST=10.176.30.81)(PORT=1521)))
Listening on: (DESCRIPTION=(ADDRESS=(PROTOCOL=tcp)(HOST=10.176.30.79)(PORT=1521)))
Listening on: (DESCRIPTION=(ADDRESS=(PROTOCOL=ipc)(KEY=EXTPROC)))
从以上的内容可以发现监听是由crs(或则是srvctl命令)启动的。
以及监听的运行时间:
$ lsnrctl status

LSNRCTL for IBM/AIX RISC System/6000: Version 10.2.0.5.0 - Production on 20-JUL-2015 16:31:03
Copyright (c) 1991, 2010, Oracle.  All rights reserved.
Connecting to (ADDRESS=(PROTOCOL=tcp)(HOST=)(PORT=1521))
STATUS of the LISTENER
------------------------
Alias                     LISTENER_GISDATA2
Version                   TNSLSNR for IBM/AIX RISC System/6000: Version 10.2.0.5.0 - Production
Start Date                18-JUL-2015 14:56:39
Uptime                    2 days 1 hr. 34 min. 24 sec
Trace Level               off
Security                  ON: Local OS Authentication
SNMP                      ON
Listener Parameter File   /u01/oracle/product/10.2.0/db_1/network/admin/listener.ora
Listener Log File         /u01/oracle/product/10.2.0/db_1/network/log/listener_gisdata2.log
监听启动的时间也与日志中的时间对应。
3 解析原理的问题总结与建议
那为什么CRS会使用ROOT用户的limit限制呢?
首先,得明白在Linux中,每触发任何一个事件时,系统都会为它定义一个进程,并且给予一个ID,即PID,同时会根据触发这个进程的用户与相关属性关系,给这个PID设置有效的权限,如图所示。
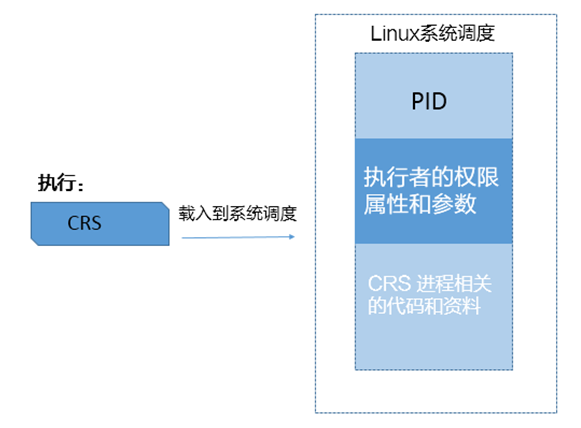
从上面可以知道,系统启动以后,CRS会自动启动,启动主要由/etc/init.d的几个脚本完成。而这些脚本的执行用户和用户组是root,也就是说当CRS启动时,Linux系统会根据UID/GID来判断资源属性和环境变量,那么这个进程所衍生的进程,也会沿用这些属性。
由此可以得到结论,由于监听是通过crs进行的启动,继承了root用户的limit限制,每个会话所能持有的内存大小最大不能超过128M,当通过监听进行数据库连接时,由监听创建的用户进程也将继承该limit限制,所以当通过P/LSQL Developer连接数据库(包括SQL*Plus等工具需要通过监听建立用户进程的情况),在创建索引过程中,当所请求的内存达到或非常接近该限制时,就会由于无法进一步申请更多的内存资源,抛出ORA-04030错误。
提示,如果是在Linux系统中,可以通过cat /proc/PID/limits命令进行查看单个进程的limit属性值,其中PID为要查看进程的进程号。
以ORA-04030案例进行延伸扩展,为避免该错误可参考以下建议。
(1)在安装Oracle软件创建数据库之前应该对主机层面的内核参数、limit限制等进行规范的修改,以避免类似问题的发生。
(2)配置合理的内存,例如物理内存和交换空间。
(3)使用自动PGA内存管理可降低ORA-04030错误的概率。
