


1、导入模块
 1import numpy as np
 2import pandas as pd
 3from datetime import datetime
 4from netCDF4 import Dataset
 5import xarray as xr
 6import matplotlib.pyplot as plt
 7from matplotlib.colors import from_levels_and_colors
 8from matplotlib.colors import ListedColormap
 9import numpy as np
10import cartopy.crs as ccrs
11import cartopy.feature as cfeature
12from cartopy.mpl.ticker import LongitudeFormatter, LatitudeFormatter
13from cartopy.mpl.gridliner import LATITUDE_FORMATTER, LONGITUDE_FORMATTER
14import shapely.geometry as sgeom
15import cmaps
16from glob import glob
17from copy import copy
18from wrf import to_np, getvar,get_cartopy, cartopy_xlim, cartopy_ylim, latlon_coords
19
20import warnings
21warnings.filterwarnings('ignore')
2、兰伯特投影添加经纬度标签
 1def find_side(ls, side):
 2    """
 3    Given a shapely LineString which is assumed to be rectangular, return the
 4    line corresponding to a given side of the rectangle.
 5    """
 6    minx, miny, maxx, maxy = ls.bounds
 7    points = {'left': [(minx, miny), (minx, maxy)],
 8              'right': [(maxx, miny), (maxx, maxy)],
 9              'bottom': [(minx, miny), (maxx, miny)],
10              'top': [(minx, maxy), (maxx, maxy)],}
11    return sgeom.LineString(points[side])
12
13def lambert_xticks(ax, ticks):
14    """Draw ticks on the bottom x-axis of a Lambert Conformal projection."""
15    te = lambda xy: xy[0]
16    lc = lambda t, n, b: np.vstack((np.zeros(n) + t, np.linspace(b[2], b[3], n))).T
17    xticks, xticklabels = _lambert_ticks(ax, ticks, 'bottom', lc, te)
18    ax.xaxis.tick_bottom()
19    ax.set_xticks(xticks)
20    ax.set_xticklabels([ax.xaxis.get_major_formatter()(xtick) for xtick in xticklabels])
21
22def lambert_yticks(ax, ticks):
23    """Draw ricks on the left y-axis of a Lamber Conformal projection."""
24    te = lambda xy: xy[1]
25    lc = lambda t, n, b: np.vstack((np.linspace(b[0], b[1], n), np.zeros(n) + t)).T
26    yticks, yticklabels = _lambert_ticks(ax, ticks, 'left', lc, te)
27    ax.yaxis.tick_left()
28    ax.set_yticks(yticks)
29    ax.set_yticklabels([ax.yaxis.get_major_formatter()(ytick) for ytick in yticklabels])
30
31def _lambert_ticks(ax, ticks, tick_location, line_constructor, tick_extractor):
32    """Get the tick locations and labels for an axis of a Lambert Conformal projection."""
33    outline_patch = sgeom.LineString(ax.outline_patch.get_path().vertices.tolist())
34    axis = find_side(outline_patch, tick_location)
35    n_steps = 30
36    extent = ax.get_extent(ccrs.PlateCarree())
37    _ticks = []
38    for t in ticks:
39        xy = line_constructor(t, n_steps, extent)
40        proj_xyz = ax.projection.transform_points(ccrs.Geodetic(), xy[:, 0], xy[:, 1])
41        xyt = proj_xyz[..., :2]
42        ls = sgeom.LineString(xyt.tolist())
43        locs = axis.intersection(ls)
44        if not locs:
45            tick = [None]
46        else:
47            tick = tick_extractor(locs.xy)
48        _ticks.append(tick[0])
49    # Remove ticks that aren't visible:
50    ticklabels = copy(ticks)
51    while True:
52        try:
53            index = _ticks.index(None)
54        except ValueError:
55            break
56        _ticks.pop(index)
57        ticklabels.pop(index)
58    return _ticks, ticklabels
3、读取土地利用
1ds = xr.open_dataset('/home/mw/input/wrf2128/wrfout_d02_2015-08-19_120000')
2ds.LANDUSEF
 1xarray.DataArray'LANDUSEF'Time: 1land_cat: 21south_north: 450west_east: 480
 2[4536000 values with dtype=float32]
 3Coordinates: (0)
 4Attributes:
 5FieldType :
 6104
 7MemoryOrder :
 8XYZ
 9units :
10category
11description :
12Noah-modified 21-category IGBP-MODIS landuse
13stagger :
14M
15sr_x :
161
17sr_y :
181
1landuse = ds.LU_INDEX
2landuse
output:
 1xarray.DataArray'LU_INDEX'Time: 1south_north: 450west_east: 480
 2[216000 values with dtype=float32]
 3Coordinates: (0)
 4Attributes:
 5FieldType :
 6104
 7MemoryOrder :
 8XY
 9units :
10category
11description :
12Dominant category
13stagger :
14M
15sr_x :
161
17sr_y :
181
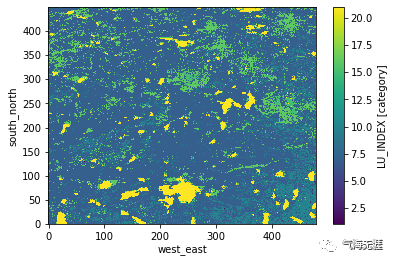
绘图
1ds.LU_INDEX[0].plot()
4、绘制土地利用
定义函数
 1def LU_MODIS21():
 2    C = np.array([
 3    [0,.4,0],          #  1 Evergreen Needleleaf Forest
 4    [0,.4,.2],         #  2 Evergreen Broadleaf Forest
 5    [.2,.8,.2],        #  3 Deciduous Needleleaf Forest
 6    [.2,.8,.4],        #  4 Deciduous Broadleaf Forest
 7    [.2,.6,.2],        #  5 Mixed Forests
 8    [.3,.7,0],         #  6 Closed Shrublands
 9    [.82,.41,.12],     #  7 Open Shurblands
10    [.74,.71,.41],     #  8 Woody Savannas
11    [1,.84,.0],        #  9 Savannas
12    [0,1,0],           #  10 Grasslands
13    [0,1,1],           #  11 Permanant Wetlands
14    [1,1,0],           #  12 Croplands
15    [1,0,0],           #  13 Urban and Built-up
16    [.7,.9,.3],        #  14 Cropland/Natual Vegation Mosaic
17    [1,1,1],           #  15 Snow and Ice
18    [.914,.914,.7],    #  16 Barren or Sparsely Vegetated
19    [.5,.7,1],         #  17 Water (like oceans)
20    [.86,.08,.23],     #  18 Wooded Tundra
21    [.97,.5,.31],      #  19 Mixed Tundra
22    [.91,.59,.48],     #  20 Barren Tundra
23    [0,0,.88]])        #  21 Lake
24
25
26    cm = ListedColormap(C)
27
28    labels = ['Evergreen Needleleaf Forest',
29              'Evergreen Broadleaf Forest',
30              'Deciduous Needleleaf Forest',
31              'Deciduous Broadleaf Forest',
32              'Mixed Forests',
33              'Closed Shrublands',
34              'Open Shrublands',
35              'Woody Savannas',
36              'Savannas',
37              'Grasslands',
38              'Permanent Wetlands',
39              'Croplands',
40              'Urban and Built-Up',
41              'Cropland/Natural Vegetation Mosaic',
42              'Snow and Ice',
43              'Barren or Sparsely Vegetated',
44              'Water',
45              'Wooded Tundra',
46              'Mixed Tundra',
47              'Barren Tundra',
48              'Lake']
49
50    return cm, labels
读取数据
1ncfile = Dataset('/home/mw/input/wrf2128/wrfout_d02_2015-08-19_120000')
2landuse = getvar(ncfile, 'LU_INDEX')
3lats, lons = latlon_coords(landuse)
4cart_proj = get_cartopy(landuse)
5cm, labels = LU_MODIS21()
绘图
1# Create a figure
2fig = plt.figure(figsize=(12,8))
3
4# Set the GeoAxes to the projection used by WRF
5ax = plt.axes(projection=cart_proj)
6
7# Use the data extent
8ax.set_xlim(cartopy_xlim(landuse))
9ax.set_ylim(cartopy_ylim(landuse))
10
11# Plot data
12im = plt.pcolormesh(to_np(lons), to_np(lats), to_np(landuse), vmin=1, vmax=len(labels)+1,
13 cmap=cm, transform=ccrs.PlateCarree())
14
15cbar = plt.colorbar(ax=ax, shrink=1)
16cbar.set_ticks(np.arange(1.5,len(labels)+1))
17cbar.ax.set_yticklabels(labels)
18
19# Add the gridlines
20ax.gridlines(color="black", linestyle="dotted")
21
22# add xticks and yticks
23xticks = list(np.arange(100,155,5))
24yticks = list(np.arange(10,55,5))
25fig.canvas.draw()
26ax.xaxis.set_major_formatter(LONGITUDE_FORMATTER)
27ax.yaxis.set_major_formatter(LATITUDE_FORMATTER)
28lambert_xticks(ax, xticks)
29lambert_yticks(ax, yticks)
30# Set the labelsize
31plt.tick_params(labelsize=15)
32# Add title
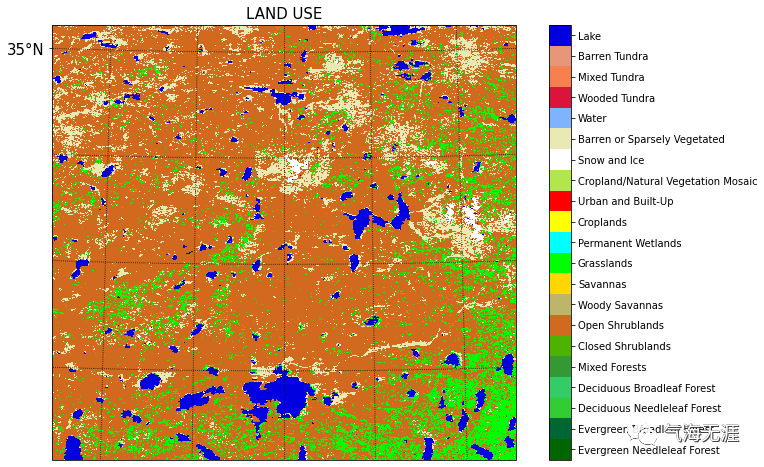
33plt.title('LAND USE', fontsize=15)
34print('土地利用绘制完毕')
output:
1土地利用绘制完毕
有问题可以到QQ群里进行讨论,我们在那边等大家。
QQ群号:854684131
文章转载自气海无涯,如果涉嫌侵权,请发送邮件至:contact@modb.pro进行举报,并提供相关证据,一经查实,墨天轮将立刻删除相关内容。
