


简书搬运系列:
小提琴图介绍
以下来自维基百科:
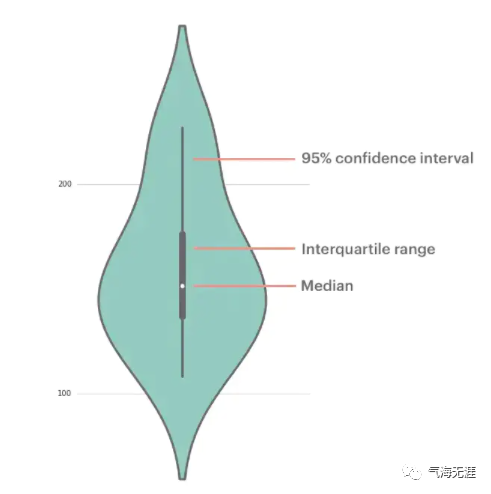
A violin plot is a method of plotting numeric data. It is similar to a box plot, with the addition of a rotated kernel density plot on each side.Violin plots are similar to box plots, except that they also show the probability density of the data at different values, usually smoothed by a kernel density estimator. Typically a violin plot will include all the data that is in a box plot: a marker for the median of the data; a box or marker indicating the interquartile range; and possibly all sample points, if the number of samples is not too high. A violin plot is more informative than a plain box plot. While a box plot only shows summary statistics such as mean/median and interquartile ranges, the violin plot shows the full distribution of the data. The difference is particularly useful when the data distribution is multimodal (more than one peak). In this case a violin plot shows the presence of different peaks, their position and relative amplitude.
方法有多种
1、matplotlib
https://matplotlib.org/api/_as_gen/matplotlib.axes.Axes.violinplot.html#matplotlib官网提供了最简单的小提琴图画图
Axes.matplotlib.violinplot(self, dataset, positions=None,vert=True, widths=0.5, showmeans=False, showextrema=True, showmedians=False, quantiles=None, points=100, bw_method=None, ***, data=None)
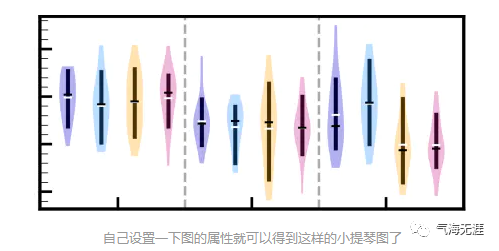
region=0ALL=[[],t1[region][6:25 ].values,t2[region][6:25 ].values,t3[region][6:25 ].values,t4[region][6:25 ].values,[],t1[region][46:65].values,t2[region][46:65].values,t3[region][46:65].values,t4[region][46:65].values,[],t1[region][66:85].values,t2[region][66:85].values,t3[region][66:85].values,t4[region][66:85].values,[],]fig =plt.figure(figsize=(6, 5))ax =fig.add_axes([0.3, 0.2, 1.5, 1])medianprops = dict(color="black",linewidth=2)bplot1 =ax.boxplot(wind_ALL, vert=True, # vertical box alignmentwhis=False,patch_artist=True, # fill with colorshowfliers =False, #showbox = True , #显示超出上限的异常值。showmeans =False , #平均值. 绿色交尖medianprops=medianprops,widths=0.5,autorange=True,# labels=labels) # will be used to label x-ticks
2、Seaborn
https://seaborn.pydata.org/generated/seaborn.violinplot.html#官网的参考文档永远是最好的学习工具
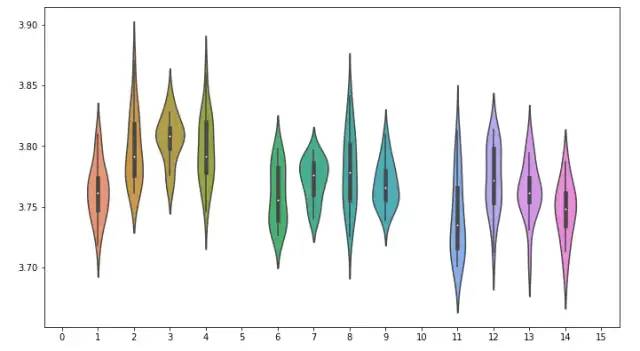
bplot1 =sns.violinplot(data=ALL)
总结
