


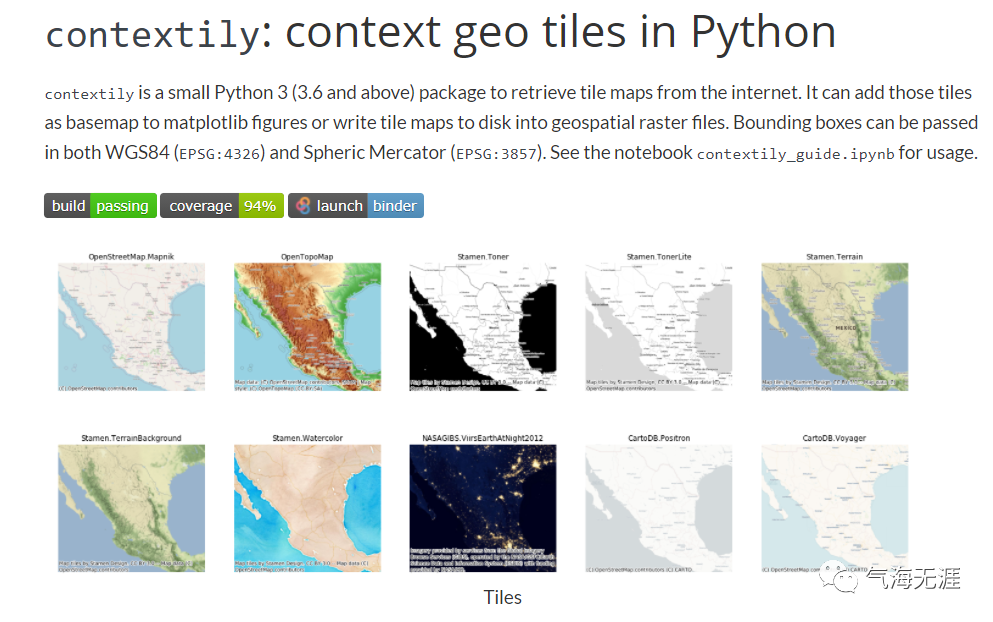
1https://contextily.readthedocs.io/en/latest/index.html
1、导入模块
1import geopandas as gpd
2import contextily as ctx
3import matplotlib.pyplot as plt
2、读取数据
1shanghai = gpd.read_file('shanghai_shp.zip').to_crs('EPSG:3857')
2shanghai
打印输出:

3、绘图
(1)直接绘制
1fig, ax = plt.subplots(figsize=(8, 8))
2ax = shanghai.plot(facecolor='none', edgecolor='black', ax=ax)
3ax.axis('off')
4plt.show()

(2)openstreetmap
1fig, ax = plt.subplots(figsize=(8, 8))
2ax = shanghai.plot(facecolor='none', edgecolor='black', ax=ax)
3ax.axis('off')
4ctx.add_basemap(ax,
5                source='https://{s}.tile.openstreetmap.fr/hot/{z}/{x}/{y}.png',
6                zoom=8)
7plt.show()

(3)公路底图
1fig, ax = plt.subplots(figsize=(8, 8))
2ax = shanghai.plot(facecolor='none', edgecolor='black', ax=ax)
3ax.axis('off')
4ctx.add_basemap(ax,
5                source='https://a.tile.thunderforest.com/mobile-atlas/{z}/{x}/{y}.png?apikey=41f4f936f1d148f69cbd100812875c88',
6                zoom=8)
7plt.show()

(4)Stamen-terrain
1fig, ax = plt.subplots(figsize=(8, 8))
2ax = shanghai.plot(facecolor='none', edgecolor='black', ax=ax)
3ax.axis('off')
4ctx.add_basemap(ax,
5                source='http://{s}.tile.stamen.com/terrain/{z}/{x}/{y}.jpg',
6                zoom=8)
7plt.show()

(5)Stamen-toner
1fig, ax = plt.subplots(figsize=(8, 8))
2ax = shanghai.plot(facecolor='none', edgecolor='red', ax=ax)
3ax.axis('off')
4ctx.add_basemap(ax,
5                source='http://{s}.tile.stamen.com/toner/{z}/{x}/{y}.png',
6                zoom=8)
7plt.show()

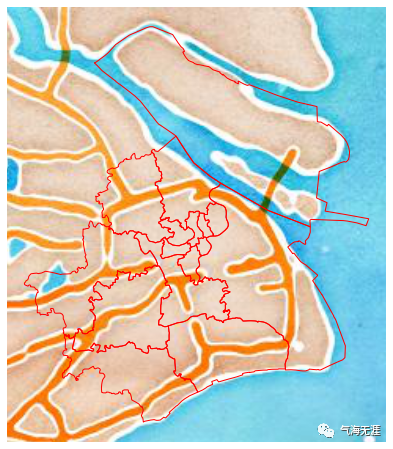
(6)Stamen-watercolor
1fig, ax = plt.subplots(figsize=(8, 8))
2ax = shanghai.plot(facecolor='none', edgecolor='red', ax=ax)
3ax.axis('off')
4ctx.add_basemap(ax,
5                source='http://{s}.tile.stamen.com/watercolor/{z}/{x}/{y}.jpg',
6                zoom=8)
7plt.show()
(7)sputnik
1fig, ax = plt.subplots(figsize=(8, 8))
2ax = shanghai.plot(facecolor='none', edgecolor='black', ax=ax)
3ax.axis('off')
4ctx.add_basemap(ax,
5                source='http://{s}.tiles.maps.sputnik.ru/{z}/{x}/{y}.png',
6                zoom=8)
7plt.show()

(8)thunderforest
1fig, ax = plt.subplots(figsize=(8, 8))
2ax = shanghai.plot(facecolor='none', edgecolor='black', ax=ax)
3ax.axis('off')
4ctx.add_basemap(ax,
5                source='https://c.tile.thunderforest.com/cycle/{z}/{x}/{y}.png?apikey=41f4f936f1d148f69cbd100812875c88',
6                zoom=8)
7plt.show()

有问题可以到QQ群里进行讨论,我们在那边等大家。
QQ群号:854684131
文章转载自气海无涯,如果涉嫌侵权,请发送邮件至:contact@modb.pro进行举报,并提供相关证据,一经查实,墨天轮将立刻删除相关内容。
