


1、准备工作
1import numpy as np
2import geopandas as gpd
3from shapely.geometry import Point
4from shapely.geometry import MultiLineString
5from shapely.ops import polygonize
6from geovoronoi import voronoi_regions_from_coords
7import matplotlib.pyplot as plt
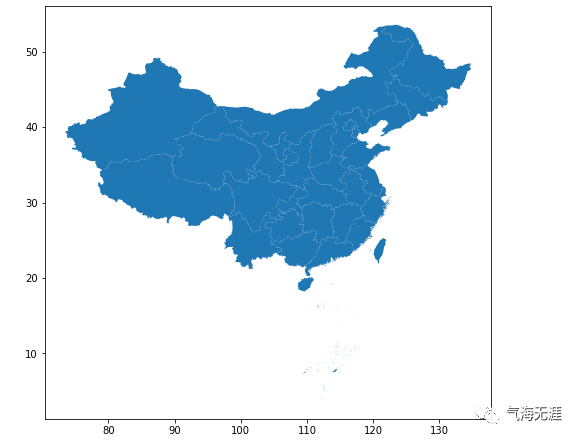
2.读取地图数据
1##绘制省界
2province = gpd.read_file('/home/kesci/input/data5246/China_provinces/China_provinces.shp')
3border = gpd.read_file('/home/kesci/input/data5246/China_land_territory/China_land_territory.shp')
4fig, ax = plt.subplots(figsize=(8, 8))
5province.plot(ax=ax)
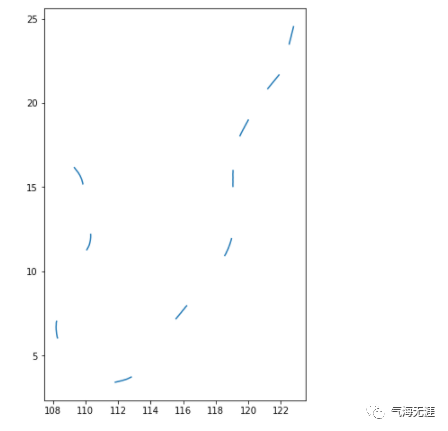
1## 绘制十段线
2line = gpd.read_file('/home/kesci/input/data5246/China_10-dash_line/China_10-dash_line.shp')
3fig, ax = plt.subplots(figsize=(8, 8))
4line.plot(ax=ax)
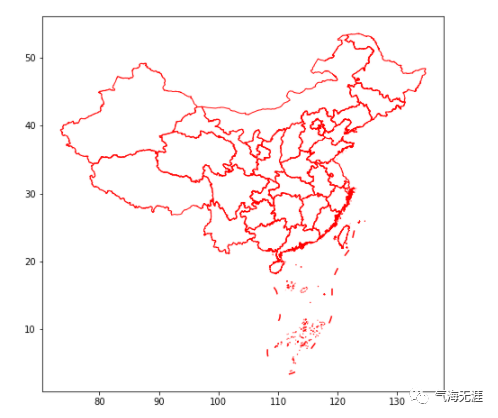
4.合并矢量数据
1china = province.geometry.append(line.geometry)
2fig, ax = plt.subplots(figsize=(8, 8))
3china.plot(ax=ax,facecolor='none',edgecolor='red')
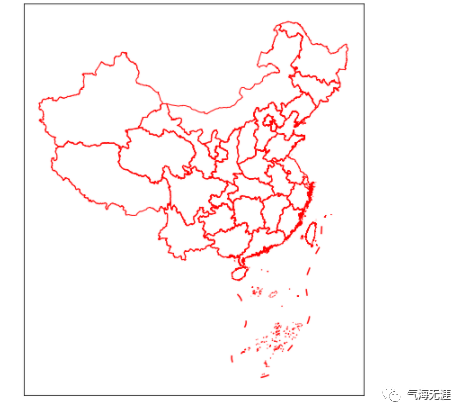
5.定义投影坐标系
1# 定义CRS
2proj = '+proj=aea +lat_1=25 +lat_2=47 +lon_0=105'
3china_proj = china.to_crs(proj)
6.绘图
1fig, ax = plt.subplots(figsize=(8, 8))
2china_proj.plot(ax=ax,facecolor='none',edgecolor='red')
3plt.xticks([])
4plt.yticks([])
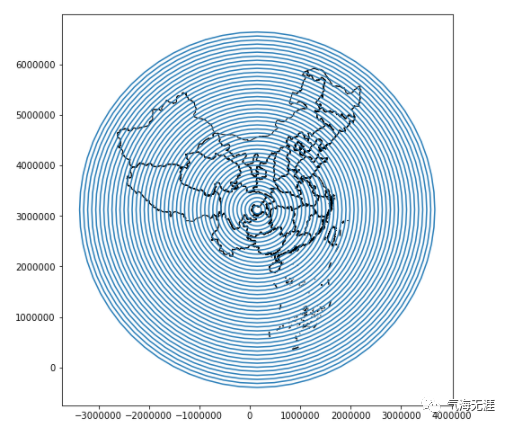
2、线状风格的地图
1fig, ax = plt.subplots(figsize=(8, 8))
2center = gpd.GeoSeries([Point((106.54, 29.56))], crs='EPSG:4326').to_crs(proj)
3circles = gpd.GeoSeries([center[0].buffer(i*1000*80).boundary for i in range(1, 45)], crs=proj)
4china_proj.plot(ax=ax, facecolor='none', edgecolor='black')
5circles.plot(ax=ax)
6plt.xticks([])
7plt.yticks([])
8plt.show()
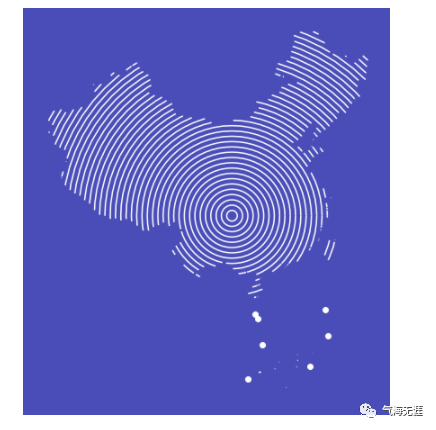
2.精确剪裁
 1fig, ax = plt.subplots(figsize=(8, 8))
 2ax = gpd.clip(circles, mask=china_proj).plot(ax=ax, color='white')
 3ax.set_facecolor('#4a4db7')
 4fig.set_facecolor('#4a4db7')
 5ax.set_xticks([])
 6ax.set_yticks([])
 7ax.spines['left'].set_color('none')
 8ax.spines['top'].set_color('none')
 9ax.spines['right'].set_color('none')
10ax.spines['bottom'].set_color('none')
11plt.xticks([])
12plt.yticks([])
13plt.show()
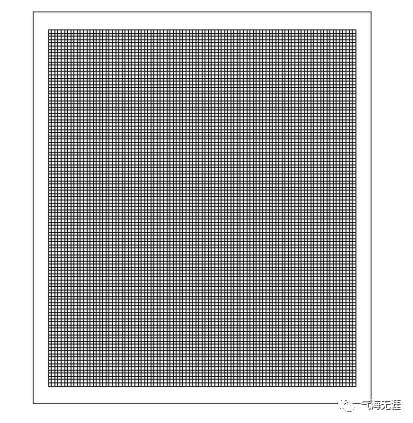
3、像素风格的地图
1.生成网格
 1xmin, ymin, xmax, ymax = china_proj.total_bounds
 2xmin, ymin, xmax, ymax = int(xmin), int(ymin), int(xmax), int(ymax)
 3x = np.arange(xmin, xmax, 50*1000)
 4y = np.arange(ymin, ymax, 50*1000)
 5hlines = [((x1, yi), (x2, yi)) for x1, x2 in zip(x[:-1], x[1:]) for yi in y]
 6vlines = [((xi, y1), (xi, y2)) for y1, y2 in zip(y[:-1], y[1:]) for xi in x]
 7grids = gpd.GeoSeries(list(polygonize(MultiLineString(hlines + vlines))), crs=proj)
 8
 9fig, ax = plt.subplots(figsize=(8, 8))
10grids.plot(ax=ax,facecolor='none', edgecolor='black')
11plt.xticks([])
12plt.yticks([])
13plt.show()
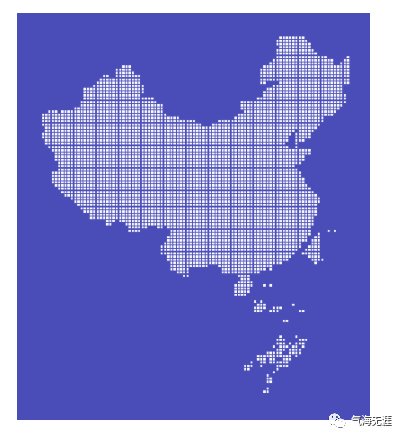
2.调整颜色
 1fig, ax = plt.subplots(figsize=(8, 8))
 2ax.set_facecolor('#4a4db7')
 3fig.set_facecolor('#4a4db7')
 4
 5grids[grids.intersects(border.to_crs(proj).geometry[0])].buffer(distance=-8*1000).plot(facecolor='white', ax=ax)
 6
 7ax.spines['left'].set_color('none')
 8ax.spines['top'].set_color('none')
 9ax.spines['right'].set_color('none')
10ax.spines['bottom'].set_color('none')
11
12plt.xticks([])
13plt.yticks([])
14plt.show()
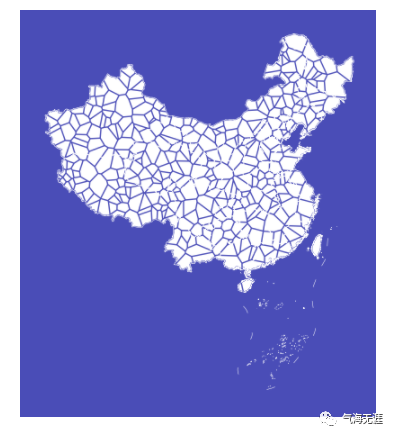
4、不规则多边形地图
1.生成泰森多边形
 1np.random.seed(2021)
 2coords = gpd.GeoSeries([Point(x, y) for x, y in zip(np.random.uniform(xmin, xmax, 1000), np.random.uniform(ymin, ymax, 1000))],crs=proj)
 3coords = coords[coords.within(border.to_crs(proj).geometry[0])]
 4poly_shapes, pts, poly_to_pt_assignments = voronoi_regions_from_coords(np.array(coords.apply(lambda g: (g.x, g.y)).tolist()),
 5                                                                       border.to_crs(proj).geometry[0])
 6
 7fig, ax = plt.subplots(figsize=(8, 8))
 8ax.set_facecolor('#4a4db7')
 9fig.set_facecolor('#4a4db7')
10ax = china_proj.plot(ax=ax, facecolor='none', edgecolor='white', linewidth=0.5)
11gpd.GeoSeries(poly_shapes).buffer(-10*1000).plot(ax=ax,facecolor='white',linewidth=0.2)
12ax.spines['left'].set_color('none')
13ax.spines['top'].set_color('none')
14ax.spines['right'].set_color('none')
15ax.spines['bottom'].set_color('none')
16plt.xticks([])
17plt.yticks([])
18plt.show()
有问题可以到QQ群里进行讨论,我们在那边等大家。
QQ群号:854684131
文章转载自气海无涯,如果涉嫌侵权,请发送邮件至:contact@modb.pro进行举报,并提供相关证据,一经查实,墨天轮将立刻删除相关内容。
