


一、安装模块laspy
1!pip install laspy
2
3Collecting laspy
4  Downloading laspy-1.7.0-py2.py3-none-any.whl (489 kB)
5     |████████████████████████████████| 489 kB 16 kB/s eta 0:00:013
6Requirement already satisfied: numpy in /opt/conda/lib/python3.7/site-packages (from laspy) (1.19.1)
7Installing collected packages: laspy
8Successfully installed laspy-1.7.0
二、读取点云数据(.las)
1from laspy.file import File
2import numpy as np
3inFile = File('/home/kesci/input/Lidar1699/A280841.las', mode='r')
4inFile
1<laspy.file.File at 0x7f19938d5bd0>
查看点数据
1inFile.points
输出:
1array([((279998882, 840896652, 28962, 44,  9, 2,  -6, 88, 126, 421396.02962885),),
2       ((279998641, 840901986, 29189, 47,  9, 2,  -6, 88, 127, 421396.05391633),),
3       ((279997367, 840907512, 29521, 53,  9, 2,  -6, 88, 127, 421396.07820381),),
4       ...,
5       ((281059809, 840080474, 77321, 71, 73, 6, -11, 89, 126, 494310.81103075),),
6       ((281059184, 840080304, 77906, 61, 73, 6, -11, 89, 126, 494310.81104848),),
7       ((281058621, 840080139, 78001, 69, 73, 6, -11, 89, 126, 494310.81106616),)],
8      dtype=[('point', [('X', '<i4'), ('Y', '<i4'), ('Z', '<i4'), ('intensity', '<u2'), ('flag_byte', 'u1'), ('raw_classification', 'u1'), ('scan_angle_rank', 'i1'), ('user_data', 'u1'), ('pt_src_id', '<u2'), ('gps_time', '<f8')])])
获取地理位置和高程信息
1x = inFile.X
2y = inFile.Y
3z = inFile.Z*0.001
查看返回值
1fanhui = inFile.key_point
2fanhui
输出:
1array([0, 0, 0, ..., 0, 0, 0], dtype=uint8)
查看gps时间
1inFile.gps_time
输出:
1array([421396.02962885, 421396.05391633, 421396.07820381, ...,
2       494310.81103075, 494310.81104848, 494310.81106616])
三、点云数据分类
查看分类
1classification = inFile.classification
2classification
1array([2, 2, 2, ..., 6, 6, 6], dtype=uint8)

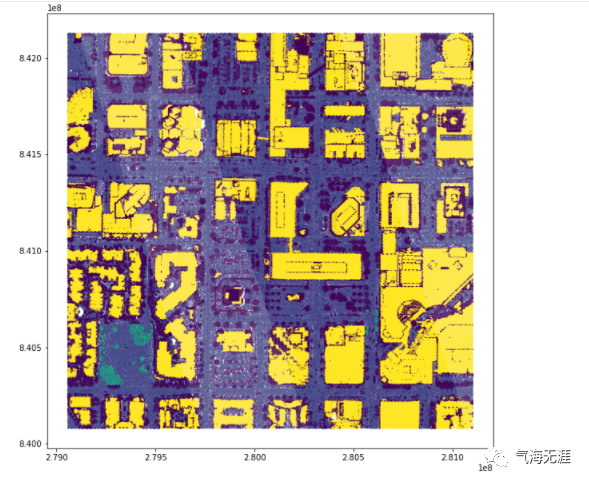
四、点云数据可视化
可视化代码:
1import matplotlib.pyplot as plt
2%matplotlib inline
3fig = plt.figure(figsize=(10,10))
4plt.scatter(x,y,c=classification,s=0.1)
5plt.show()
有问题可以到QQ群里进行讨论,我们在那边等大家。
QQ群号:854684131
文章转载自气海无涯,如果涉嫌侵权,请发送邮件至:contact@modb.pro进行举报,并提供相关证据,一经查实,墨天轮将立刻删除相关内容。
